FZJ–IKP(TH)–2007–07
The cross section from missing mass spectra
Abstract
We utilize existing inclusive data on -meson momentum spectra of the reaction at = 2.3 - 2.85 GeV to deduce total cross sections for . The method used to extract those cross sections is explained and discussed in detail. Our result for = 2.85 GeV is consistent with the data point from a direct measurement at the same beam energy. The cross section obtained for = 2.3 GeV is with considerably smaller than the value found in a recent experiment by the COSY-11 Collaboration at a somewhat lower beam energy, indicating that the reaction cross section could exhibit a rather unusual energy dependence.
pacs:
13.75.Ev Hyperon-nucleon interactions and 13.75.Jz Kaon-baryon interactions and 14.20.Gk Baryon resonances with S=0 and 25.40.Ny Resonance reactions1 Introduction
Recently first near-threshold cross section data for the reaction were published by the COSY-11 Collaboration Rozek . Surprisingly, it turned out that this cross section is larger than the one for by a factor of around 230 at the excess energy =13 MeV and by a factor of around 90 at =60 MeV. The excess energy is defined as , where is the squared invariant collision energy, while , and are the masses of the kaon, the hyperon and the nucleon, respectively. It is also worth mentioning that none of the available model calculations Laget ; Sibirtsev2 ; Tsushima ; Shyam1 ; Zou is able to describe those data. In fact, most of those models underestimate the cross section by an order of magnitude or even more.
Besides this rather large value for the production cross section as compared to the channel, the new results for the reaction are also somewhat startling when compared with the available high energy data. Indeed, one can find only five data points Louttit ; Sondhi ; Dunwoodie ; Chinowsky for at higher energies in the literature. Moreover, those data show large fluctuations, even considering the large experimental uncertainties, and two of those points Dunwoodie were reported only in a preprint. But it is still obvious that the COSY-11 result at =60 MeV Rozek is as large as the cross section measured at higher energies Louttit ; Sondhi ; Chinowsky , suggesting that there could be practically no energy dependence over the large energy region 60 MeV with the mean cross section being 495 b. That is a rather unexpected result since the cross section of , the only well investigated production channel, shows a significant energy dependence, as expected from the increasing phase space for the reaction. Indeed here the cross section changes by a factor of about 40 within the energy range indicated above.
The data points Louttit ; Sondhi ; Dunwoodie ; Chinowsky at high energies are obtained from bubble chamber images where the identification of the as well as the reaction channel was done simultaneously and unambiguously. Therefore, these results at high energies might be fairly reliable. The situation with regard to the more recent counter experiments is different. Here the channel was often not considered because of the substantial difficulties in the final particle identification. The COSY-11 collaboration reconstructs the kaon and neutron four-momenta and identifies the -hyperon by the missing mass. It was found Rozek that the large background under the -signal complicates the data analysis considerably and it introduces large uncertainties. A much better, i.e. direct, identification of the can be done by detecting the decay mode, though then a photon detector is required. Indeed, a corresponding experiment has been already proposed Gillitzer for the WASA detector Adam at the COSY facility.
With the present paper we want to supply some more values for the cross section to the data base. For that aim we utilize available data on inclusive -meson momentum spectra measured at different angles in collisions for the reaction . Since the experimental -meson momentum spectra Hogan ; Siebert ; Reed are available at energies that lie between the data of the COSY-11 Collaboration and the high energy data, the result of our analyis allows conclusions on the behavior of the cross section in this interesting energy region. Some of the spectra are available at energies that overlap with the bubble chamber results Louttit and, therefore, we can also check whether the results based on our method are compatible with the high energy measurement. As a byproduct we also provide cross sections for the reaction and compare them with direct measurements, where the latter are based on the reconstruction of the final particles.
The paper is organized as follows: In Sec. 2 we describe the method. The analysis of the data is presented in Sec. 3. Our results are compared to other available data in Sec. 4. The paper ends with a short summary.
2 Method for the data evaluation
In this section we describe in detail the method for the data analysis. For completeness we include all relevant formulas, although some of them are given in Ref. Byckling . Furthermore, since this method is not limited specifically to but applicable to any reaction with a three-body final state, we provide the formalism in a general form. The cross section for the reaction is given by
| (1) |
where and are the 3-momentum and the energy of the -th particle, respectively, while stands for the 4-momentum. denotes the reaction amplitude and the -function is defined by . We use the invariants
| (2) |
where is the squared missing mass with respect to the first particle, which is identical to the squared invariant mass of the second and third particle. The Lorentz invariant differential cross section for the production of particle is then written as
| (3) |
In the laboratory frame, i.e. for , can be expressed as
| (4) |
where and are the solid and polar production angle of the first particle. In Eq. (3), is the square of the reaction amplitude integrated over the kinematical variables related to the second and third particle. In general depends on (or ), and .
The relation between the differential momentum spectrum measured at the solid angle and the missing mass () spectrum, where , is given by
| (5) |
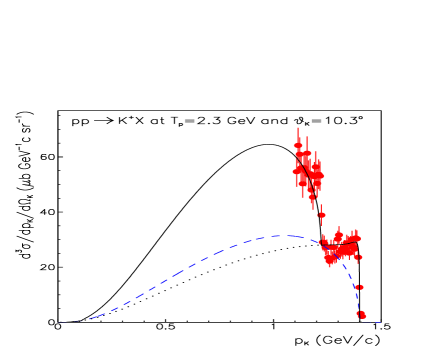
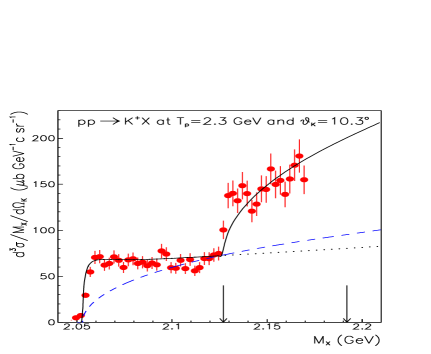
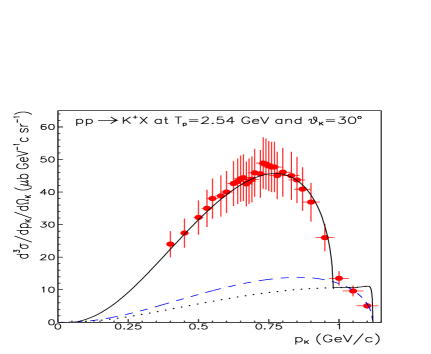
In order to exemplify how we proceed in our analysis let us consider here two typical data samples for the reaction. One is from a measurement at the beam energy =2.3 GeV and the -production angle Siebert and the other at =2.54 GeV and Hogan . Both data sets are shown in Fig. 1, where the left panel illustrates the -meson momentum spectra, while the right panel shows the missing mass spectra obtained by Eq. (5). The arrows in Fig. 1 indicate the and reaction thresholds, respectively. Below the threshold, i.e. for , kaon production is primarily due to the reaction, though contributions from that channel with additional photons (, etc.) are also possible. The contributions to the missing mass spectrum for come from the , and reaction channels and again channels with additional photons. Thus, by subtracting the contribution of in that invariant-mass region one can extract the sum of the and channels, under the assumption that the reactions with photons provide a negligible contribution. For a reliable estimation of the contribution it is crucial to know the -meson spectra below the threshold. Then one can fix the channel directly from those data and use that result for the extrapolation to the invariant-mass region where the channels are open. As is clear from Fig. 1 in some of the available experiments there are only a few data points below the threshold. In such a case there is a sizable uncertainty in the data evaluation, which will be reflected, eventually, in the error bars of the corresponding results. This uncertainty is somewhat reduced if there is at least a clean signal of the opening of the threshold in the spectrum, which is the case for most of the data.
The reaction can be well identified by the detection of the final particles and it has been intensively investigated Sewerin1 ; Kowina1 . This information can then be used to deduce the contribution of the channel from the missing mass spectra of inclusive -meson production in the region for various beam energies. As is obvious from Fig. 1, while some experiments provide information on the -meson momentum spectrum over basically the whole available phase space, this is not the case with others. These limitations again introduce an uncertainty in the data analysis.
For fixing the contribution of the reaction channel to the missing mass spectrum we utilize Eqs. (3) and (5). Specifically, we determine the reaction amplitude from the data for and use that value for the extrapolation to . Since it is well known that the final-state interaction (FSI) is sizable Sibirtsev1 ; Sibirtsev1a we take it into account explicitly. This is done by assuming Watson ; Migdal that the reaction amplitude can be factorized into a practically momentum and energy independent elementary production amplitude and an FSI factor, , where the latter is calculated within the Jost-function approach Goldberger . Details are summarized in Appendix A. As mentioned there, in our analysis we use Jost-function parameters (or equivalently, effective range parameters) from a global fit to the reaction . In principle, one could try to determine those parameters for each data set separately by using the corresponding -spectra Hinterberger ; Gasparyan1 ; Gasparyan2 . But then one would require -spectra with rather good mass resolution and statistical accuracy, which is not always the case as seen in Fig. 1 for =2.54 GeV. Consequently, only some of the data could be analyzed by including FSI effects that are determined by fitting directly to those data themselves.
Thus, we only fix the elementary production amplitude by a fit to the corresponding data for . In practice we determine the constant for each angle and beam energy where experimental mass spectra are available. Then, by averaging the obtained values for (at a specific energy) over the angular dependence we deduce a result for . The latter quantity can then be compared with the amplitudes deduced from directly measured cross sections, cf. the discussion in A and the results presented in Sect. 4. This allows us to examine whether the results we extracted from the measured invariant-mass spectra are consistent with the experimental information on the total production cross sections.
Let us now come back to the invariant mass spectrum. The dotted lines in Fig. 1 show results of a calculation based on Eqs. (3) and (5) with the FSI included via Eq. (8) and the squared reaction amplitude appropriately adjusted to the spectra at . The description of the -meson momentum and missing mass spectra in terms of the contribution from the reaction looks reasonable. Note that so far we have neglected possible contributions from the reactions with photons in the final state, i.e. , etc. However, judging from the measurement where a decent number of data points is available for , there is not much room for such additional contributions anyway.
In order to estimate the uncertainty that could arise from our treatment of the FSI we consider also an alternative procedure. We perform a fit to the invariant mass spectrum without FSI, i.e. with pure phase space. But in this case we consider only data points that lie in an energy interval of about 30 MeV from the threshold downwards for the determination of the reaction amplitude at the various angles and energies. The data points closer to the threshold exhibit, in general, such obvious FSI effects that it is meaningless to try to fit them with pure phase space. The dashed lines in Fig. 1 show those results obtained without inclusion of the FSI. We will use the predictions of those fits for the invariant mass spectrum in the region for extracting the production cross section too. However, we want to emphasize already at this stage that we consider the extrapolation based on the fit that includes the FSI as much more reliable and, therefore, we consider the cross sections deduced from that fit as our definitive results.
Once the contribution from the channel is established we subtract it from the data in the region in order to obtain the sum of the contributions from the and reactions. Possible additional contribution from channels with photons in the final state are again neglected. Utilizing again Eqs. (3) and (5) we determine the corresponding (combined) amplitude for each angle and total energy where experimental mass spectra are available, etc. However, unlike in the channel, now we do not include an FSI factor in the fitting procedure. Indeed, none of the available data sets exhibits a pronouncend enhancement near the threshold that would warrant the inclusion of FSI effects. The solid lines in Fig. 1 show the final result, i.e. the contribution from the reaction plus the fitted contribution from the channels.
3 Data analysis
In the present paper we analyze the measured -meson momentum spectra published in Refs. Hogan ; Siebert ; Reed . The achieved results are summarized in Tables 1 and 2. In order to stay as close as possible to physical quantities we do not list the values obtained for the amplitudes but the corresponding cross sections. However, since those amplitudes correspond to data at different angles it is obvious that the given values are not really total cross sections. Rather, they represent cross sections for specific angles, appropriately normalized to the full solid angle. In order to remind the reader on that we put the superscript on the corresponding symbols ( or ).
| Reference | (GeV) | (MeV) | (degrees) | w/o FSI | with FSI | |
|---|---|---|---|---|---|---|
| (b) | (b) | |||||
| Siebert | 2.3 | 252 | 8.3 | 23.90.7 | 0.80 | 24.20.9 |
| Siebert | 2.3 | 252 | 10.3 | 21.30.6 | 0.72 | 21.80.8 |
| Siebert | 2.3 | 252 | 12.0 | 20.00.6 | 0.68 | 20.60.6 |
| Reed | 2.4 | 285 | 0 | 77.08.9 | 2.1 | 72.99.2 |
| Reed | 2.4 | 285 | 17 | 52.86.7 | 0.9 | 31.38.1 |
| Hogan | 2.54 | 331 | 20 | 31.13.7 | 0.55 | 22.32.9 |
| Hogan | 2.54 | 331 | 30 | 20.52.1 | 0.40 | 16.22.3 |
| Hogan | 2.54 | 331 | 40 | 24.22.3 | 0.40 | 16.22.7 |
| Siebert | 2.7 | 383 | 12.6 | 32.70.3 | 0.6 | 28.00.6 |
| Siebert | 2.7 | 383 | 16.1 | 30.10.7 | 0.55 | 25.70.5 |
| Siebert | 2.7 | 383 | 20 | 30.30.4 | 0.43 | 20.10.5 |
| Siebert | 2.7 | 383 | 23.5 | 20.90.5 | 0.4 | 18.70.6 |
| Reed | 2.85 | 431 | 0 | 120.310.8 | 1.7 | 88.011.2 |
| Reed | 2.85 | 431 | 17 | 39.64.8 | 0.5 | 25.94.2 |
| Reed | 2.85 | 431 | 32 | 28.66.1 | 0.5 | 25.95.3 |
Comparing the resulting values for and at different angles (at a specific energy) allows conclusions on the angular dependence of the reaction. For facilitating an easy general examination of that dependence we introduce the quantity which is the ratio of and the corresponding (genuine) total cross section obtained from the reference amplitude (16) in conjuction with Eq. (11). Evidently, if there is full consistency between the latter parametrization of the experimental total cross section and the result stemming from our evaluation of the missing mass spectrum then the average of over the kaon angles would amount to unity.
Note that we have neglected the difference between the and masses and between the and masses in calculating the excess energies. These are inessential at the high reaction energies we are dealing with here.
| Reference | (GeV) | (MeV) | (degrees) | w/o FSI | with FSI | ||
|---|---|---|---|---|---|---|---|
| (b) | /ndf | (b) | /ndf | ||||
| Siebert | 2.3 | 178 | 8.3 | 13.71.0 | 1.3 | 14.70.9 | 0.9 |
| Siebert | 2.3 | 178 | 10.3 | 16.91.1 | 1.5 | 18.01.0 | 1.6 |
| Siebert | 2.3 | 178 | 12.0 | 20.01.2 | 1.2 | 19.51.0 | 2.1 |
| Reed | 2.4 | 211 | 0 | 32.512.9 | 0.5 | 36.110.8 | 0.1 |
| Reed | 2.4 | 211 | 17 | 19.06.1 | 0.2 | 50.613.2 | 1.2 |
| Hogan | 2.54 | 257 | 20 | 32.02.4 | 0.6 | 41.42.5 | 0.1 |
| Hogan | 2.54 | 257 | 30 | 41.01.8 | 0.1 | 45.71.8 | 0.2 |
| Hogan | 2.54 | 257 | 40 | 34.22.8 | 3.5 | 42.42.8 | 0.4 |
| Siebert | 2.7 | 309 | 12.6 | 37.90.8 | 5.7 | 47.80.5 | 7.6 |
| Siebert | 2.7 | 309 | 16.1 | 50.41.4 | 2.9 | 54.21.4 | 2.6 |
| Siebert | 2.7 | 309 | 20 | 51.10.9 | 5.5 | 62.70.9 | 4.2 |
| Siebert | 2.7 | 309 | 23.5 | 28.41.5 | 1.7 | 30.61.1 | 1.6 |
| Reed | 2.85 | 357 | 0 | 60.16.8 | 1.3 | 82.514.3 | 0.1 |
| Reed | 2.85 | 357 | 17 | 76.710.0 | 0.5 | 73.414.9 | 0.3 |
| Reed | 2.85 | 357 | 32 | 23.47.8 | 2.0 | 20.08.6 | 0.8 |
As already mentioned, a major source for systematical uncertainties in the data analysis by the method described above is due to the extrapolation of the mass spectrum to the region . It is clear from Fig. 1 that the parametrization including the FSI still differs from the pure phase-space behavior in that region and, therefore, it affects the absolute value of the extracted production cross section. Thus, in order to estimate the uncertainty due to the extrapolation we determine (by a fit based on Eqs. (3) and (5)) for two scenarios: We subtract the contribution from the (i) including FSI effects as shown by the dotted line in Fig. 1, and (ii) without FSI as given by the dashed line in Fig. 1. Both results for are given in Table 2.
We should mention that even within the Jost-function approach it is not always possible to reproduce the -spectra around the threshold in a perfect way. That might be a problem related to the use of the Jost function formalism or simply due to uncertainties of the parameters and (10) used in Eq. (8). In any case, such more subtle aspects of the FSI do not influence the shape of the -spectra above the threshold significantly and are, therefore, not relevant for us.
Let us now discuss the different data sets for the reaction one by one. Fig. 2 shows the missing mass spectra from Ref. Siebert at the proton beam energy of 2.3 GeV and kaon production angles of , 10.3o and 12o. The dashed lines are the results for the reaction fitted with a constant reaction amplitude alone, while the dotted lines indicate corresponding results including the FSI.
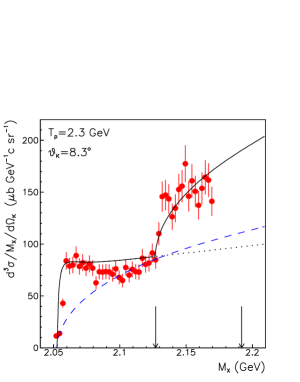
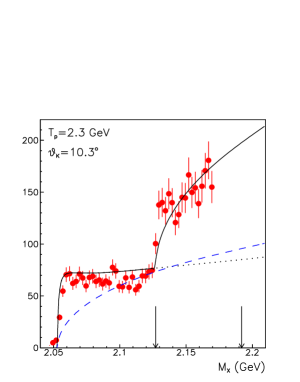
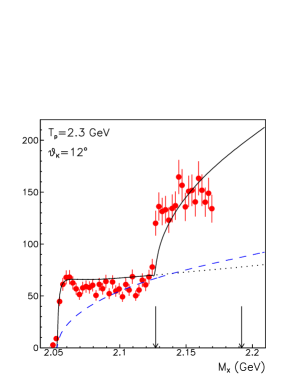
The -spectra exhibit a substantial enhancement close to the threshold that originates from the FSI. Note that the shape of the near threshold spectra depends somewhat on the -meson production angle and is not reproduced perfectly by using the Jost function (Eq. (8)), especially at the angles and 12o. As was shown in Ref. Hinterberger the -dependence generated by Eq. (8) can be varied by changing the parameters and and, in principle, it is possible to achieve a better description of the spectra around the threshold by allowing and to depend on the angle. However, all those variations have only a marginal influence on the description of the missing mass spectra above the threshold, which is the region we are interested in in the present analysis.
The solid lines in Fig. 2 show the sum of the , and channels where the contribution of the latter two channels was determined by a fit to the difference between the experimental spectra and the contribution from the reaction (including FSI effects) via Eqs. (3) and (5). In Tables 1 and 2 we list the corresponding values for and determined from the -spectra for the cases with and without inclusion of the FSI. The quality of the least-square fit can be judged from the given reduced . As can be seen from the table, there is practically no difference between the results obtained with and without FSI. This is primarily due to the fact that there are sufficient and accurate data on the mass spectrum below the threshold. Moreover, this threshold is clearly mapped out.
Fig. 3 shows the -spectra from Ref. Reed at the proton beam energy of 2.4 GeV and kaon production angles of and 17o. The notation for the lines are the same as in Fig. 2. Here the threshold is hardly visible in the data, especially at the larger angle, and accordingly there are huge differences in the extracted cross sections between the scenarios with and without FSI, cf. Tables 1 and 2. Ultimately, this is also reflected in the large error bars for the extracted value of . Please recall that the contributions are fitted to the invariant mass spectrum in the range , i.e. between the arrows shown in the figures, which explains why the corresponding curves are in line with the data in that region but deviate from those at higher values.
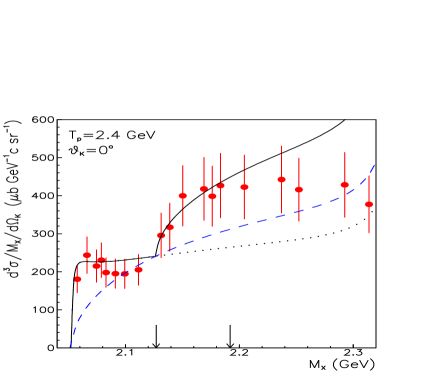
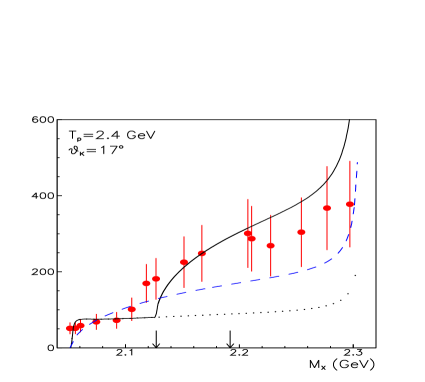
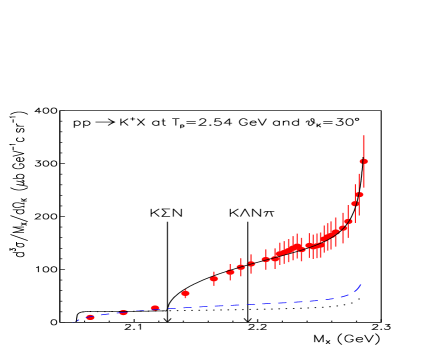
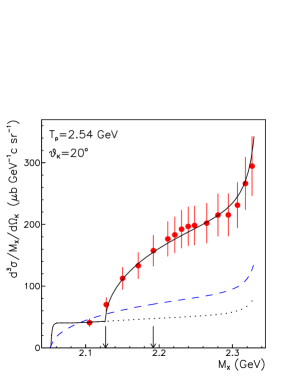
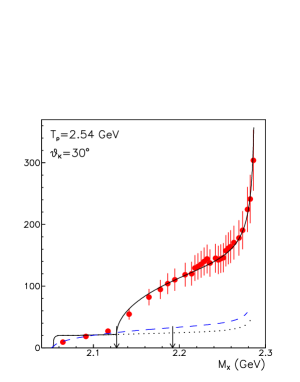
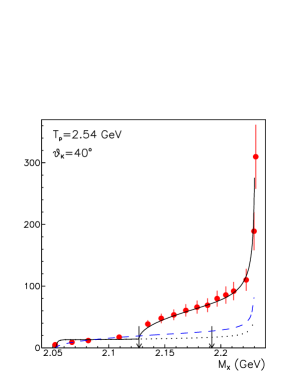
Fig. 4 shows the missing mass spectra from Ref. Hogan at the proton beam energy of 2.54 GeV and kaon production angles of , 30o and 40o. There are only few points below the threshold and from those it is hard to see whether there is actually an enhancement due to the FSI. Note that at this specific energy the description of the missing mass spectra for large -meson production angles is very good, in particular, also for the data points above the threshold. Thus, there seems to be not much room for contributions from the reaction channel with an additional pion.
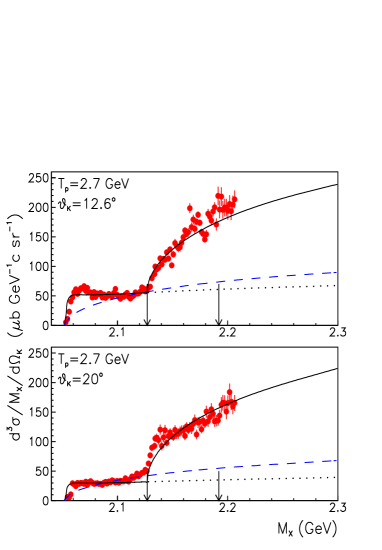
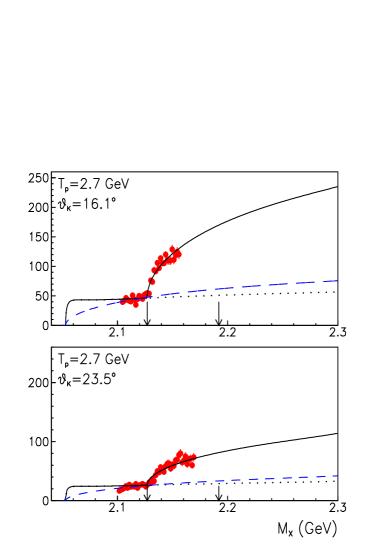
The missing mass spectra from Ref. Siebert at the proton beam energy of 2.7 GeV and kaon production angles of , 16.1o, 20o and 23.5o are shown in Fig. 5. The data at and indicate an enhancement due to the FSI and are well reproduced.
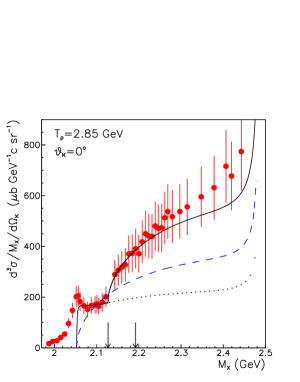
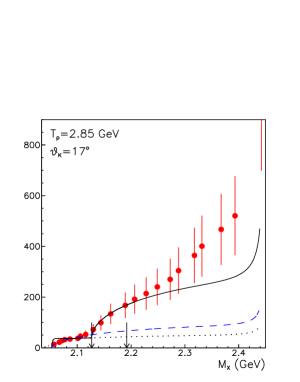
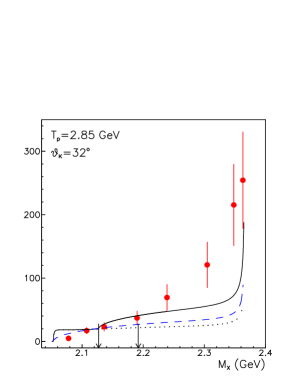
Fig. 6 shows the missing mass spectra from Ref. Reed at the proton beam energy of 2.85 GeV and kaon production angles of , 17o and 32o. The -spectrum at =0o indicates a very strong enhancement due to the FSI. On the other hand, it is somewhat disturbing that there are also data points below the threshold, i.e. outside of the kinematically allowed region. As stated in Ref. Reed , this could be due to the momentum resolution of the measurement. In any case, those questionable events do not influence the extraction of the production cross section from the data.
4 Results and discussion
From the results collected in Tables 1 and 2 one can see that the fit to some of the data yielded a rather small , reflecting the large statistical and systematical uncertainties of the experiments. The fit to the data at GeV, on the other hand, leads to a rather large because we assume that the missing mass spectra are smooth and, therefore, we cannot describe the large fluctuation of the data for which very small statistical errors are given, as can be seen in Fig. 5.
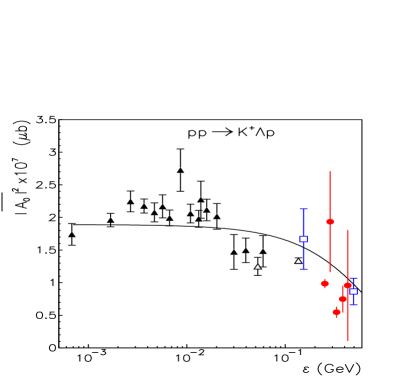
Let us first comment on the factor, the indicator for the -angular dependence of the reaction amplitude. The spectra available at indicate a large and, therefore, a strong forward peaking of . All other data show a smooth -dependence within the range . In general, for the factor is about so that the corresponding angle-averaged amplitude is smaller than the reference amplitude for the reaction computed from Eq. (16), which represents a fit to the measured total reaction cross section. Corresponding results are displayed in the left panel of Fig. 7. We want to point out, however, that for excess energies MeV the uncertainty for as determined directly from available data points from bubble chamber measurements is also in the order of a factor of 2, cf. the squares in Fig. 7. Therefore, we conclude that there is a reasonable consistency between the squared reaction amplitudes deduced from the missing mass and the values obtained from direct measurements.
Based on the values for at the same excess energies and for different from Table 2 we can calculate the mean value and the standard deviation for the total reaction cross section, cf. Table 3 and the right panel of Fig. 7 (circles). Although for some energies the standard deviations are very large, there is reasonable overall agreement between the results extracted from the missing mass spectra and the cross section data from direct measurements.
| (MeV) | (b) | |
|---|---|---|
| our evaluation | missing mass spectrum | |
| from Ref. | ||
| 252 | 22.21.5 | Siebert |
| 285 | 52.120.8 | Reed |
| 331 | 18.22.9 | Hogan |
| 383 | 23.13.8 | Siebert |
| 431 | 46.629.3 | Reed |
| direct measurements | Ref. | |
| 138 | 12.00.4 | Bilger1 |
| 157 | 185 | Ficki |
| 431 | 5112 | Louttit |
| (MeV) | (b) | (b) | (b) | |
| our evaluation | missing mass spectrum | |||
| from Ref. | ||||
| 178 | 17.72.3 | 4.00.3 | 13.72.3 | Siebert |
| 212 | 43.47.3 | 5.20.5 | 38.27.3 | Reed |
| 258 | 43.21.8 | 6.90.7 | 36.31.9 | Hogan |
| 309 | 48.8 11.8 | 8.91.0 | 39.911.8 | Siebert |
| 357 | 58.627.6 | 10.61.3 | 48.627.6 | Reed |
| direct measurements | Ref. | |||
| 13 | 0.0200.003 | 4.560.942.7 | Rozek | |
| 60 | 0.4820.144 | 44.810.715.2 | Rozek | |
| 357 | 137 | 4713 | Louttit | |
| 728 | 253 | 48.13.5 | Sondhi | |
| 849 | 274 | 8512 | Dunwoodie | |
| 1006 | 17 | 577 | Chinowsky | |
| 1156 | 253 | 8511 | Dunwoodie | |
The sum of the and cross sections (), extracted from the missing spectra, shows a more significant angular dependence only at the highest excess energy of =356.8 MeV, cf. Table 2. For the other energies the dependence of on the -meson production angle is relatively smooth, at least within the uncertainties of the extracted values. From Table 2 one can also see that neglecting the FSI in the extraction procedure yields results for which are, in general, somewhat smaller. But it is reassuring to see that in most of the cases the error bars obtained for the ’s with and without inclusion of the FSI overlap, indicating that the results are not too sensitive to the specific subtraction prescription. There are only a few cases where there are indeed dramatic differences between the values for the two considered options. As already said, we consider the extrapolation based on the fit that includes the as much more reliable and, therefore, we consider the cross sections deduced from that fit as our definitive results. Averaging over the values extracted at different -meson angles we can now evaluate the production cross section, , and determine the standard deviation for the results obtained from the fit to the -spectra. The corresponding values, for the case where the FSI was taken into account, are listed in Table 4.
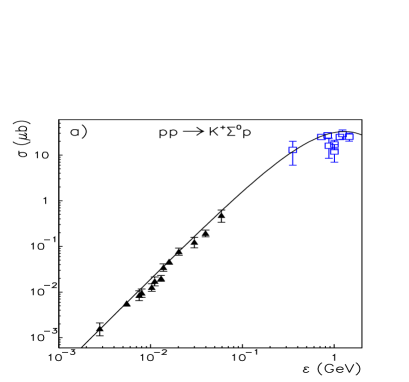
In order to deduce the cross section one needs to subtract from the cross section. In Fig. 8a we show the existing data for the reaction as a function of the excess energy. The circles are from the COSY-11 Collaboration Sewerin1 ; Kowina1 , while the open squares are bubble chamber data Baldini . Presently there are no experimental results available for MeV, i.e. for the energy range of our analysis. The measurements from the TOF-Collaboration that cover the energy range of our interest are still at the stage of being analysed TOF . Therefore, to proceed further, we fit the total reaction cross section by Eq. (11) with , i.e. by neglecting the FSI, and with the appropriate kinematics for the channel. The resulting squared reaction amplitude is
| (6) |
with the excess energy given in GeV. Note that the omission of possible FSI effects is in line with the experimental evidence for the channel Sewerin1 ; Kowina1 – the available data do not show any visible indication for such a FSI Sibirtsev1a ; Kowina1 . It is also in line with the conclusions we draw from inspecting the experimental mass spectra analysed in the present paper, which likewise exhibit no sign for the presence of a FSI effects.
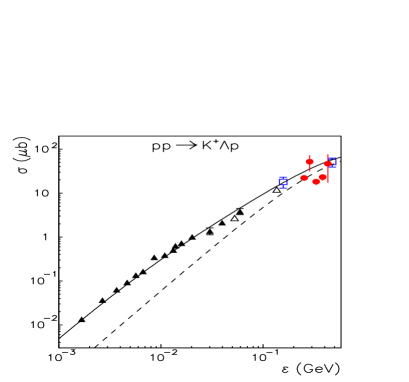
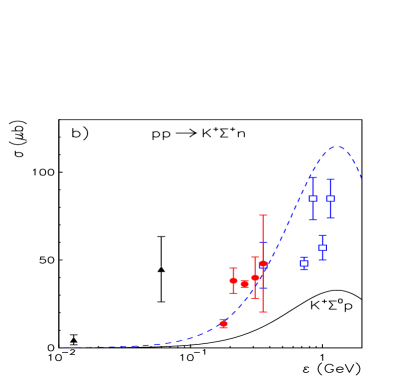
The parameterization (6) allows us to calculate the cross section for each of the excess energies, where data on the reaction exist. The corresponding values are listed in Table 4. The last column in Table 4 is the difference between and the cross section, which we identify with the cross section. The results are also shown in Fig. 8b (circles). Note that a linear scale is used for displaying the cross section!
First let us compare our results with the bubble chamber data Louttit ; Sondhi ; Dunwoodie ; Chinowsky shown by the open squares in Fig. 8b and listed also in Table 4. The cross section of 4713 b at =357 MeV was measured by Louttit et al. Louttit and it is in agreement with our result at the same energy, cf. Table 4 – though, unfortunately, at this highest energy of our analysis there is a large uncertainty due to the angular dependence of the extracted cross section as can be seen from Table 2. The data Sondhi ; Dunwoodie ; Chinowsky at higher energies indicate large fluctuations. We want to remark that the two points at 0.85 and 1.1 GeV represent the largest reported cross sections with 85 b (at both energies) and are available Dunwoodie only in an UCLA preprint. For the lowest energy where missing mass spectra are available, =178 MeV, we deduced a cross section of from the data. There are two so far unpublished measurements of the cross section by the TOF collaboration at somewhat lower energy, i.e. at beam momenta of 2.06 GeV (=98 MeV) Schoen and 2.157 GeV (=128 MeV) Karsch , respectively. It is worth mentioning that their results are roughly in line with the value we obtained. The results from the COSY-11 Collaboration at low excess energies have been available only recently Rozek . Their cross section of at =60 MeV is as large as those at high energies, cf. Table 4 and Fig. 8.
For illustration purposes we include the result for the cross section also in Fig. 8b (solid line). The dashed line shows the same cross section, but multiplied by a factor 3.5. Obviously its energy dependence is very different from that exhibited by the cross section if one considers all available data. However, it is interesting to see that the curve would be roughly in line with the trend of the data, including the ones obtained from our analysis, if one disregards the COSY-11 events and the measurements from Refs. Sondhi ; Chinowsky . The data from the last two references are in clear contradiction to the results from Ref. Dunwoodie anyway. On the other hand, one has to keep in mind that the latter data were never officially published.
Provided that all data are indeed correct, it will be difficult to find plausible explanations for the drastically different behavior of the cross section. The model calculations Laget ; Sibirtsev2 ; Tsushima ; Shyam1 ; Zou available for this reaction channel indicate that the energy dependence of the cross section is similar to the one of . After all, the energy dependence is to a considerable part determined simply by phase-space factors. Evidently, the model predictions Laget ; Sibirtsev2 ; Tsushima ; Shyam1 disagree strongly with the new data Rozek of the COSY-11 Collaboration. Since those calculations describe the , and reactions with the same dynamical input, additional mechanisms can be introduced only by assuming that they contribute to the channel alone. But not even a recent study that focusses on the reaction only and invokes contributions from the (1620) resonance is able to describe the COSY-11 data satisfactorily Zou . Of course, possible additional contributions could arise from the excitation of crypto-exotic baryons, as was speculated in Ref. Rozek , that then decay into the channel. Such crypto-exotic baryons were discussed Sibirtsev3 recently in the context of the new ANKE-COSY results Hartmann on -meson production. An indication for a possible crypto-exotic baryon was also reported in Ref. Antipov , based on an analysis of the invariant mass spectrum.
Anyway, instead of embarking on further speculations we believe that it would be more instructive to perform new measurements of the reaction in the near-threshold region. The method used in the present paper can be also applied in the analysis of data that can be taken at ANKE Barsov and HIRES Hires at COSY. These experimental facilities are perfectly suited for obtaining -meson spectra with high statistics and high resolution. Such exeriments would also allow to shed light on the angular dependence of the reaction amplitude, which we expect to be very weak at low excess energies.
5 Summary
In the present paper we determined the sum of the and cross sections from inclusive -meson momentum spectra in the energy range = 2.3 - 2.85 GeV, available in the literature. We showed that, after transformation of the momentum spectrum to the missing mass () spectrum, the contribution from the reaction channels with and hyperons can be isolated by inspecting the data between the , , and thresholds and we demonstrated that the -spectra can be well described when taking into account the contributions from the , and reactions. The angular dependence of the reaction amplitude was accounted for by fitting the -meson spectra at different angles. Total cross sections were then deduced by averaging over the angles.
As a test we first determined the cross sections at those excess energies where the invariant mass spectra are availabe. It turned out that the cross sections extracted by us are roughly in line with results from direct measurements in the same energy region.
Utilizing available information on the cross section, we then deduced total cross sections for the channel. The obtained results were discussed and compared with existing data from direct measurements. At the specific energy = 2.85 GeV there is also a data point from a bubble chamber measurement Louttit and it was reassuring to see that our result is compatible with that experiment. The cross section obtained for = 2.3 GeV is with considerably smaller than the value found in a recent experiment by the COSY-11 Collaboration at a somewhat lower beam energy Thus, our new cross section values, together with the already available data, indicate that the energy dependence of the cross section for the reaction could differ drastically from that of the channel. This would be certainly rather surprising. Apparently, further experiments are necessary to confirm this unusual behaviour. If such experiments indeed corroborate the present findings then it is likely that peculiar and potentially exotic mechanisms play a role in the reaction .
Acknowledgments
This work was partially supported by Deutsche Forschungsgemeinschaft through funds provided to the SFB/TR 16 “Subnuclear Structure of Matter”. This research is part of the EU Integrated Infrastructure Initiative Hadron Physics Project under contract number RII3-CT-2004-506078. A.S. acknowledges support by the COSY FFE grant No. 41760632 (COSY-085) and the JLab grant SURA-06-C0452.
Appendix A Treatment of the final-state interaction
In the present work we take into account effects of the final-state interaction in the channel. Following standard arguments Watson ; Migdal we assume that the reaction amplitude can be factorized into a practically momentum and energy independent elementary production amplitude and an FSI factor:
| (7) |
The FSI effects are then taken into acount within the Jost function approach
| (8) |
where the momentum is given by
| (9) |
and the parameters and were taken as
| (10) |
These parameters are related to the scattering length and effective range of the interaction Sibirtsev1 . To be specific, they correspond to the values = -1.8 fm and = 2.8 fm. The parameters of the FSI that we use here were obtained in Refs. Sibirtsev1 ; Sibirtsev1a from a global phenomenological analysis of all available data on the reaction . But, one should keep in mind that the scattering parameters are not fixed uniquely. Actually, we have shown in Ref. Sibirtsev1 that a large set of different values for the scattering length and effective range allows to reproduce the energy dependence of the cross section data. Some of these parameters coincide with results predicted by modern models Rijken ; Hammer ; Haidenbauer1 ; Henk ; Rijken06 .
Based on Eqs. (7-8) one can then write the total reaction cross section for the reaction in the form Sibirtsev1
| (11) |
Here is the (angle) averaged reaction amplitude squared while is a factor that represents the FSI effects. The 3-body phase space is
| (12) |
In the nonrelativistic limit it reduces to
| (13) |
The non-relativistic form is a good approximation for the reaction up to excess energies of 1 GeV and we use it in the present investigation. Also, in this case the factor can be computed analytically for the Jost function approach (8), and under the assumption that there is only a FSI in the system Sibirtsev1 . It amounts to
| (14) |
where stands for the reduced mass
| (15) |
and the parameters and for the FSI given by Eq. (10). Note that in case that FSI effects are neglected.
The reaction can be directly identified through the detection of the final particles and, therefore, there are already many precise cross section data available in the literature Balewski1 ; Sewerin1 ; Kowina1 ; Bilger1 ; Baldini . These data, displayed in Fig. 7 (right side), allow a straight-forward determination of the squared reaction amplitude by means of Eq. (11). Corresponding results are shown in Fig. 7 on the left hand side. For our purposes it is also convenient to parametrize the experimental cross section by means of a simple function. This is achieved with
| (16) |
where the parameters were determined by a fit to the data in Fig. 7 for energies 500 MeV. Here is the excess energy in GeV. The corresponding curve, including also the FSI via Eq. (14), is shown by the solid line in Fig. 7.
References
- (1) T. Rozek et al., Phys. Lett. B 643, 251 (2006) [arXiv: nucl-ex/0607034].
- (2) J.M. Laget, Phys. Lett. B 259, 24 (1991).
- (3) A. Sibirtsev, K. Tsushima, W. Cassing, A.W. Thomas A W, Nucl. Phys. A 646, 427 (1999) [arXiv: nucl-th/9810070].
- (4) K. Tsushima, A. Sibirtsev, A.W. Thomas, Phys. Rev. C 59, 369 (2000) [arXiv: nucl-th/9801063].
- (5) R. Shyam, Phys. Rev. C 73, 035211 (2006) [arXiv: nucl-th/0512007].
- (6) J.J. Xie, B.S. Zou, arXiv: nucl-th/0701021.
- (7) R.I. Louttit et al., Phys. Rev. 123, 1465 (1961).
- (8) I. Sondhi et al. Phys. Lett. B 26, 645 (1968).
- (9) W.M. Dunwoodie UCLA Report No. UCLA-1033 (1968) unpublished.
- (10) W. Chinowsky et al. Phys. Rev. 165, 1466 (1968).
- (11) A. Gillitzer, D. Grzonka, Int. J. Mod. Phys. A 20, 539 (2005).
- (12) H.H. Adam et al., arXiv: nucl-ex/0411038.
- (13) W.J. Hogan, P.A. Piroue, J.S. Smith, Phys. Rev. 166, 1472 (1968).
- (14) R. Siebert et al., Nucl. Phys. A 567, 819 (1994).
- (15) J.T. Reed et al., Phys. Rev. 168, 1495 (1968).
- (16) E. Byckling, K. Kajantie, Particle Kinematics Willey and Sons, New York (1973).
- (17) A. Sibirtsev, J. Haidenbauer, H.-W. Hammer, S. Krewald, Eur. Phys. J. A 27, 269 (2006) [arXiv: nucl-th/0512059].
- (18) A. Sibirtsev, J. Haidenbauer, H.-W.Hammer, U.-G. Meißner, Eur. Phys. J. A 29, 363 (2006) [arXiv: hep-ph/0608098].
- (19) K. Watson, Phys.Rev. 88, 1163 (1952).
- (20) A.B. Migdal, Sov. Phys. JETP 1, 2 (1955).
- (21) M. Goldberger, K.M. Watson, Collision Theory Willey, New York. (1964).
- (22) F. Hinterberger, A. Sibirtsev, Eur. Phys. J. A 21, 313 (2004) [arXiv: nucl-ex/0402021].
- (23) A. Gasparyan, J. Haidenbauer, C. Hanhart, J. Speth, Phys. Rev. C 69, 034006 (2004) [arXiv: hep-ph/0311116].
- (24) A. Gasparyan, J. Haidenbauer, C. Hanhart, Phys. Rev. C 72, 034006 (2005) [arXiv: nucl-th/0506067].
- (25) J.T. Balewski et al., Phys. Lett. B 420, 211 (1998) [arXiv: nucl-ex/9803003].
- (26) S. Sewerin et al., Phys. Rev. Lett. 83, 682 (1999). [arXiv: nucl-ex/9811004].
- (27) P. Kowina et al., Eur. Phys. J. A 22, 293 (2004) [arXiv: nucl-ex/0402008].
- (28) R. Bilger et al., Phys. Lett. B 420, 217 1998
- (29) A. Baldini, V. Flaminio, W.G. Moorhead, D.R.O. Morrison, Landolt-Börnstein New Series 12, 149 (1998).
- (30) TOF-COSY Collaboration, private communication
- (31) E. Bierman, A.P. Colleraine, U. Nauenberg, Phys. Rev. 147, 922 (1966).
- (32) P. Schönmeier, PhD thesis, Technical University of Dresden, Germany (2003) unpublished.
- (33) L. Karsch, PhD thesis, Technical University of Dresden, Germany (2005) unpublished.
- (34) A. Sibirtsev, J. Haidenbauer, Ulf-G. Meißner, Eur. Phys. J. A 27, 263 (2006). [arXiv: nucl-th/0512055].
- (35) M. Hartmann et al., Phys. Rev. Lett. 96, 242301 (2006) [arXiv: hep-ex/0604010].
- (36) Yu.M. Antipov et al., Phys. Atom. Nucl. 65, 2070 (2002).
- (37) S. Barsov et al., Nucl. Instr. Meth. A 462, 364 (2001)
- (38) F. Hinterberger, S.N. Nedev, R. Siudak, Int. J. Mod. Phys. A 20 291 (2005).
- (39) W.J. Fickinger, E. Pickup, D.K. Robinson, E.O. Salant, Phys. Rev. 125, 2082 (1962).
- (40) T.A. Rijken, V.G.J. Stoks, Y. Yamamoto, Phys. Rev. C 59, 21 (1999) [arXiv: nucl-th/9807082].
- (41) H.-W. Hammer, Nucl. Phys. A 705, 173 (2002) [arXiv: nucl-th/0110031].
- (42) J. Haidenbauer, Ulf-G. Meißner, Phys. Rev. C 72, 044005 (2005) [arXiv: nucl-th/0506019].
- (43) H. Polinder, J. Haidenbauer, Ulf-G. Meißner Ulf-G Nucl. Phys. A 779, 244 (2006) [arXiv: nucl-th/0605050].
- (44) T. A. Rijken, Y. Yamamoto, Phys. Rev. C 73, 044008 (2006) [arXiv: nucl-th/0603042].