Transversity and Collins functions from SIDIS and data
M. Anselmino
Dipartimento di Fisica Teorica, Università di Torino and
INFN, Sezione di Torino, Via P. Giuria 1, I-10125 Torino, Italy
M. Boglione
Dipartimento di Fisica Teorica, Università di Torino and
INFN, Sezione di Torino, Via P. Giuria 1, I-10125 Torino, Italy
U. D’Alesio
Dipartimento di Fisica, Università di Cagliari and
INFN, Sezione di Cagliari,
C.P. 170, I-09042 Monserrato (CA), Italy
A. Kotzinian
Yerevan Physics Institute, 375036 Yerevan, Armenia,
JINR, 141980 Dubna, Russia, and
INFN, Sezione di Torino, Via P. Giuria 1, I-10125 Torino, Italy
F. Murgia
Dipartimento di Fisica, Università di Cagliari and
INFN, Sezione di Cagliari,
C.P. 170, I-09042 Monserrato (CA), Italy
A. Prokudin
Dipartimento di Fisica Teorica, Università di Torino and
INFN, Sezione di Torino, Via P. Giuria 1, I-10125 Torino, Italy
C. Türk
Dipartimento di Fisica Teorica, Università di Torino and
INFN, Sezione di Torino, Via P. Giuria 1, I-10125 Torino, Italy
Abstract
A global analysis of the experimental data on azimuthal asymmetries in
semi-inclusive deep inelastic scattering (SIDIS),
from the HERMES and COMPASS Collaborations, and in
processes, from the Belle Collaboration, is performed. It results in the
extraction of the Collins fragmentation function and,
for the first time, of the transversity distribution function for
and quarks. These turn out to have opposite signs and to be sizably
smaller than their positivity bounds. Predictions for the azimuthal asymmetry
, as will soon be measured at JLab and
COMPASS operating on a transversely polarized proton target, are then
presented.
pacs:
13.88.+e, 13.60.-r, 13.66.Bc, 13.85.Ni
I Introduction
The transversity distribution function, usually denoted as
or , together with the unpolarized
distribution functions and the helicity distributions
, contains basic and necessary information for a full
understanding of the quark structure, in the collinear,
integrated configuration, of a polarized nucleon.
The distribution of transversely polarized quarks in a transversely
polarized nucleon, , is so far unmeasured. The reason is
that, being related to the expectation value of a chiral-odd quark operator,
it appears in physical processes which require a quark helicity flip: this
cannot be achieved in the usual inclusive DIS, due to the helicity conservation
of perturbative QED and QCD processes.
The problem of measuring the transversity distribution has been largely
discussed in the literature Barone:2001sp . The most promising approach
is considered the double transverse spin asymmetry in Drell-Yan
processes in interactions at a squared c.m. energy of the order of
200 GeV2, which has been proposed by the PAX Collaboration
Barone:2005pu ; Anselmino:2004ki ; Efremov:2004qs ; Pasquini:2006iv . However, this requires
the availability of polarized antiprotons, which is an interesting, but
formidable task in itself. Meanwhile, the most accessible channel, which
involves the convolution of the transversity distribution with the Collins
fragmentation function Collins:1992kk , is the azimuthal asymmetry
in SIDIS processes, namely
. This is the strategy being pursued by
HERMES, COMPASS and JLab Collaborations.
A crucial improvement, towards the success of this strategy, has been recently
achieved thanks to the independent measurement of the Collins function (or
rather, of the convolution of two Collins functions), in
unpolarized processes by Belle Collaboration at
KEK Abe:2005zx . By combining the SIDIS experimental data from
HERMES Airapetian:2004tw ; HERMES:proceedings and COMPASS Ageev:2006da , with the
Belle data, we have, for the first time, a large enough set of data points
as to attempt a global fit which involves, as unknown functions, both the
transversity distributions and the Collins fragmentation functions of
and quarks.
In Section II we briefly remind the basic formalism involved in the
description of the SIDIS asymmetry , and in
Section III we develop, in somewhat greater detail, a similar formalism
for the azimuthal correlations, involving two Collins functions, measured
by Belle in processes. In Section IV
we perform
a global fit of HERMES Airapetian:2004tw ; HERMES:proceedings , COMPASS Ageev:2006da
and Belle Abe:2005zx data, in order to extract simultaneously
the Collins fragmentation function and the
transversity distribution function for .
We then use, in Section V, the transversity distributions and the Collins
functions so determined, to give predictions for forthcoming experiments at
JLab and CERN-COMPASS. Comments and conclusions are gathered in
Section VI.
II Transversity and Collins functions from SIDIS processes
The exact kinematics for SIDIS
processes in the c.m. frame, including all intrinsic motions,
was extensively discussed in Ref. Anselmino:2005nn , and is schematically
represented in Fig. 1. We take the virtual photon and the
proton colliding along the -axis with momenta and
respectively, and the leptonic plane to coincide with the plane.
We work in the kinematic regime in which
, where is the magnitude of the
intrinsic transverse momentum of the initial quark with respect
to the parent proton and is the magnitude of the final hadron
transverse momentum. We neglect second order corrections in the
expansion: in this approximation, the transverse momentum of the
observed hadron with respect to the direction of the fragmenting quark
is related to and by the simple expression
; in addition, the lightcone momentum
fractions and coincide with the usual measurable SIDIS variables,
and .
In this region factorization holds Ji:2004xq ; Ji:2004wu , leading order
elementary processes are dominating and the soft
of the detected hadron is mainly originating from intrinsic motions.
Figure 1: Three dimensional kinematics of the SIDIS process, according
to Trento conventions Bacchetta:2004jz . The photon and the proton
collide along the -axis, while the leptonic plane defines the
plane. The fragmenting quark and the final hadron are emitted
at azimuthal angles and , and the proton transverse spin
direction is identified by .
The transverse single spin asymmetry (SSA) for this process is defined as
(1)
where is a short hand notation for
. It will often happen, in comparing
with data or giving measurable predictions, that the numerator and denominator
of Eq. (1) will be integrated over some of the variables,
according to the kinematical coverage of the experiments.
and refer, respectively, to polarization vectors
and , see Fig. 1.
A full study of Eq. (1), with all contributions at all
orders in , will be presented in a forthcoming paper
sidis-general .
We consider here, at , the
weighted asymmetry,
(2)
measured by the HERMES Airapetian:2004tw ; HERMES:proceedings and COMPASS
Ageev:2006da Collaborations.
This asymmetry singles out the spin dependent part of the fragmentation
function of a transversely polarized quark with spin polarization and
three-momentum :
(3)
resulting in
(4)
In the above equation is the unintegrated transversity
distribution,
is the planar unpolarized elementary cross section
(7)
and
(8)
The azimuthal dependence in
Eq. (4) arises from the combination of the phase factors in the
transversity distribution function, in the non-planar
elementary scattering amplitudes, and in the Collins fragmentation function;
and identify the directions of the proton spin
and of the quark intrinsic transverse momentum , see
Fig. 1; is the azimuthal angle of
the final hadron , as defined in the fragmenting
quark helicity frame. Neglecting terms, one finds
(9)
A full study of Eq. (2), taking into account intrinsic
motions with all contributions at all orders, following the general approach
of Ref. Anselmino:2005sh , will be presented in a forthcoming paper
sidis-general . Here, in agreement with all papers on the Collins
effect in SIDIS so far appeared in the literature, we work at
and use Eqs. (4) and (9).
is the unpolarized transverse momentum dependent (TMD)
distribution function of a quark inside the parent proton , while
is the unpolarized TMD
fragmentation function of quark into the final hadron .
We assume the and dependences of these functions to
be factorized in a Gaussian form, suitable to describe non-perturbative
effects at small values and simple enough to allow analytical
integration over the intrinsic transverse momenta:
(10)
(11)
where and are the usual integrated parton
distribution and fragmentation functions, available in the literature; in
particular we refer to Refs. Gluck:1998xa ; Gluck:2000dy
and Kretzer:2000yf . The QCD induced dependence of these functions
is also taken into account, although we do not indicate it explicitly.
Finally, the average values of and are taken from
Ref. Anselmino:2005nn , where they were obtained by fitting the
azimuthal dependence of SIDIS unpolarized cross section:
(12)
Notice that such values are assumed to be constant and flavor independent.
The transversity distributions and the Collins functions are unknown.
We choose the following simple parameterization
(13)
(14)
with
(15)
(16)
(17)
and . In general ,
but from our fits we learn that present experimental data are insensitive to
such a difference, therefore we simply assume . Also, in this
first simultaneous extraction of the transversity and Collins functions, we
let the coefficients and to be flavor dependent
(, while all the exponents and the
dimensional parameter are taken to be flavor independent.
Notice that our parameterizations are devised in such a way that the
transversity distribution function automatically obeys the Soffer
bound Soffer:1994ww
(18)
and the Collins function satisfies the positivity bound
(19)
since , and are normalized to
be smaller than in size for any value of , and respectively.
Eq. (20) expresses in
terms of the parameters
and . In Section IV we shall fix them by performing a best fit of the
measurements of HERMES, COMPASS and Belle Collaborations. Actually, we shall
consider, following the experimental data,
as a function of one variable at a time, by properly integrating the numerator
and denominator of Eq. (20): the integration over and
gives the distribution of ,
whereas the integrations over and or and , yield the
and distributions.
Notice that, with our approximations, and .
III Collins functions from processes
The kinematics corresponding to the process is
schematically represented in Fig. 2: the two detected
hadrons and are the fragmentation products of a quark
and an antiquark originating from collisions. We choose
the reference frame so that the scattering
occurs in the plane, with the back-to-back quark and antiquark
moving along the -axis. This choice requires, experimentally,
the reconstruction of the jet thrust axis, but it involves a very simple
kinematics and a direct contribution of the Collins functions, as we shall
see. A different choice, originally suggested in the literature
Boer:1997mf , is discussed at the end of this Section. In the
configuration of Fig. 2, the four-momenta of the
and of the are
(22)
The final hadrons and carry lightcone momentum fractions
and and have intrinsic transverse momenta
and with respect to the direction of fragmenting quarks,
(23)
so that their four-momenta can be expressed as
(24)
(25)
At large c.m. energies and not too small values of , one can neglect
second order corrections in the expansion, to work with the
much simpler kinematics:
(26)
(27)
Notice also that in this limit the lightcone momentum fractions coincide
with the observable energy fractions ,
(28)
Figure 2: Three dimensional kinematics of the
process, in the c.m. frame. In this configuration the
reconstructed thrust axis identifies the -direction, the
lepton-quark scattering plane defines the plane.
The cross section corresponding to this process, with unpolarized leptons,
can be written as
(29)
where
are the helicity amplitudes
corresponding to the elementary scattering
,
(neglecting heavy flavors) and
indicates a sum over all helicity indices.
In this case there are only two non-zero, independent amplitudes:
(30)
The functions
and
are the
probability densities which describe the fragmentation of
quarks and antiquarks into the physical hadrons and respectively
(see Section II.C of Ref. Anselmino:2005sh for detailed explanations).
In particular, the diagonal elements and
correspond to the transverse momentum dependent
unpolarized fragmentation function ,
(31)
whereas the non-diagonal elements
(32)
are related to the Collins fragmentation function
Anselmino:2005nn by
(33)
The angle in Eq. (III) is the azimuthal
angle identifying the direction of the
observed hadron in the helicity frame of the fragmenting quark .
Similar relations hold for the antiquark fragmentation functions, where one
has to take into account a sign difference in originating from the
fact that
the antiquark is chosen to move along the direction.
Finally, inserting Eqs. (30)–(33) into
Eq. (29) and performing the sum over the quark helicities
one obtains
(34)
Eq. (34) shows that the study of the correlated production of two
hadrons (one for each jet) in unpolarized collisions offers a direct
access to the Collins functions, both regarding their and
dependences. So far, only data on the dependence are available.
Notice that by integrating over the intrinsic transverse momenta
and one recovers the usual unpolarized cross section,
having used
(36)
To construct the physical observable measured by the Belle
Collaboration, we now perform a change of angular variables from
to
and then integrate over the moduli of the intrinsic transverse momenta,
and , and over the azimuthal angle . This leads to
(37)
where we have defined
(38)
By normalizing Eq. (37) to the azimuthal averaged
cross section,
(39)
one has
(40)
Actually, Belle data are collected over a range of values, according
to the acceptance of the detector (see Eq. (63)). Thus,
Eqs. (37) and (39) are integrated over the covered
range resulting in some specific and
values.
Finally, to eliminate false asymmetries, the Belle Collaboration considers
the ratio of unlike-sign to like-sign pion pair production, and ,
given by
(41)
with
(42)
(43)
(44)
For fitting purposes, it is convenient to re-express and in terms
of favoured and unfavoured fragmentation functions,
(45)
(46)
and similarly for the , obtaining
(47)
(48)
having neglected heavy quark contributions. and are the same as
in Ref. Efremov:2006qm , remembering Eq. (6) and noticing
that
In addition, the Belle Collaboration presents a second set of data, analysed
in a different reference frame: following Ref. Boer:1997mf , one can
fix the -axis as given by the direction of the observed hadron
and the plane as determined by the lepton and the directions.
There will then be another relevant plane, determined by and the
direction of the other observed hadron , at an angle with
respect to the plane. This kinematical configuration is shown in
Fig. 3; it has the advantage that it does not require
the reconstruction of the quark direction.
However, in this case the kinematics is more complicated. At first order in
one has
(50)
(51)
(52)
(53)
(54)
Moreover, the elementary process does not occur in
general in the plane, and thus the helicity scattering amplitudes
involve an azimuthal phase .
One can still perform an exact calculation, using the general approach
discussed in Ref. Anselmino:2005sh . A detailed description will be
presented in a forthcoming paper sidis-general . We give here only the
results valid at .
The analogue of Eq. (34) now reads
where is the azimuthal angle of the detected hadron
around the direction of the parent fragmenting quark, . Technically,
is the azimuthal angle of in the helicity frame of
. It can be expressed in terms of the integration variables we are using,
and . At lowest order in we have
(56)
(57)
Integrating Eq. (III) over and , but not over ,
and normalizing to the azimuthal averaged unpolarized cross section
(39), we obtain the analogue of Eq. (40),
in agreement with Ref. Efremov:2006qm taking into account the different
notations, Eqs. (6) and (III).
Figure 3: Three dimensional kinematics of the
process. In this configuration the direction is identified by the
momentum of the final hadron , while is emitted at an azimuthal
angle with respect to the lepton- plane, defined as the
plane.
where and are the same as defined in Eqs. (47) and
(48).
IV Transversity and Collins functions from a global fit
We can now pursue our strategy of gathering simultaneous information
on the transversity distribution function and
the Collins fragmentation function . To such a
purpose we perform a global best fit analysis of experimental data involving
these functions, namely the data from the SIDIS measurements by
the HERMES Airapetian:2004tw ; HERMES:proceedings and COMPASS Ageev:2006da
Collaborations, and the data from unpolarized processes
by the Belle Collaboration Abe:2005zx .
Table 1: Best values of the free parameters for the and
transversity distribution functions and for the favored and unfavored
Collins
fragmentation functions, Eqs. (13)-(17), as obtained by
simultaneously fitting HERMES and COMPASS data on the
asymmetry and the Belle data on the
asymmetry, Eq. (44), proportional to .
Notice that
the errors generated by MINUIT are strongly correlated, and should not
be taken
at face value. The significant fluctuations in our results are shown by the
shaded areas in Figs. 4, 5 and
6,
as explained in the text.
The values of and
are fixed, according to Eq. (12).
FIT I ()
=
Transversity
=
=
distribution
=
=
function
=
0.25 GeV2
Collins
=
=
fragmentation
=
=
function
=
0.20 GeV2
=
GeV2
and are parameterized
as shown in Eqs. (13)–(17). Considering the
scarcity of data, in order to minimize the number of parameters, we
assume flavor independent values of and and, similarly,
we assume that and are the same for favored and
unfavored Collins fragmentation functions, Eqs. (45) and
(46); we then remain with a total number of 9 parameters. Their
values, as determined through our global best fit are shown in Table
1 and 2, together with the errors estimated by
MINUIT.
As the two different sets of Belle data are based on a different
analysis of the same experimental events, they are strongly correlated.
Therefore, we have treated them separately in our combined analysis of
the HERMES, COMPASS and Belle data; the best fit values of Table
1 are obtained by fitting the SIDIS results together with
the Belle data on the dependence,
Eq. (41), while the values in Table 2 originate from
the Belle data on the dependence, Eq. (59).
We notice that the two sets of resulting best fit parameters are in full
agreement within the uncertainties; this gives a good check of the
consistency of the measurements and the stability of our analysis. In
the sequel we shall present results and predictions based on the
values of Table 1; the corresponding results based on the
values of Table 2 are hardly distinguishable (examples of this
are shown explicitely in Fig. 6 and in Fig. 8,
right panel).
Our best fits of the experimental data from HERMES, COMPASS and Belle
are shown in Figs. 4, 5 and
6 respectively. The central curves correspond to the central
values of the parameters in Table 1, while the shaded areas
correspond to one-sigma deviation at 90% CL and are calculated using the
errors and the parameter correlation matrix generated by MINUIT, minimizing
and maximizing the function under consideration, in a 9-dimensional
parameter space hyper-volume corresponding to one-sigma deviation.
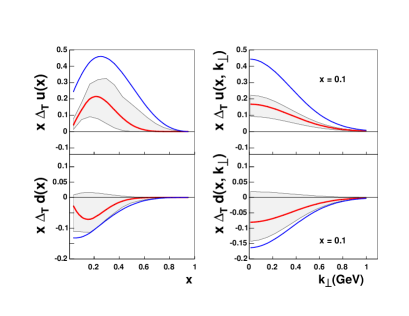
The transversity distribution functions and
as resulting from our best fit –
Eqs. (13)–(17) and Table 1 – are plotted
as a function of and in Fig. 7; for comparison,
the Soffer bound of Eq. (18) is also shown, as a bold line.
The solid central line corresponds to the central values in
Table 1 and the shaded area corresponds to the uncertainty in
the parameter values, as explained above.
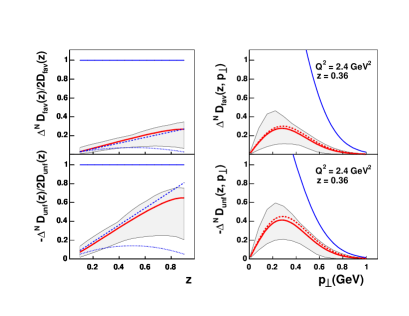
Similarly, the resulting Collins functions
and are plotted as a function of –
integrated over , Eq. (III), and
normalized to twice the unpolarized fragmentation functions –
and as a function of in Fig. 8; for comparison, we also
show the Collins functions from Refs. Efremov:2006qm and
Vogelsang:2005cs , respectively as dashed and dotted lines
(left panels),
and the corresponding positivity bound (19).
The dashed lines in the right panels show the results
corresponding to the parameters of Table 2.
Table 2: Best values of the free parameters for the and
transversity distribution functions and for the favored and unfavored
Collins fragmentation functions, Eqs. (13)-(17),
as obtained by simultaneously fitting HERMES and COMPASS data on the
asymmetry and the Belle data on the
asymmetry, Eq. (60), proportional to .
Notice that
the errors generated by MINUIT are strongly correlated, and should not
be taken
at face value. The significant fluctuations in our results are shown by the
shaded areas in Figs. 4, 5 and
6,
as explained in the text.
The values of and
are fixed, according to Eq. (12).
FIT II ()
=
Transversity
=
=
distribution
=
=
function
=
0.25 GeV2
Collins
=
=
fragmentation
=
=
function
=
0.20 GeV2
=
GeV2
A few comments are in order.
•
In Fig. 7 we show the extracted transversity distribution
for and quarks. The dependence is based on the simple
parameterization assumed in Eqs. (13) and (15),
which contain and as free parameters; our result
represents the first extraction ever of the transversity distributions
and .
•
The dependence has been assumed to be the same as for the unpolarized
distributions. The flavor dependence is contained in the coefficients
and in the proportionality of to
, the number density of quarks with
positive helicity inside a positive helicity proton.
•
Our results show that the transversity distribution is positive for quarks
and negative for quarks; the magnitude of is larger than that
of , while they are both significantly smaller than the
corresponding Soffer bound.
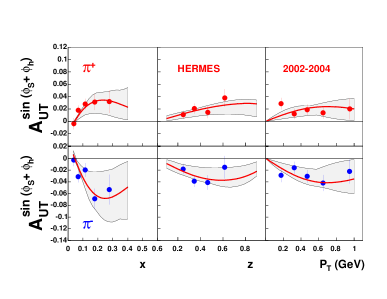
Figure 4:
HERMES experimental data Airapetian:2004tw ; HERMES:proceedings on the
azimuthal
asymmetry for production
are compared to the curves obtained from Eq. (20) with
the parameterizations of Eqs. (13)-(17), and the
parameter values, determined through our global best fit, given in
Table 1. The shaded area corresponds to the theoretical
uncertainty on the parameters, as explained in the text.
•
The shaded regions in Fig. 7 show that both and are, considering the limited amount of
data, already well determined. It is worth noticing that while
the HERMES data alone tightly constrain the transversity distribution of
quarks, the addition of COMPASS data to the fit allows to better
constrain the transversity distribution function of quarks.
We have checked that fitting only HERMES and Belle data, ignoring the
COMPASS results, still leads to a similar good ; the
resulting functions would give a slightly worse description – when
compared to the global fit – of the dependence of
, as measured by COMPASS. This is
mainly related to a less stringent determination of
in absence of deuteron target data. Although their measured azimuthal
asymmetry is very small, the inclusion of COMPASS data significantly
contributes to the extraction of the transversity distributions.
Different fitting procedures were earlier attempted, for
example by fixing or
Prokudin:2006fa : they lead to a slightly worse description of Belle
data.
•
The extracted Collins functions are shown in Fig. 8; they agree
with similar extractions previously obtained in the literature
Efremov:2006qm ; Vogelsang:2005cs . The shaded areas indicate well
constrained Collins functions for and quarks in the large (valence)
region, much smaller than their corresponding positivity bound.
•
We note once more that, in analyzing SIDIS data, we have neglected the
contributions of the sea quarks and antiquarks (assuming the corresponding
transversity distributions in a proton to vanish), taking into account only
and flavors. In analyzing Belle data and introducing the favored and
unfavored Collins fragmentation functions, we have considered the contributions
of and quarks, all abundantly produced in the annihilation
at 10 GeV.
•
The partonic distribution and fragmentation functions are taken from
Refs. Gluck:1998xa ; Gluck:2000dy and Kretzer:2000yf .
The QCD evolution is taken into account in the unpolarized distributions,
in the unpolarized fragmentation functions and, following
Ref. Martin:1997rz , for the transversity distributions.
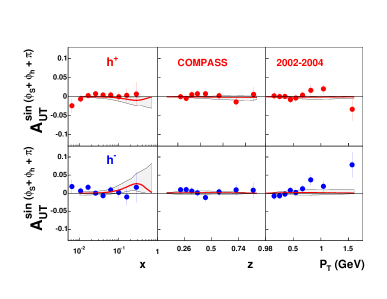
Figure 5:
The measurements of , for the production of
positively and negatively charged hadrons, from the COMPASS experiment
operating on a deuterium target Ageev:2006da are compared to the
curves obtained from Eq. (20) with the parameterizations
of Eqs. (13)-(17), and the parameter values,
determined through our global best fit, given in Table 1.
The shaded area corresponds to the theoretical uncertainty on the parameters,
as explained in the text. Notice the extra phase in addition to
in the figure label, to keep into account the different
choice of the Collins angle, with respect to Trento Bacchetta:2004jz
and HERMES conventions, adopted by COMPASS Collaboration.
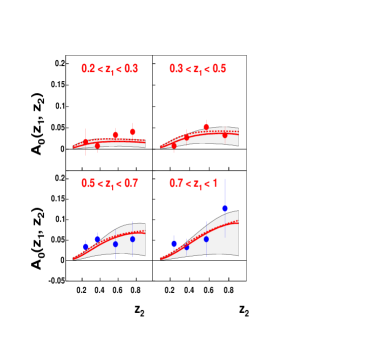
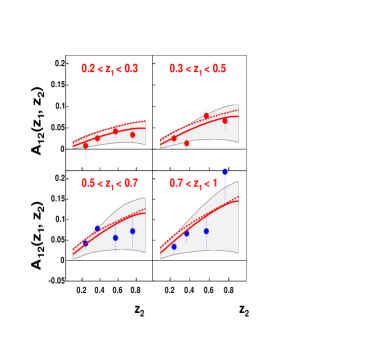
Figure 6:
The experimental data on two different azimuthal correlations in unpolarized
processes, as measured by Belle Collaboration
Abe:2005zx , are compared to the curves obtained from Eqs. (44)
[] and (60) [] with the parameterizations of
Eqs. (14),
(16) and (17).
The solid lines correspond to the parameters given in
Table 1, obtained by fitting the asymmetry;
the shaded area corresponds to the theoretical uncertainty on these
parameters, as explained in the text.
The dashed lines correspond to the parameters given in Table 2
obtained by fitting the asymmetry. The agreement between the results
obtained from the two fits shows the consistency between the two sets of Belle
data and the solidity of our analysis. Figure 7:
The transversity distribution functions for and quarks as determined
through our global best fit. In the left panel, (upper
plot) and (lower plot), see Eq. (5), are shown as
functions of and GeV2. The Soffer bound
Soffer:1994ww is also shown for comparison (bold blue line).
In the right panel we present the unintegrated transversity
distributions, (upper plot) and
(lower plot), as defined in Eq. (13), as functions of at a
fixed value of . Notice that this dependence is not obtained from the
fit, but it has been chosen to be the same as that of the unpolarized
distribution functions: we plot it in order to show its uncertainty (shaded
area), due to the uncertainty in the determination of the free parameters.
Figure 8:
Favored and unfavored Collins fragmentation functions as determined through
our global best fit. In the left panel we show the dependence of the
integrated Collins functions defined in Eq. (38) and
normalized to twice the corresponding unpolarized fragmentation functions;
we compare them to the results of Refs. Efremov:2006qm (dashed line)
and Vogelsang:2005cs (dotted line). In the right panel we show the
dependence of the Collins functions defined in Eq. (14),
at a fixed value of . The value is 2.4 GeV2, having assumed
that the evolution of is the same as that of .
The solid lines show the results based on the
parameters of Table 1, while the dashed ones show the results
corresponding to the parameters of Table 2. In all cases we also
show the positivity bound (19) (upper lines).
Finally, we explicitly list, for clarity and completeness, the kinematical
cuts we have imposed in numerical integrations, according to the setup
of the HERMES experiment:
(61)
the COMPASS experiment:
(62)
and the Belle experiment
(63)
where is the polar production angle in the laboratory
frame (related to the scattering angles and used in this
paper) and is the transverse momentum of the virtual photon from the
annihilation in the rest frame of the hadron pair Boer:1997mf .
V Predictions for ongoing and future experiments
We can now use the transversity distributions and the Collins functions
we have obtained from fitting the available HERMES, COMPASS and Belle
data, see Table 1,
to give predictions for new measurements planned by COMPASS and JLab
Collaborations.
The transverse single spin asymmetry
will be measured by the COMPASS experiment operating with a polarized hydrogen
target (rather than a deuterium one). In Fig. 9
we show our predictions, obtained by adopting the same experimental cuts
which were used for the deuterium target, see Eq. (62).
Notice that this asymmetry is found to be sizeable, up to 5% in size.
Figure 9:
Predictions for the single spin asymmetry
as it will be measured by the COMPASS experiment operating with a
transversely polarized hydrogen target. For the extra phase in the
figure label see the caption of Fig. 5.
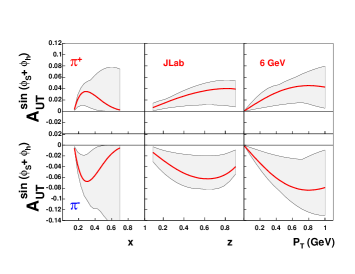
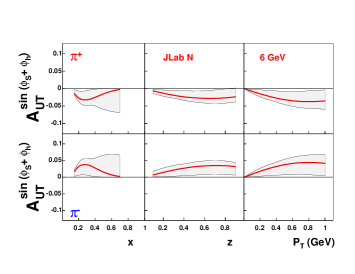
Figure 10:
Predictions for the single spin asymmetry as
it will be measured at JLab operating on polarized hydrogen (proton, upper
plot) and He3 (neutron, lower plot) targets at a beam energy of GeV.
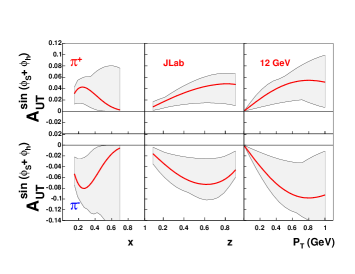
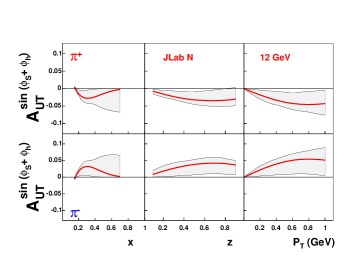
Figure 11:
Predictions for the single spin asymmetry as
it will be measured at JLab operating on polarized hydrogen (proton, upper
plot) and He3 (neutron, lower plot) targets at a beam energy of GeV.
The JLab experiments will measure for pion
production off transversely polarized proton and neutron targets, at incident
beam energies of either or GeV. The kinematical region spanned by
these experiments is very interesting, as it will enable to explore
the behavior of the transversity distribution function at large values of ,
up to . The adopted experimental cuts for JLab operating on a
proton target at GeV are the following
,
,
,
,
,
,
(64)
whereas for a beam energy of GeV they are
,
,
,
,
,
,
(65)
For a neutron target at GeV the cuts read:
,
,
,
,
,
(66)
whereas for an incident beam energy of GeV they are:
,
,
,
,
(67)
Our corresponding predictions, according to Eq. (20)
and our extracted transversity and Collins functions, are shown in
Figs. 10 and 11.
It is important to stress that, as the large region is not covered by the
HERMES and COMPASS experiments, our predictions for the dependence of
are very sensitive to the few available
data points from HERMES and COMPASS at moderately large values.
As a consequence, the predictions for the JLab experiments may vary
drastically in the region , as indicated by the large
shaded area in Figs. 10 and 11.
On the contrary, the results on the and dependences are
more stable, as they only depend on the transversity distribution
function integrated over .
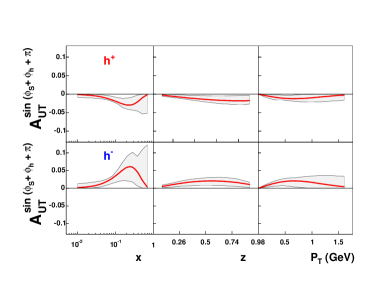
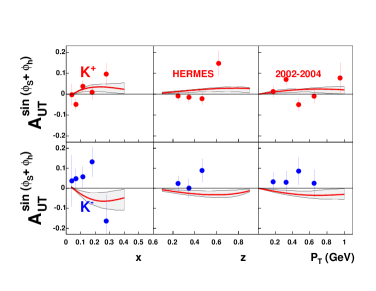
Finally, we compute the azimuthal asymmetry
for the production of mesons and compare it with existing HERMES
results Airapetian:2004tw ; HERMES:proceedings . These data have not been included in our
best fit, as they might involve the transversity distribution of strange
quarks in the nucleon, which we have neglected for SIDIS data on
production. We show our results in Fig. 12, obtained using
the extracted and transversity distributions. Again, we have used
favored () and unfavored
() Collins functions, as in
Eqs. (14), (16) and (17). For these we have
used the same parameters and of
Table 1, with the appropriate unpolarized fragmentation functions
Kretzer:2000yf .
We notice that our computations are in fair agreement with data concerning the
production, which is presumably dominated by quarks; instead, there
seem to be discrepancies for the asymmetry, for which the role of
quarks might be relevant. New data on the azimuthal asymmetry
for production, possible from COMPASS and JLab experiments, might be
very helpful in sorting out the eventual importance of the sea quark
transversity distributions in a nucleon.
Figure 12:
Our results, based on the extracted transversity and Collins functions,
for the azimuthal asymmetry for
production, compared with the HERMES experimental data
Airapetian:2004tw ; HERMES:proceedings .
VI Comments and Conclusions
We have performed a combined analysis of all experimental data on spin
azimuthal asymmetries which involve the transversity distributions of
and quarks and the Collins fragmentation functions, classified
as favored (when the fragmenting quark is a valence quark for the final
hadron) and unfavored (when the fragmenting quark is not a valence quark
for the final hadron). We have fixed the total number of 9 parameters
by best fitting the HERMES, COMPASS and Belle data.
All data can be accurately described, leading to the extraction of the
favored and unfavored Collins functions, in agreement with similar results
previously obtained in the literature Vogelsang:2005cs ; Efremov:2006qm .
In addition, we have obtained, for the first time, an extraction
of the so far unknown transversity distributions for and quarks,
and . They turn out to be opposite in sign, with
smaller than , and both smaller than their
Soffer bound Soffer:1994ww .
The knowledge of the transversity distributions and the Collins
fragmentation functions allows to compute the azimuthal asymmetry
for any SIDIS process; we have then
presented several predictions for incoming measurements from COMPASS and
JLab experiments. They will provide further important tests of our complete
understanding of the partonic properties which are at the origin of SSA.
Data on production will help in disentangling the role of sea quarks.
Further expected data from Belle will allow to study in detail not only
the dependence of the Collins functions, but also their dependence.
The combination of data from SIDIS and processes
opens the way to a new phenomenological approach to the study of the nucleon
structure and of fundamental QCD properties, to be further pursued.
Acknowledgements.
We are grateful to Werner Vogelsang for supplying us with the numerical
program for the QCD evolution of the transversity distributions.
We acknowledge the support of the European Community - Research Infrastructure
Activity under the FP6 “Structuring the European Research Area”
program (HadronPhysics, contract number RII3-CT-2004-506078).
References
(1)
V. Barone, A. Drago, and P. G. Ratcliffe,
Phys. Rept. 359, 1 (2002).
(2)
PAX Collaboration, V. Barone et al.,
(2005), hep-ex/0505054.
(3)
M. Anselmino, V. Barone, A. Drago, and N. N. Nikolaev,
Phys. Lett. B594, 97 (2004).
(4)
A. V. Efremov, K. Goeke, and P. Schweitzer,
Eur. Phys. J. C35, 207 (2004).
(5)
B. Pasquini, M. Pincetti, and S. Boffi,
(2006), hep-ph/0612094.
(6)
J. C. Collins,
Nucl. Phys. B396, 161 (1993).
(7)
Belle Collaboration, R. Seidl et al.,
Phys. Rev. Lett. 96, 232002 (2006).
(8)
HERMES Collaboration, A. Airapetian et al.,
Phys. Rev. Lett. 94, 012002 (2005).
(9)
HERMES Collaboration, L. Pappalardo et al.,
in the proceedings of the XIV International Workshop on Deep
Inelastic Scattering, Tsukuba city, Japan, April 20th - April 24th. (2006).
(10)
COMPASS Collaboration, E. S. Ageev et al.,
Nucl. Phys. B765, 31 (2007).
(11)
M. Anselmino, M. Boglione, U. D’Alesio, A. Kotzinian, F. Murgia, A. Prokudin,
Phys. Rev. D71, 074006 (2005).
(12)
X.-d. Ji, J.-P. Ma, and F. Yuan,
Phys. Lett. B597, 299 (2004).
(13)
X.-d. Ji, J.-p. Ma, and F. Yuan,
Phys. Rev. D71, 034005 (2005).
(14)
A. Bacchetta, U. D’Alesio, M. Diehl, and C. A. Miller,
Phys. Rev. D70, 117504 (2004).
(15)
M. Anselmino, M. Boglione, U. D’Alesio, F. Murgia, and A. Prokudin,
in preparation (2007).
(16)
M. Anselmino, M. Boglione, U. D’Alesio, E. Leader, S. Melis, F. Murgia,
Phys. Rev. D73, 014020 (2006).
(17)
M. Gluck, E. Reya, and A. Vogt,
Eur. Phys. J. C5, 461 (1998).
(18)
M. Gluck, E. Reya, M. Stratmann, and W. Vogelsang,
Phys. Rev. D63, 094005 (2001).
(19)
S. Kretzer,
Phys. Rev. D62, 054001 (2000).
(20)
J. Soffer,
Phys. Rev. Lett. 74, 1292 (1995).
(21)
A. Kotzinian,
Nucl. Phys. B441, 234 (1995).
(22)
P. J. Mulders and R. D. Tangerman,
Nucl. Phys. B461, 197 (1996).
(23)
D. Boer, R. Jakob, and P. J. Mulders,
Nucl. Phys. B504, 345 (1997).
(24)
A. V. Efremov, K. Goeke, and P. Schweitzer,
Phys. Rev. D73, 094025 (2006).
(25)
W. Vogelsang and F. Yuan,
Phys. Rev. D72, 054028 (2005).
(26)
A. Prokudin and C. Türk,
(2006), hep-ph/0612087.
(27)
O. Martin, A. Schäfer, M. Stratmann, and W. Vogelsang,
Phys. Rev. D57, 3084 (1998).