Experimental Indication of Existence of
Extra Light-Vector Mesons and
Abstract
Mass distributions of and systems in the annihilation obtained by the several experiments are analyzed. We obtain indication of light-vector mesons and in the lower mass region. Those states are expected to exist in the -classification scheme.
1 Introduction
Recently the level-classification scheme of hadrons[1] has been proposed, which is a covariant generalization of non-relativistic scheme based on . In the -classification scheme a new type of relativistic states, called chiral states, which have no correspondents in the non-relativistic scheme, are expected to exist in lower mass region for light quark systems. Especially the extra vector meson nonet is predicted in the ground S-wave state of () system.
2 Analysis of the mass spectrum of and indication of extra vector meson
In this work we are going to reanalyze the combined mass spectrum of the data in the annihilation obtained by SND[4] and by BABAR[5]. The former presents higher statistics data at the lower mass region and the latter covers the whole mass region interested as shown in Fig. 1. The DM2 data[10] which were included in our previous analysis[11] are not used in the present analysis since they seem to show different behaviors from those of BABAR depending on a bias factor for cross sections.
The relevant process is, applying the vector meson dominance model (VMD), considered to occur dominantly through intermediate production of vector mesons “V” as that . The analysis results obtained by SND and by BABAR show vectors, and , but no . The width parameter for is obtained to be rather wider in each analysis, as shown in Table I. There recognized, however, a huge event accumulation exists around 1.3 GeV in the mass spectrum. It may be naturally interpreted to correspond to the , which was pointed out in ref. \citenSND:omega, rather than .
In order to make clear the situation on the existence of , a possible contribution of a low mass state is considered explicitly in the present work in addition to the higher vector mesons, and .

2.1 Method of analysis
First we give general effective Lagrangians, which concern on our relevant processes given in Fig. 2, as
| (1) |
where being coupling constant of decay interaction for . The cross section for relevant process is given as
where and denote a low mass and two higher mass vector states above 1 GeV.
In Eq. (2.2) we have introduced the form factor given as
| (3) |
and ’s are the fitting parameters, while the values of and has been estimated from the relevant low mass data.
| (4) | |||||
where ’s are invariant mass of three possible contribution of and . is angle between and in at rest. and is 3-momentum of at C.M.S. and of at C.M.S., respectively. The value of common factor of the cross section, , is irrelevant to our analysis.
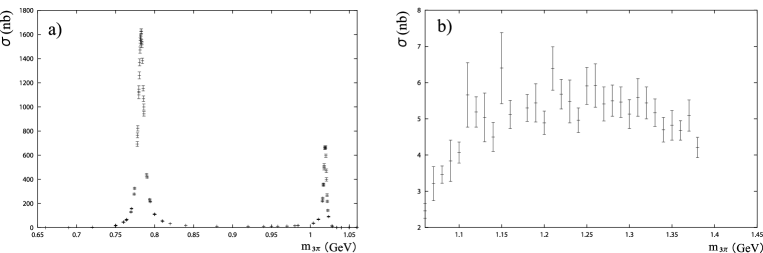
There are two contrastive structures in mass spectrum of below 2 GeV. One is below 1 GeV region and the other is above 1 GeV region.
The former region has two clear and huge peaks coming from contributions from and as shown in Fig. 3a), while the latter shows some complex structures (which are relevant to the present work) as shown in Fig. 1 and Fig. 3b).
Before mass spectrum of in the energy region from 1.06 to 2.0 GeV by BABAR and by SND are analyzed, the parameters and of and in Eq. (2.2) are fixed by the analysis of the spectrum below 1 GeV. Then these values111 , . of parameter and are applied in the analysis of the data above 1 GeV.
2.2 Results of analysis
The mass spectrum of in the energy region from 1.06 to 2.0 GeV are used in the analyses of the following three cases.
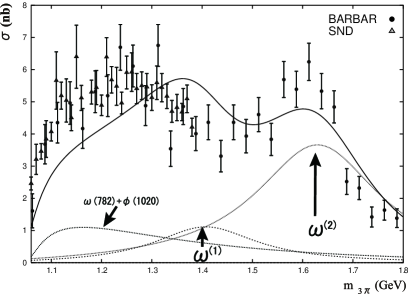
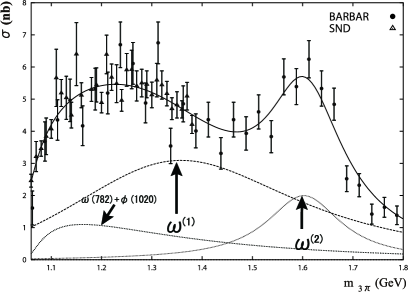
In the fitting of the first case, two resonances are considered above 1 GeV region. The values of mass and width of and , corresponding to and , are restricted to be consistent with PDG tables[12]. In this case, the experimental data are not well reproduced, especially below 1.5 GeV region.
In the second case, two resonances are considered above 1 GeV region. The values of mass and width of , corresponding to , are restricted to be consistent with PDG tables[12], while the parameters of are not restricted. In this case, the experimental data are well reproduced, although obtained values of mass and width of are lower and wider, respectively, compared with of PDG values.
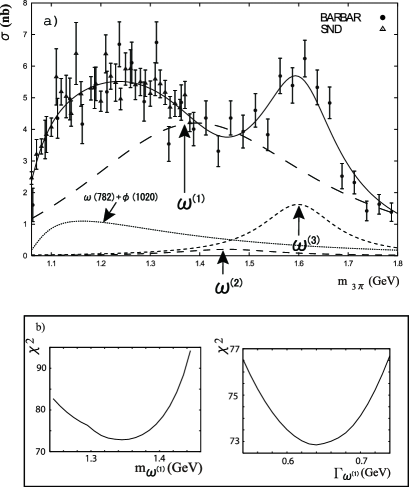
In the third case, three resonances are considered above 1 GeV region. The values of mass and width of and , corresponding to and , are restricted to be consistent with PDG tables[12], while the parameters of , supposed to be corresponding to the extra , are not restricted. In this case, the experimental data are well reproduced. The contributions of and are large, while the contribution of is very small.
All the results of three cases are shown in Fig. 4, Fig. 5, and Fig. 6a). In addition mass and width scan on for the third case are shown in Fig. 6b). The obtained values of parameters and in the three cases are listed in Table II.
The almost same values of are obtained in the second and the third case. This reflect that the contribution of in the third case is very small, and implies that a dominant contribution of in this case is replaced by that of in the second case.
The result of fitting of the third case is improved by about compared with the first case, indicating the existence of the low mass extra vector meson in addition to the two higher states and .
It is noted that the obtained values of in the second and third case are slightly larger than the center of accumulation, around 1.25 GeV, in mass spectrum as shown in Fig. 1 and Fig. 3b). It is due to interference effect among , , and .
| Two resonance analysis | ||||
|---|---|---|---|---|
| Case 1 | ||||
| 280 † | ||||
| A | ||||
| Case 2 | ||||
| 1303 | 1601 | |||
| 180‡ | ||||
| A | ||||
| Three resonance analysis | ||||
| Case 3 | ||||
| 1346 | 1450† | 1597 | ||
| A | ||||
| † Bound for upper limit which is set to be consistent with PDG tables. | ||||
| ‡ Bound for lower limit which is set to be consistent with PDG tables. | ||||
3 Analysis of the mass spectrum of and indication of extra vector meson
In this work we are also going to reanalyze the combined mass spectrum of data in annihilation obtained by CMD-2[6], by SND[7] and by DM2[8]. The CLEO data[13] which were included in our previous analysis[11] are not used in the present analysis to make the situation simple for analysis since the CLEO data were obtained from which is the different process from .
The process is also, applying the VMD, considered to occur dominantly through intermediate production of vector mesons “V” as that . The analysis results obtained by CMD-2 show vectors, and , while mass and width values of the are scattered in each study[12]. There recognized, however, a huge event accumulation exists around 1.3 GeV in the mass spectrum. It may be naturally interpreted to correspond to the with mass around 1.3 GeV which has lower mass than . Actually the existence of was pointed out by several experimental group[14, 15] and in review articles[12, 3].
In order to make clear the situation on the existence of extra light-vector meson, a possible contribution of is considered explicitly in the present work in addition to the higher vector mesons, and .
3.1 Method of analysis
Effective Lagrangians, which concern on our relevant processes given in Fig. 7, are given as
| (5) | |||||
where being coupling constant of decay interaction for .
and denote a low mass and two higher mass
vector states.
The cross section is given as
| (6) |
where
| (7) |
is three momentum of in at rest. is branching ratio of to be . Coupling constants are estimated by VMD using experimental values to be and . ’s are the fitting parameters.

3.2 Results of analysis
The mass spectrum of below 2.2 GeV are used in the analyses of following three cases in parallel with the analyses on .
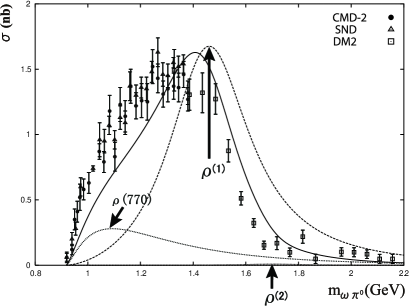
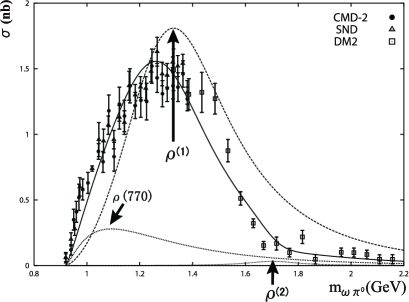
In the fitting of the first case, two resonances are considered above 1 GeV region. The values of mass and width of and , corresponding to and , are restricted to be consistent with PDG tables[12]. In this case, the experimental data are not well reproduced, especially below 1.4 GeV region.
In the second case, two resonances are considered above 1 GeV region. The values of mass and width of , corresponding to , are restricted to be consistent with PDG tables[12], while the parameters of are not restricted. In this case, the experimental data are well reproduced, although obtained values of mass and width of are lower and wider, respectively, compared withthose of of PDG values.
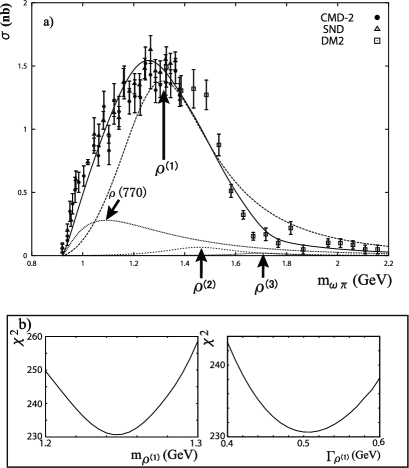
In the third case, three resonances are considered above 1 GeV region. The values of mass and width of and , corresponding to and , are restricted to be consistent with PDG tables[12], respectively, while the parameters of , supposed to be corresponding to the extra , are not restricted. In this case, the experimental data are well reproduced. The contribution from is large, while those of and are very small comparing to that of .
All the results of three cases are shown in Fig. 8, Fig. 9, and Fig. 10a). In addition mass and width scan on for the third case are shown in Fig. 10b). The obtained values of parameters and in the three cases are listed in Table III. The result of fitting of the third case is improved by about compared with the first case, indicating the existence of the low mass extra vector meson in addition to two higher state and .
It may be noted that the CMD-2 data and SND data cover below 1.4 GeV of mass spectrum, while the DM2 data covers above 1.4 GeV. The combined data of two regions below and above 1.4 GeV are used222 A bias factor 1.18 is applied on DM2 data by CMD-2. in the present analysis. That the DM2 data show their cross section values rather suppressed would result less contribution of than those of or .
| Two resonance analysis | ||||
|---|---|---|---|---|
| Case 1 | ||||
| 1440‡ | 1700 | |||
| 240 | ||||
| A | ||||
| Case 2 | ||||
| 240 | ||||
| A | ||||
| Three resonance analysis | ||||
| Case 3 | ||||
| 1440‡ | 1700 | |||
| 340‡ | 240 | |||
| A | ||||
| † Bound for upper limit which is set to be consistent with PDG tables. | ||||
| ‡ Bound for lower limit which is set to be consistent with PDG tables. | ||||
4 Concluding remarks
Through the present analyses on the mass spectra of
and of
in annihilation
we have shown some
indication of low mass vector mesons and ,
respectively.
The obtained values of masses and widths are
The results are still preliminary,
as the used data are combined one coming from
different experiments performed in different mass
regions.
However, we expect that the main
feature on mass spectra may be
considered to be
maintained, independently of a bias factor.
Accordingly, we may conclude that the extra-vector mesons and are necessary to explain the mass spectra. In each result of the third case in Table II and Table III, the contributions of and are very small compared with those of and , respectively.
The present results seem to be consistent with the expectation of the -sheme. In this scheme and are assigned as S-wave chiral states[9] while and are assigned as P-wave states. Accordingly the contributions of and are expected to be very small compared with those of and , respectively, reflecting the strength at the origin of their wave functins, and .
Further studies are expected to confirm the existence of the low mass extra vector mesons and : It will be a very important problem for hadron spectroscopy.
Acknowledgements
We would like to express our sincere appreciation to Dr. M. Ishida who initiated this works and gave us helpful and crucial suggestions during the work. We deeply appreciate Prof. K. Yamada, Prof. K. Takamatsu, and Prof. I. Yamauchi who gave us useful and crucial discussions and information. We also thank Prof. S. Ishida, Prof. T. Tsuru, Dr. T. Maeda, and Prof. M. Oda for useful discussions. This work is supported by Nihon University Individual Research Grant for (2005).
References
- [1] S. Ishida, M. Ishida and T. Maeda, Prog. Theor. Phys. 104 (2000) 785; S. Ishida and M.Y. Ishida , Phys. Lett. B539 (2002) 249-256.
- [2] M.N. Achasov et al. (SND Collaboration) , Phys. Lett. B462 (1999) 365-370.
- [3] A. Donnachie and Yu.S. Karashnikova, Proc. 9th Hadron Conf. 2001, AIP Conf. Proc. 619 (2002) 5; A. Donnachie, Phys. Rept. 403-404 (2004) 281-301.
- [4] M.N. Achasov et al. (SND Collaboration), Phys. Rev. D68 (2003) 052006.
- [5] B. Aubert et al. (BABAR Collaboration), Phys. Rev. D70 (2004) 072004.
- [6] R. R. Akhmetshin et al. (CMD-2 Collaboration), Phys. Lett. B562 (2003) 173.
- [7] M.N. Achasov et al. (SND Collaboration), Phys. Lett. B486 (2000) 29.
- [8] Nuclear Physics B (Proc. Suppi.) 21 (1991) 111-117.
- [9] K. Yamada, in these proceedings.
- [10] A. Antonelli et al. (DM2 Collaboration), Z. Phys. C56 (1992) 15.
- [11] T. Komada, AIP Conf. Proc. 814 (2006) 458.
- [12] Particle Data Group, S. Eidelman et al., Phys. Lett. B592 (2004) 1.
- [13] K. W. Edwards et al. (CLEO Collaboration), Phys. Rev. D61 (2000) 072003.
- [14] D. Aston et al. (LASS Collaboration), SLAC-PUB-5606 (1994).
- [15] A. Bertin et al. (OBELIX Collaboration) Phys. Lett. B414 (1997) 220.