KEK–TH–1112
IPPP/06/72
DCPT/06/144
LTH 729
8th November 2006
Revised: 20th April 2007
Improved predictions for of the muon and
K. Hagiwaraa, A.D. Martinb, Daisuke Nomuraa and T. Teubnerc
a Theory Group, KEK, Tsukuba, Ibaraki 305-0801, Japan
b Department of Physics and Institute for Particle Physics Phenomenology,
University of Durham, Durham DH1 3LE, U.K.
c Department of Mathematical Sciences, University of Liverpool, Liverpool L69 3BX, U.K.
We update the Standard Model predictions of the anomalous magnetic moment of the muon, , and the value of the QED coupling at the -boson mass, incorporating the new data obtained by CMD-2 and KLOE, as well as the corrected SND data, and other improvements. The prediction for is about lower than before, and has a smaller uncertainty, which corresponds to a 3.4 deviation from the measured value. The prediction for the QED coupling is .
It is important to predict the anomalous magnetic moment of the muon, , and the value of the QED coupling on the pole as precisely as possible, in order to test the Standard Model and to probe New Physics. For the first quantity, we note that the Brookhaven experiment gives the average of the measurements of the and anomalous magnetic moments to be [2]
| (1) |
If a statistically significant deviation, no matter how tiny, can be definitively established between the measured value and the Standard Model prediction, then it will herald the existence of new physics beyond the Standard Model. In particular the comparison offers valuable constraints on possible contributions from SUSY particles, see, for example, the reviews in [3]. The second quantity, the QED coupling at the boson mass, , is equally important. The uncertainty in its value is one of the major limiting factors for precision electroweak physics. It limits, for example, the accuracy of the indirect estimate of the Higgs mass in the Standard Model.
The Standard Model (SM) prediction of the muon anomalous magnetic moment, , may be written as the sum of three terms,
| (2) |
The QED contribution, which includes all the photonic and leptonic loops, and the EW contribution, which includes the loops involving the or Higgs bosons, are known very accurately: [4] and [5]. The main uncertainty lies in the final term, which involves the hadronic loop contributions. This term may, itself, be sub-divided into three parts
| (3) |
At present the hadronic vacuum polarisation contributions, , cannot be calculated sufficiently accurately from first principles [6], but instead are evaluated using dispersion integrals over the measured cross sections for hadrons. For our 2003 predictions [7] we found
| (4) |
| (5) |
where the last error corresponds to the uncertainty associated with the radiative corrections to the cross section data. The final term in (3), , is the hadronic light-by-light contribution. In our previous analysis, we took, in units of , either111 The first is a representative value of several earlier determinations (see, for example, the review in [8]), whereas the second value (which was used in the note added in proof in [7]) was obtained in [9]. In this paper we take the second value; it is consistent with the upper bound found in [10], but see also ‘Note added in proof’.
| (6) |
The major uncertainty in the Standard Model prediction of the anomalous moment, , comes from the contribution of the channel. Indeed, the cross section data, available in 2003, give the dominant contribution to (4) of about . Since then the situation has improved considerably. In particular, new precise measurements have recently become available from the CMD-2 detector throughout the centre-of-mass energy range GeV [11, 12, 13]. Moreover, the KLOE collaboration have made measurements of the cross section by the radiative return method over the range GeV [14]. Finally measurements at the SND detector over the interval GeV have become available [15], and subsequently have been corrected [16]. Clearly all these data222 There is the possibility of obtaining indirect information on hadrons in the energy range , via the conserved vector current (CVC) hypothesis, using the precision data for the hadronic decays of leptons. However there is a sizeable discrepancy between the data from the experiments and that extracted from the decay mode of the . This suggests that the understanding of the CVC hypothesis may be inadequate at the desired level of precision, see e.g. the recent discussion in [17]. Also the fair agreement between the KLOE data and the CMD-2 and SND data strongly supports the data against the data [18]. In addition, spectral function data from Belle show a significant discrepancy compared to ALEPH and, to a lesser extent, CLEO, see [19]. We therefore do not include the data in the present (or in our previous [7]) analysis. will have an impact on the determination of of the muon.
Here we repeat the analysis described in detail in Ref. [7]. That is, we evaluate the dispersion relation
| (7) |
where the kernel is a known function (see, for example, eq. (45) of [7]), and
| (8) |
The subscript 0 on is to indicate that we take the bare cross section with no initial state radiative or vacuum polarization corrections, but with final state radiative corrections; and with .
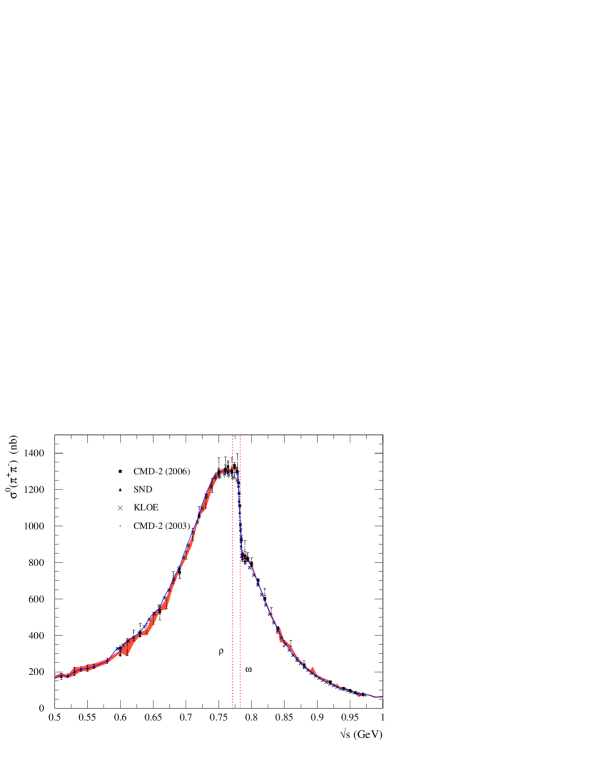
To begin, we repeat the analysis of [7] including all the new data, except those from KLOE. The latter data have a significantly different energy dependence, and we shall discuss their effect on the analysis later. We combine the ‘bare’ cross section data from the various experiments for a given channel in clusters of a given size , as described in [7]. For the crucial channel we show, in Fig. 1, how the contribution varies as a function of the cluster size . (For this channel, we have fixed the cluster size in the small energy interval from 0.778 to 0.787 GeV containing the interference effects, to be MeV, thus improving the quality and stability of the fit considerably.) The improvement due to the inclusion of the new data is immediately clear from Fig. 1. Choosing the cluster size to be 3.5 MeV, as in our previous analysis [7], we see that the contribution is reduced by , and that the uncertainty in the value decreases from to . Moreover the result is stable to the variation of the choice of the cluster size in the range from 3 to 10 MeV. Furthermore the minimum of the clustering fit to the data, divided by the number of degrees of freedom, , is, to a good approximation, equal to for all choices of in this interval.
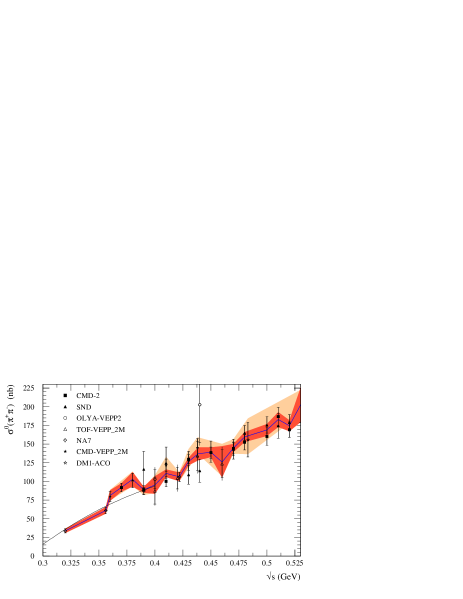
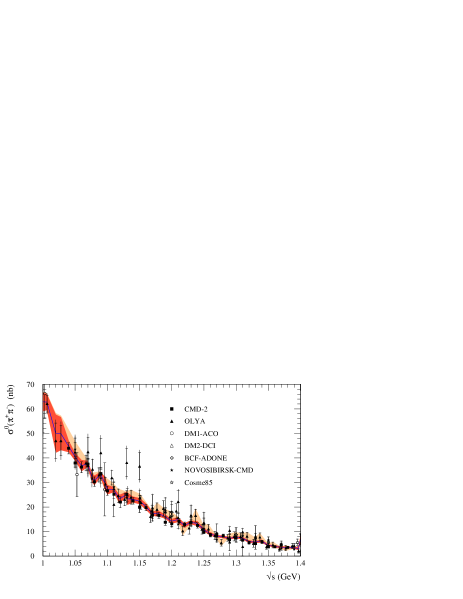
It is informative to trace the origin of the reduction of in due to the addition of the new data. It comes about equally from the intervals GeV and GeV, with only a small reduction in coming from the intervening energy range. This becomes clear from Fig. 2, where the data are displayed together with two fits for a cluster size MeV (recall from Fig. 1 the insensitivity of the integrated result to variation of in the range MeV), which correspond to our previous and the present analyses. A comparison of the two bands shows that the introduction of the CMD-2 (and SND) data gives, on average, a smaller cross section in the energy regions above 410 and above 1030 MeV in the upper and lower plots, respectively, of Fig. 2.
We now discuss the inclusion of the KLOE data in the analysis. Note that KLOE measures the hadronic cross section via the radiative return method in at the factory DANE in Frascati. Here the observation of initial state photon radiation at various energies allows for a determination of the invariant mass spectrum of the system. This analysis is completely independent of the ‘direct scan’ measurements of CMD-2 and SND at VEPP-2M in Novosibirsk which use a tunable beam energy. Unfortunately, the KLOE data [14] have a different energy dependence to the other data sets, especially when compared with the recent CMD-2 and SND analyses, see e.g. the discussions in [16, 20]. Our clustering prescription allows overlapping data sets to adjust by an overall constant within the systematic error of each set, but does not allow for an energy dependent renormalization333 We have also studied the effect of an energy dependent renormalization, using either a linear or a constant plus logarithmic form; neither of these forms were able to improve the fit with the KLOE data significantly.. If we would include the KLOE data in the fit, then they would be normalized upwards by nearly two percent.444This is because there are fewer data points in the low energy region lying high (compared to CMD-2) than lying low in the central peak and high energy tail region, and because KLOE’s quoted systematic error is about twice as large as CMD-2’s.
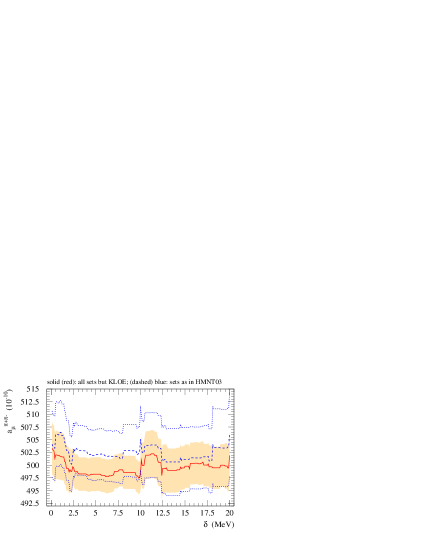
This in turn would lead to a sizeable effect in the fit, see Fig. 3: the (blue) line is the mean value of the fit including the KLOE data, whereas the (red) band is the error band for the fit excluding KLOE. In the dispersion integral this would lead to an artificial overall shift of upwards by about . As the , for the ‘clustering’ fit to the data, would increase significantly from the value 1.1 found above, the improvement of the error on after inflation by would be very small. However the KLOE data [14] more than adequately populate the energy interval of their measurement, GeV, so that we can compute reliably their integrated contribution to the dispersion relation of (7). We find
| (9) |
This should be compared to that obtained in the complete analysis (in which the KLOE data were omitted)
| (10) |
where, as is to be expected, the error is less. Moreover, despite their different energy dependence, the agreement of the KLOE integrated contribution with that of the fit of all other data is excellent. Therefore, for our SM prediction of , we combine both contributions for this energy interval. Doing so we arrive at
| (11) |
for the interval GeV. The effect of the KLOE data is to slightly increase the magnitude and reduce the error. As a result, the contribution in the interval GeV, becomes .
In addition to the inclusion of the new data, we have made other improvements in the analysis. One small improvement that we have made is to evaluate the vacuum polarisation corrections to the data using our recent determination [21] of the running of the effective coupling in the time-like region , which was obtained using our clustered data set. This is more consistent than using the evaluation by Jegerlehner [22] that we did previously. This is a correction to a correction, and so hardly changes the result.
A more important improvement is that for the subleading exclusive channels we have included new data from CMD-2 [23] (, , ), BaBar [24] (, , , , ); and from BES [25] for the inclusive hadronic cross section. The effects of the new data are summarized in Table 1. It lists the contributions to which have changed since our previous prediction. As expected, the main change arises from the inclusion of the new data: in units of . This is partially compensated by changes in other contributions, such as (due mainly to the new BES data) and (due to the new leptonic widths of and [26]). Including all the hadronic contributions we obtain
| (12) |
and, similarly for NLO,
| (13) |
| channel | range (GeV) | HMNT03 [7] | |
|---|---|---|---|
| inclusive | |||
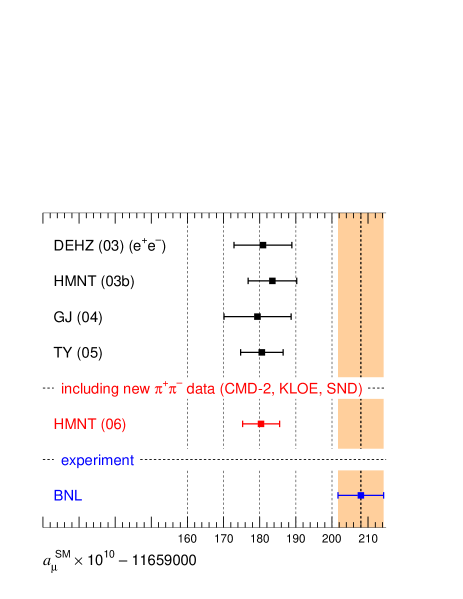
Finally, adding all the terms of (2) and (3), we obtain the updated Standard Model prediction for the anomalous magnetic moment of the muon:
| (14) |
That is, the difference is . Eq. (14) should be compared to our previous prediction (HMNT(03b)), given in the note added in proof in [7], of
| (15) |
The new data, particularly for in the centre-of-mass energy range GeV, have decreased the value of by and reduced the error from to . Both of these effects increase the disagreement with the measured value. The situation is shown pictorially in Fig. 4. We now have a discrepancy of 3.4 , which is larger than before555 If we do not use the KLOE data at all, then we have (16) in place of (12). (The change in the hadronic NLO contribution is invisible to this accuracy.) The corresponding value for the total SM prediction is (17) The deviation from the experimental value is (18) which again corresponds to a 3.4 discrepancy.,666 A preliminary DEHZ analysis [28], also including the new data, finds , for which they quote a 3.3 discrepancy.. Moreover, note that we use the recent, larger, value [9] of the light-by-light contribution, near the upper limit estimated in [10], which reduces the discrepancy.
The larger discrepancy, , which arises from the inclusion of the new data, is becoming a more significant indication of New Physics beyond the Standard Model. The effect of supersymmetry on can be seen, for example, from the reviews in [3]. Finally, it is worth noting that the theoretical error is now below the experimental error on . With further measurements of the low energy hadronic cross sections underway, which will improve the accuracy of , the case for improving the measurement of is strong.
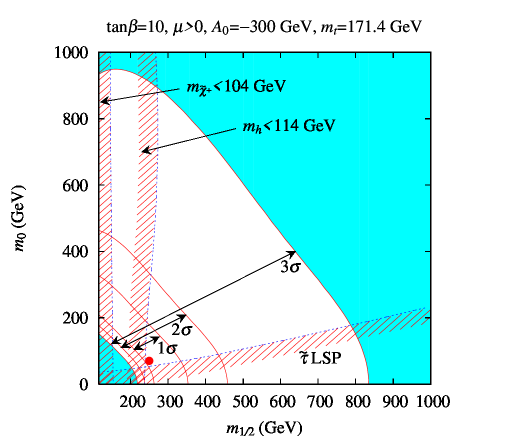
As an example of the impact of the difference , we show in Fig. 5 the allowed region of the minimal SUGRA parameters and . We choose the other parameters to be , GeV, and , so that the commonly studied reference point SPS 1a′ [29] appears as the big dot on the plane. We also plotted the constraints arising from the Higgs boson mass and the chargino mass from the negative results of direct searches at LEP [26], and that from the lightest charged SUSY particle (the region labeled by “ LSP”). (To make this figure, we used the program “SuSpect” [30] to calculate the mass spectrum of the SUSY particles except for the lightest Higgs boson mass, for which we used “FeynHiggs” [31].)
The new data also improve the predicted value of the QED coupling at the boson mass. The value of is obtained from [32]
| (19) |
using the relation
| (20) |
where , and is evaluated from the dispersion relation
| (21) |
The bare cross section is defined below (8). In comparison with (7), dispersion relation (21) is less sensitive to the values of in the low energy region. We therefore do not expect the error on to reduce quite as much as that on , when we use the improved data.
It is conventional to separate out the top-quark contribution and to write
| (22) |
where, using GeV, perturbative QCD determines . We proceed as in Ref. [7]. Using the new clustered data to evaluate the dispersion relation (21), we find
| (23) | |||||
| (24) |
This, in turn, gives
| (25) |
which should be compared to our previous estimate of The accuracy is now , which is still the least accurately determined of the three fundamental parameters of the electroweak theory; and , where is the Fermi constant.
Note added in proof: After submission of this letter a new assessment of the status of the light-by-light contributions has appeared [33]. If we would use their estimate of , the difference would slightly widen to , corresponding to a 3.5 discrepancy.
Acknowledgements
We would like to thank Achim Denig and Simon Eidelman for valuable discussions concerning the hadronic data. TT thanks the UK Particle Physics and Astronomy Research Council for an Advanced Fellowship.
References
- [1]
- [2] G. W. Bennett et al. [Muon Collaboration], Phys. Rev. D73 (2006) 072003.
-
[3]
S. Heinemeyer, W. Hollik and G. Weiglein, Phys. Rept. 425 (2006) 265;
D. Stöckinger, J. Phys. G34 (2007) R45. -
[4]
T. Kinoshita and M. Nio, Phys. Rev. D70 (2004) 113001;
M. Passera, Phys. Rev. D75 (2007) 013002. - [5] A. Czarnecki, W. J. Marciano and A. Vainshtein, Phys. Rev. D67 (2003) 073006.
- [6] C. Aubin and T. Blum, arXiv:hep-lat/0608011.
- [7] K. Hagiwara, A. D. Martin, D. Nomura and T. Teubner, Phys. Rev. D69 (2004) 093003.
- [8] A. Nyffeler, in “Tempe 2002, Phenomenology of large ”, Arizona, Jan. 2002 [arXiv:hep-ph/0203243].
- [9] K. Melnikov and A. Vainshtein, Phys. Rev. D70 (2004) 113006.
- [10] J. Erler and G. T. Sánchez, Phys. Rev. Lett. 97 (2006) 161801.
- [11] CMD-2 Collaboration: R. R. Akhmetshin et al., JETP Lett. 84 (2006) 413.
- [12] CMD-2 Collaboration: R. R. Akhmetshin et al., arXiv:hep-ex/0610021.
- [13] CMD-2 Collaboration: V. M. Aulchenko et al., JETP Lett. 82 (2005) 743.
- [14] KLOE Collaboration: A. Aloisio et al., Phys. Lett. B606 (2005) 12.
- [15] SND Collaboration: M. N. Achasov et al., J. Exp. Theor. Phys. 101 (2005) 1053.
- [16] SND Collaboration: M. N. Achasov et al., J. Exp. Theor. Phys. 103 (2006) 380.
- [17] K. Melnikov and A. Vainshtein, “Theory of the muon anomalous magnetic moment”, Berlin, Germany: Springer (2006), Chap. 3.6.
-
[18]
M. Davier, A. Höcker, and Z. Zhang,
Rev. Mod. Phys. 78 (2006) 1043;
S. Eidelman, talk given at ICHEP 2006, Moscow, July 2006. - [19] K. Abe et al. [BELLE Collaboration], arXiv:hep-ex/0512071.
- [20] CMD-2 Collaboration: A. L. Sibidanov, AIP Conf. Proc. 814 (2006) 478.
- [21] K. Hagiwara, A. D. Martin, D. Nomura and T. Teubner, to be published.
- [22] Routine made available by F. Jegerlehner, based on arXiv:hep-ph/0308117.
- [23] CMD-2 Collaboration: R. R. Akhmetshin et al., Phys. Lett. B595 (2004) 101; Phys. Lett. B605 (2005) 26.
- [24] BaBar Collaboration: B. Aubert et al., Phys. Rev. D70 (2004) 072004; Phys. Rev. D71 (2005) 052001; Phys. Rev. D73 (2006) 052003; Phys. Rev. D73 (2006) 012005.
- [25] BES Collaboration: M. Ablikim et al., Phys. Lett. B641 (2006) 145.
- [26] Review of Particle Physics: W.-M. Yao et al., J. Phys. G33 (2006) 1.
-
[27]
M. Davier, S. Eidelman, A. Höcker and Z. Zhang, Eur. Phys. J. C31 (2003) 503;
S. Ghozzi and F. Jegerlehner, Phys. Lett. B583 (2004) 222;
J. F. de Trocniz and F. J. Yndurin, Phys. Rev. D71 (2005) 073008. - [28] S. Eidelman, talk given at ICHEP 2006, Moscow, July 2006.
- [29] J. A. Aguilar-Saavedra et al., Eur. Phys. J. C 46 (2006) 43.
- [30] A. Djouadi, J. L. Kneur and G. Moultaka, Comput. Phys. Commun. 176 (2007) 426.
- [31] M. Frank, T. Hahn, S. Heinemeyer, W. Hollik, H. Rzehak and G. Weiglein, JHEP 02 (2007) 047; G. Degrassi, S. Heinemeyer, W. Hollik, P. Slavich and G. Weiglein, Eur. Phys. J. C 28 (2003) 133; S. Heinemeyer, W. Hollik and G. Weiglein, Eur. Phys. J. C 9 (1999) 343; Comput. Phys. Commun. 124 (2000) 76.
- [32] G. Gabrielse, D. Hanneke, T. Kinoshita, M. Nio, and B. Odom, Phys. Rev. Lett. 97 (2006) 030802.
- [33] J. Bijnens and J. Prades, Mod. Phys. Lett. A22 (2007) 767.