Detecting the dark matter annihilation at the ground EAS detectors
Abstract
In this paper we study the possibility of detecting gamma rays from dark matter annihilation in the subhalos of the Milky Way by the ground based EAS detectors within the frame of the minimal supersymmetric standard model. Based on the Monte Carlo simulation we also study the properties of two specific EAS detectors, the ARGO and HAWC, and the sensitivities of these detectors on the detection of dark matter annihilation. We find the ground EAS detectors have the possibility to observe such signals. Conversely if no signal observed we give the constraints on the supersymmetric parameter space, which however depends on the subhalos properties.
I introduction
The existence of cosmological dark matter has been established by a multitude of observations. The evidences come mainly from the gravitational effects of the dark matter component, such as the observations of the rotation curves in spiral galaxies and velocity dispersion in elliptical galaxies, the X-ray emission and peculiar velocities of galaxies in the clusters of galaxies, all indicating much steeper gravitational potentials than those inferred from the luminous matter. The primordial nucleosynthesis and cosmic microwave background measurements constrain the baryonic component to be about 4% of the critical density, while the total amount of the clumpy matter is about 30% of the critical density. Therefore most of the dark matter is of non-baryonic origin.
The nature of the non-baryonic dark matter is one of the most outstanding puzzles in particle physics and cosmology. However, the gravitational effects do not shed light on the solutions of this problem. Eventhough, some hints can still be obtained on the nature of dark matter. The simulation of structure formation requires the existence of dark matter and favors the nature of cold dark matter (CDM), that is, the dark matter particles are non-relativistic when they freeze out the thermal bath at the early universe. The CDM nature rules out the candidate of neutrino as the dominant component of dark matter since neutrinos are hot (relativistic) when they freeze out at the temperature of about . The precise measurement of the abundance of the dark matter component also constrains the nature of dark matter by requiring a natural explanation of the measured density. The three years WMAP data, combining with recent observational results from other experiments, give the abundance of CDM as wmap . The small error strongly constrains the dark matter models.
All the candidates of non-baryonic dark matter require physics beyond the standard model of particle physics. Among the large amount of candidates, the most attractive scenario involves the weakly interacting massive particles (WIMPs). An appealing idea is that the WIMPs form the thermal relics of the early universe and naturally give rise to the relic abundance in the range of the observed values for both the interaction strength and the masses being at the weak scale. The WIMPs are also well motived theoretically by the physics beyond the standard model to solve the hierarchical problem between the weak scale and the Planck scale. In particular, the minimal supersymmetric extension of the standard model (MSSM) provides an excellent WIMP candidate as the lightest supersymmetric particle, usually the neutralino, which are stable due to R-parity conservation jungman . The cosmological constraints on the supersymmetric (SUSY) parameter space have been extensively studied in the literature csusy .
Another appealing aspect of WIMP is that it can be detected on the present running or proposed experiments, either directly by measuring the recoil energy when WIMP scatters off the detector nuclei direct or indirectly by observing the annihilation products of the WIMPs, such as the antiprotons, positrons, -rays or neutrinos indirect . The WIMPs may also be generated in the next generation colliders, which is the most direct way to resolve the nature of the dark matter particles. The direct and indirect detection of dark matter particles are viable and complementary ways to the collider studies in order to further constrain the nature of dark matter. WIMP annihilation provides viable explanation for exotic signals observed in the cosmic ray experiments, such as the ‘GeV excess’ of the Galactic diffuse observed by EGRET egret , the bump at about 10 GeV of the positron ratio measured by HEAT heat and the TeV -ray emission at the Galactic center observed by HESS hess and CANGAROO II cangaroo .
The rate of the WIMP annihilation is proportional to the number density square of the dark matter particles. Therefore the searches for the annihilation signals should aim at the regions with high matter densities, such as at the galactic center gc or the nearby subhalos subhalo ; kou . The existence of a wealth of subhalos throughout the galaxy halos is a generic prediction of the CDM paradigm of structure formation in the Universe. High resolution simulations show that for CDM scenario the large scale structure forms hierarchically by continuous merging of smaller halos and as the remnants of the merging process about 10% to 15% of the total mass of the halo is in the form of subhalos tormen98 ; klypin99 ; moore99 ; ghigna00 ; springel01 ; zentner03 ; delucia04 ; kravtsov04 . At the center of the subhalos there are high mass densities and therefore they provide alternative sites for the search of WIMP annihilation products.
There are several advantages of detecting the -rays from the subhalos than that from the GC. First, subhalos produce clean annihilation signals, while the annihilation radiation from the GC is heavily contaminated by the baryonic processes associated with the central supermassive black hole (SMBH) and the supernova remnant Sgr A∗ Zaharijas . Furthermore, the dark matter density profile near the GC is complicated due to the existence of baryonic matter and leads to difficulties in making theoretical calculations. For example, the SMBH can either steepen or flatten the slope of the DM profile at the innermost center of the halo depending on the evolution of the black hole ullio . For subhalos, their profile may simply follow the simulation results. Second, the small subhalos form earlier and have larger concentration parameter, which leads to relatively greater annihilation fluxes. Third, the DM profile may be not universal, as shown in the simulation given in Ref. reed ; jing . Smaller subhalos have steeper central cusp. In this case, if taking the GC the NFW profile and the subhalos the Moore profile, the -ray fluxes from the subhalos may even be greater than that from the GC. Forth, according to the hierarchical formation of structures in the CDM scenario we expect that subhalos should contain their own smaller sub-subhalos, which can further enhance the annihilation flux. The sub-subhalos have been observed in the numerical simulations, such as in the Ref. zentner05 . Finally, the environmental trend seems to make the subhalos more concentrated bullock01 . However, the effects need further studies by more precise simulations.
The possibility of detecting dark matter annihilation signal from the Galactic Center (GC) has been extensively studied gc . The high energy -rays from the GC observed by HESS and CANGAROO II have been explained as a possible signal of dark matter annihilation hpf . The subhalos are approximately uniformly distributed in the Milky Way dark halos and provide potential -ray sources which will be observed in the next generation experiments. However, the position of the subhalos can not be predicted by numerical simulations, therefore the search for the -rays from the subhalos need detectors with large field of view. Unless we have known the position of a nearby subhalo the Čerenkov detectors can not do the job of blind search due to their narrow field of view (), despite they have high sensitivities. The satellite based experiments, such as the GLAST glast or the AMS ams , usually have large field of view. The possibility to detect -rays from the subhalos by GLAST has been studied kou ; peirani . However, the satellite based instruments have small effective area at the order of , which limits their ability to detect low ray fluxes. Therefore the ground based experiments, which can have very large effective area, are complementary to the satellite based experiments.
In this paper, we explore the possibility of detecting -ray signals from subhalos by the ground based EAS detectors, such as the ARGO argo and the next generation All-Sky VHE Gamma-Ray Telescope HAWC hawc . These detectors have large field of view and large effective area. In the case that the neutralino is heavy, which annihilates into -rays with high energy and low intensity, the ground based EAS detectors can be even superior than the satellite based experiments.
In the next section we first describe our model for the subhalo distribution and the particle nature of dark matter. The fluxes of gamma rays from the subhalos are then calculated. In the Sec III, we discuss how the ground EAS detectors can constrain the SUSY models and the properties of two EAS detectors and the sensitivity of dark matter detection. We finally give summary and conclusion in the Sec IV.
II model description
The flux of gamma rays from the neutralino annihilation in the subhalos is given by
| (1) |
where is the differential flux at energy by a single annihilation in unit of particle , is the mass of the dark matter particle, is the distance from the detector to the source, is the minimal value of the subhalo radius and the angular radius at the distance within the angular resolution of the detector. We notice that the integration in Eq. (1) depends only on the distribution of the dark matter , taken as a spherically-averaged form, which is determined by numerical simulation or by observations and has no relation to the particle nature of the dark matter. We define this factor as ‘cosmological factor’ and the first part in Eq. (1) the ‘particle factor’ which is exclusively determined by its particle nature, such as the mass, strength of interaction and so on.
The cosmological factor in Eq. (1) is determined by the position, mass and interior profile of the subhalo. We adopt the N-body simulation results to calculate the cosmological factor.
II.1 distribution of the subhalos
N-body simulation is widely adopted to investigate the spatial distribution and mass function of substructures in the host halo. The results show that the radial distribution of substructures is generally shallower than the density profile of the smooth background due to the tidal disruption of substructures which is most effective near the galactic center diemand . The relative number density of subhalos can be approximately given by an isothermal profile with a core diemand
| (2) |
where is the relative number density at the scale radius , with being about times the halo virial radius . The result given above agrees well with that in another recent simulation by Gao et al. gao .
Simulations show that the differential mass function of substructures has an approximate power law distribution, . In Ref. diemand both the cluster and galaxy substructure cumulative mass functions are found to be an power law, , with no dependence on the mass of the parent halo. A slight difference is found in a recent simulation by Gao et al. gao that the cluster substructure is more abundant than galaxy substructure since the cluster forms later and more substructures have survived the tidal disruption. The mass function for both scales are well fitted by . Taking the power index of the differential mass function smaller than -2 makes the fraction of the total mass enclosed in subhalos insensitive to the mass of the minimal subhalo we take. The mass fraction of subhalos estimated in the literature is around between 5 percent to 20 percent ghigna00 ; springel01 ; stoehr . In this work we will always take the differential index of and the mass fraction of substructures as 10 percent.
We then get the number density of a substructure with mass at the position to the galactic center
| (3) |
where is the virial mass of the MW, is the normalization factor determined by requiring the total mass of substructures converges to 10 percent of the virial mass of the MW. A population of substructures within the virial radius of the MW are then realized statistically due to the probability of Eq. (3). The mass of the substructures are taken randomly between , which is the lowest substructure mass the present simulations can resolve cut , and the maximal mass . The maximal mass of substructures is taken to be since the MW halo does not show recent mergers of satellites with masses larger then . The -ray flux is quite insensitive to the minimum subhalo mass since the flux from a single subhalo scales with its mass kou ; aloisio .
However, due to the finite resolution of the N-body simulations the distribution in Eq. (3) is an extrapolation of the subhalo distribution at large radius. The formula underestimates of the tidal effect which destroys most substructures near the GC. We take the tidal effects into account under the “tidal approximation”, which assumes that all mass beyond the tidal radius is lost in a single orbit while keep its density profile inside the tidal radius intact.
The tidal radius of the substructure is defined as the radius at which the tidal forces of the host exceeds the self gravity of the substructure. Assuming that both the host and the substructure gravitational potential are given by point masses and considering the centrifugal force experienced by the substructure the tidal radius at the Jacobi limit is given by hayashi
| (4) |
where is the distance of the substructure to the GC, refers to the mass within .
The substructures with will be disrupted. The mass of a substructure is also recalculated by subtracting the mass beyond the tidal radius. After taking the tidal effects into account we find the substructures near the GC are disrupted completely. The substructures with NFW profile can exist more near the GC than the Moore profile. This is because that the NFW profile has smaller .
II.2 concentration parameter
We will adopt both the NFW and Moore profiles of dark matter distribution in our study. The NFW profile was first prosed by Navarro, Frenk, and White nfw97 and supported by recent studiesnfws that the DM profile of isolated and relaxed halos can be described by a universal form
| (5) |
where and are the scale density and scale radius respectively. The two free parameters of the profile can be determined by the measurements of the virial mass of the halo and the concentration parameter determined by simulations. The concentration parameter is defined as
| (6) |
where is the virial radius of the halo and is the radius at which the effective logarithmic slope of the profile is , i.e., . For the NFW profile we have . The concentration parameter reflects how the DM is concentrated at the center.
Moore et al. gave another form of the DM profile moore to fit their numerical simulation
| (7) |
which has the same behavior at large radius as the NFW profile while it has a steeper central cusps for small than the NFW profile. The index of the central cusp at about is also favored by following higher resolution simulationsmoores . For the Moore profile we have .
Concentration parameter is obtained by simulation. In a semi-analytic model based on their simulation results Bullock et al.bullock01 found that the concentration of a halo is strongly correlated with the formation epoch of the halo. At an epoch of redshift a typical collapsing mass is defined by , where the is the linear rms density fluctuation on the comoving scale encompassing a mass , is the critical overdensity for collapsing at the spherical collapse model. The model assumes the typical collapsing mass is related to a fixed fraction of the virial mass of a halo . The concentration parameter of a halo with virial mass at redshift is then determined as . Both and are constants to fit the numerical simulations. A smaller corresponds to a smaller collapsing mass and early collapsing epoch when the Universe is denser and therefore a larger concentration parameter. Fig. 1 plots the concentration parameter at as a function of the virial mass of a halo according to the Bullock model bullock01 .
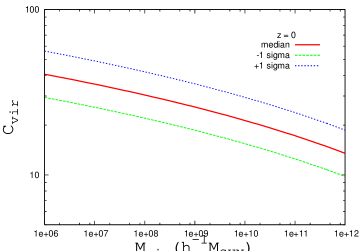
From Fig. 1 we can see that between the masses an experiential formula reflect the simulation result accurately. We expect that this exponential relation should be very well followed, since small halos form early at the epoch when the Universe is dominated by matter with approximate power-law power spectrum of fluctuationsbullock01 . However, when we fit the formula to other recent simulation results in the literature we find quite large difference, especially for subhalos from distinct small halos. We adopt these results to calculate the density profile of the substructure and furthermore the -ray flux from the substructure, which have large uncertainties, see Fig. 2. We find the concentration parameter is the most sensitive parameter in determining the -ray flux.
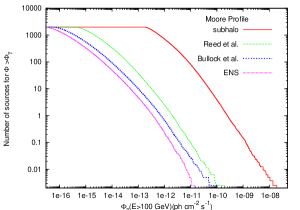
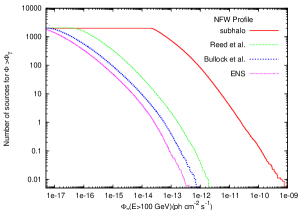
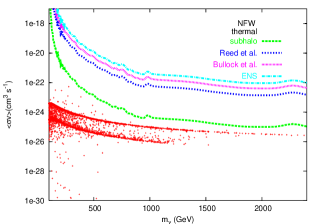
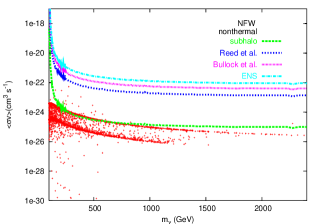
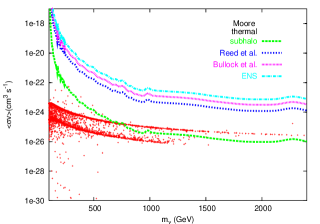
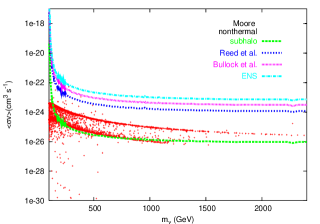
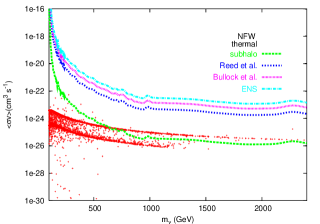
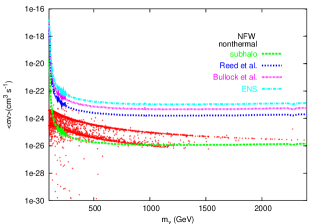
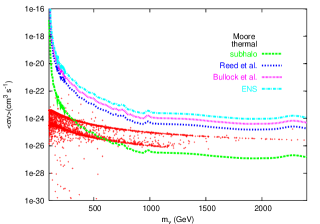
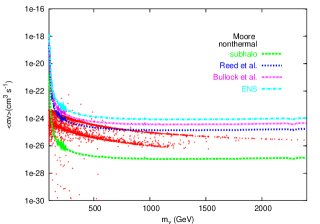
By realizing one hundred MW sized halos distributed with subhalos due to Eq. 3 we calculate the average gamma ray intensities from the MW subhalos bi . Fig. 2 gives the cumulative number of subhalos emitting -rays with the integrated flux above 100 GeV greater than a value . In the calculation we take the particle factor fixed so that the gamma ray flux from the Galactic Center is just below the experimental limit, i.e., for the Moore profile. In the left panel we plot the results for the Moore profile while the right panel is for the NFW profile. The curves are given by calculating the density profile of subhalos according to different author’s N-body simulation results, where ‘subhalo’ denotes the simulation results given in Ref. bullock01 for real subhalos in a large smooth dark halo (the dense matter environment); ‘Reed et al.’ refers to the simulation results given by Reed et al reed ; ‘Bullock et al.’ uses the median relation for distinct halos of the Bullock model given in Ref. bullock01 ; ‘ENS’ refers to the result by Eke, Navarro and Steinmetz eke for the CDM model with . The latter three models actually do not describe real subhalos. Instead they describe the distinct halos with small masses. Therefore we expect the following studies refer to ‘subhalos’ may give somewhat more realistic results. From Fig. 2 we can easily read the number of the expected detectable subhalos if the sensitivity of a detector is given with same threshold energy and angular resolution adopted here.
II.3 SUSY parameter
We now turn to the particle factor in Eq. (1). We will work in the frame of MSSM, the low energy effective description of the fundamental theory at the electroweak scale. By doing a random scan we find how the parameter space is constrained by the ground EAS detectors.
For the R-parity conservative MSSM, the lightest supersymmetric particle (LSP), generally the lightest neutralino, is stable and an ideal candidate of dark matter.
However, there are more than one hundred free SUSY breaking parameters even for the R-parity conservative MSSM. A general practice is to assume some relations between the parameters and greatly reduce the number of free parameters. For the processes related with dark matter production and annihilation, only seven parameters are relevant under some simplifying assumptions, i.e., the higgsino mass parameter , the wino mass parameter , the mass of the CP-odd Higgs boson , the ratio of the Higgs Vacuum expectation values , the scalar fermion mass parameter , the trilinear soft breaking parameter and . To determine the low energy spectrum of the SUSY particles and coupling vertices, the following assumptions have been made: all the sfermions have common soft-breaking mass parameters ; all trilinear parameters are zero except those of the third family; the bino and wino have the mass relation, , coming from the unification of the gaugino mass at the grand unification scale.
We perform a numerical random scanning of the 7-dimensional supersymmetric parameter space using the package DarkSUSY darksusy . The ranges of the parameters are as following: , , , . The parameter space is constrained by the theoretical consistency requirement, such as the correct vacuum breaking pattern, the neutralino being the LSP and so on. The accelerator data constrains the parameter further from the spectrum requirement, the invisible Z-boson width, the branching ratio of and the muon magnetic moment.
The constraint from cosmology is also taken into account by requiring the relic abundance of neutralino , where the upper limit corresponds to the 5 upper bound from the cosmological observations. When the relic abundance of neutralino is smaller than a minimal value we can assume two different cases. One is that the neutralino relic is produced thermally and represents a subdominant dark matter component. In this case we rescale the galaxy neutralino density as with . We take , the 5 lower bound of the CDM abundance wmap . The effect of coannihilation between the fermions is taken into account when calculating the relic density numerically. The other case is assuming the neutralino relic is determined by a nonthermal mechanism nonthermal . In this case the dark matter is all made up by neutralino.
The -rays from the neutralino annihilation arise mainly in the decay of the neutral pions produced in the fragmentation processes initiated by tree level final states, the quarks, leptons and gauge bosons. The fragmentation and decay processes are simulated with Pythia packagepythia incorporated in DarkSUSY. We focus our calculation on the continuum -rays from the pion decays.
Fig. 2 shows the gamma ray emission from subhalos due to a fixed particle factor. In the present work we scan the SUSY parameter space and study the variation of -ray flux from the subhalos. We then explore how the SUSY parameter space is constrained by the ground EAS detectors when observing the -ray emission from subhalos.
III observation of neutralino annihilation from subhalos
In this section, we study the observation of -rays from neutralino annihilation in subhalos by the ground based EAS detectors. We first show how the SUSY models can be constrained by the EAS detectors in an experiment-independent way by assuming its sensitivity. Then we will discuss two specific examples of such detectors, the ARGO and HAWC experiments, and their ability on the dark matter detection.
At present there are two kinds of different techniques adopted by the ground-based gamma ray detectors: the air Čherenkov telescopes (ACTs) and the extensive air shower (EAS) detectors. There has been great progresses in improving the sensitivity of the ACTs in the recent years. However, they have narrow field of view and can only view a small region of the sky at any one time. The ACTs can only operate on clear moonless nights and constrain their observation efficiency. On the other hand, the EAS detectors, such as the Tibet Array amenomori1999 and the Milagro observatory milagro , can view the entire overhead sky and operate continuously. To search the unknown -ray sources, such as the unknown AGNs or subhalos of the MW, EAS detectors with improved sensitivities are appropriate instruments.
The detectability of a signal is defined by the ratio of the signal events to the fluctuation of the background. Since the background follows the Poisson statistics, its fluctuation has the amplitude proportional to . The significance of the detection is quantified by .
The signal events are given by
| (8) |
where is the fraction of signal events within the angular resolution of the instrument and the integration is for the energies above the threshold energy to the cutoff of the spectrum at the neutralino mass, within the angular resolution of the instrument and for the observation time. The is the flux of -rays from DM annihilation. The effective area is a function of energy and zenith angle.
The corresponding expression for the background is similar to Eq. (8) by substituting the signal spectrum with the background spectrum and also the effective area to that of cosmic ray background. The background includes contributions from the hadronic and electronic comic-rays and the Galactic and extragalactic -ray emissions, which are given in bi . Since the nuclei background dominates other contributions we only consider the nuclei background in this work.
III.1 constrain the SUSY model by EAS detectors – a general discussion
In this subsection we try to give a general discussion of how the EAS detectors can constrain the SUSY parameter space. According to Fig. 2 we have known the cumulative numbers of the -ray sources generated by dark matter annihilation in subhalos for different subhalo models. The result is given for a specific SUSY model. Once the sensitivity of an EAS detector is known we can predict that how many -ray sources are expected to be detected by the detector and how the number of -ray sources varies with SUSY model, thanks to the fact, see Eq. (1), that the ‘particle factor’ and the ‘cosmological factor’ are separated. Conversely if no such gamma sources are found we can constrain the strength of the -ray sources and consequently constrain the parameter space of SUSY.
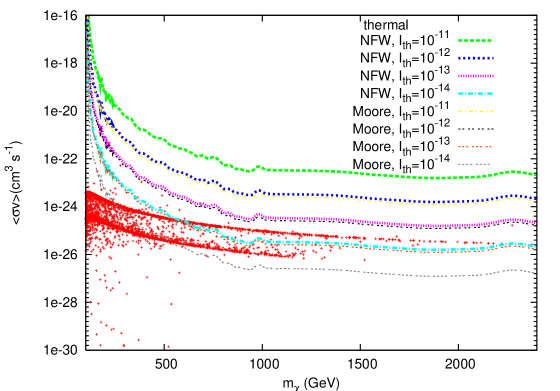
Generally the ground-based detectors have the threshold energy at the order of GeV. We assume below all the EAS detectors have such threshold energy. Assuming these detectors have large enough effective areas and have the sensitivities photons respectively, which are comparable to the sensitivities of present ACTs. The sensitivity is defined as the minimal integrated -ray flux above the threshold energy that can be observed by the detector with high significance, for example , in a finite observation time, such as to years.
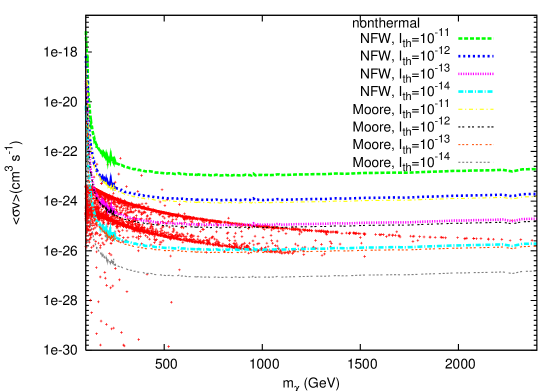
In Fig. 3 we show how the SUSY parameter space is constrained by the EAS detectors with different sensitivities. The points in the figure represent different SUSY models when scanning in the SUSY parameter space. These models above the curves predict more than one such -ray sources should be detected at the same significance level in defining . For the subhalo model we adopt the analytic model by Bullock et al. bullock01 . In the upper panel we assume the neutralino is produced thermally while the lower panel assumes the nonthermal production. Both the NFW and Moore profiles are shown in the same figure. We can see that constraints assuming Moore profile are similar to the NFW case with one order of higher sensitivity. Similarly assuming nonthermal produced also leads to more strict constraints.
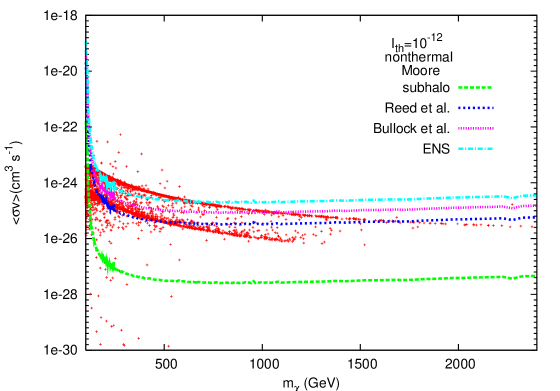
In Fig. 4 we show how the constraints depend on the subhalo models. We assume a detector with the sensitivity of photons , the dark matter is produced nonthermally and has Moore profile. We notice that for real subhalos the constraint is more severe than these models for distinct small halos.
From the Figs. 3 and 4 we see that the EAS detectors can indeed constrain the SUSY models via the observation of -rays by dark matter annihilation in the subhalos due to the virtue of large field of view and high duty circle. Considering that GLAST is superior only at low energies than the EAS detectors we expect the ground EAS detectors and GLAST are complementary to each other in the detection of dark matter annihilation in subhalos.
III.2 the ARGO and HAWC experiments
The ARGO-YBJ experiment, locates at YangBaJing (90.522∘ east, 30.102∘ north, 4300m a.s.l) in Tibet, China, is a ground-based telescope optimized for the detection of small size air showers. The energy threshold of the detector is designed to be about 100GeV. The detector consists of a single layer of RPCs floored in a carpet structure covering an area of . The detector is under construction and the central carpet has been completed. ARGO will begin stable data taking soon after.
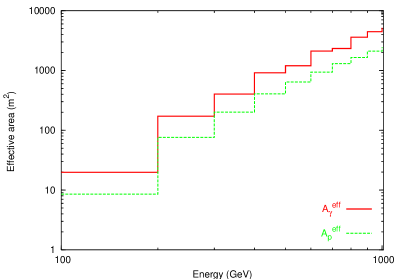
The effective area of the detector characterizes the power of the detector in recording the number of events. The effective area of the ARGO array is determined by a full Monte Carlo simulation. We simulated showers uniformly distributed over a large sampling area including the detector and selected those which satisfy the trigger conditions. The effective area is defined as
| (9) |
where is the total sample events and is the number of events satisfying the trigger conditions. In our simulation, the software package CORSIKA corsika is used to simulate the shower development of the gamma ray signals and the nuclei background in the atmosphere and ARGOG based on GEANT3argog for the response of the detector to the EAS events. To get better reconstructed events, we require the number of fired pad and the zenith angle . A sampling area of , which is large enough for the ARGO array with under the trigger condition , was used to enclose the ARGO array at its center. In Fig. 5 we give a zenith angle averaged effective area as if the source was spread uniformly over the sky between zenith angles of 0 and 45 degrees. We notice that above the threshold energy the effective area increases rapidly and reaches about 5,000 for TeV gamma rays. At the same time, simulation also shows that nucleus have lower trigger efficiency than photons leading to a suppression of the background.
While the Tibet group demonstrated the importance of a high-altitude site for the EAS array the Milagro observatory has pioneered the use of a large area water Čherenkov detector for the EAS detection and proven the efficacy of the technique and its ability to reject the nuclei background atkins2003 . Combining the advantages, a next generation high altitude water Čherenkov (HAWC) detector for VHE gamma ray detection has been proposed recently hawc . The HAWC detector with the all-sky and high-duty factor capabilities, but with a substantially lower energy threshold and a greatly increased sensitivity would dramatically improve our knowledge of the VHE gamma universe.
With an altitude above 4500 m and a large detection area of 40,000 m2 the energy threshold of HAWC is as low as 50 GeV and angular resolution of 0.25 degrees at median energy. The average effective area of HAWC between zenith angles of 0 and 45 degrees for primary photons is given in hawc by Monte Carlo simulation. We fit their result of the effective area as function of energy as for the energy in unit of GeV. We estimate the effective area of HAWC to the nuclei background by assuming a same suppression factor relative to that of primary photons as the ARGO, i.e., .
The ability of eliminating the background further by shower shape analysis in HAWC is simulated hawc . A quality factor of 1.6, which is the relative improvement in sensitivity of the detector, is produced independent of angular resolution. If combined with the angular resolution the HAWC can greatly improve the ability of background rejection.
III.3 sensitivities of ARGO and HAWC
Taking the effective area of ARGO and HAWC into the Eq. (8) and adopting the spectrum of dark matter annihilation we get the signal events for the observation time as a function of neutralino mass. We get the events of background similarly and the sensitivity of ARGO and HAWC on looking for dark matter signals. We can then study how the SUSY models are constrained by these two detectors similar to the discussions given in the subsection III.1.
In Fig. 6 we give the constraints of ARGO on the SUSY parameter space if no gamma sources are found at the 2 level for 10 years observation. The left panel gives the constraints assuming that the dark matter are produced thermally while the right is for nonthermal production. We assume a NFW profile of the subhalos. Fig. 7 gives similar results assuming the dark matter profile is the Moore profile.
In Figs. 8 and 9 we show the constraints on the SUSY parameter space from HAWC for 5 years observation. We can see that the sensitivity is greatly improved compared with ARGO. If neutralino is produced nonthermally most SUSY parameter space will by constrained by HAWC for the case of ‘subhalo’ model.
IV Summary and Conclusion
In the work we discuss the possibility to search the dark matter annihilation gamma rays in the subhalos of the MW. The absolute flux from the subhalos may be smaller than that from the galactic center, however the subhalos are also less influenced by the baryonic matter. For heavy dark matter particles which may produce high energy and low flux the ground based detectors with wide field of view are complementary to the satellite based detectors, such as GLAST kou .
Based on the N-body simulation results and scanning in the SUSY parameter space we calculate the flux of gamma rays from the subhalos. We then discuss the possibility of detection of these fluxed at ground EAS detectors, especially the ARGO and HAWC experiments. The properties of ARGO and HAWC are studied by Monte Carlo simulations. Due to our results the SUSY parameter space is constrained if no gamma signal from the subhalos is detected. In conclusion, the ground based detectors have the capability to search the dark matter signal and constrain the SUSY parameter space, complementary to the GLAST.
Acknowledgements.
This work is supported by the NSF of China under the grant No. 10575111 and supported in part by the Chinese Academy of Sciences under the grant No. KJCX3-SYW-N2.References
- (1) D. N. Spergel et. al., Astrophys. J. Suppl. 148, 175 (2003); D. N. Spergel et. al., astro-ph/0603449.
- (2) G. Jungman, M. Kamionkowski, K. Griest, Phys. Rept. 267, 195 (1996).
- (3) G. Belanger, F. Boudjema, S. Kraml, A. Pukhov, A. Semenov, Phys.Rev. D 73 (2006) 115007; A. Djouadi, M. Drees, J.-L. Kneur, JHEP 0603 (2006) 033; H. Baer, T. Krupovnickas, S. Profumo, P. Ullio, JHEP 0510 (2005) 020; H. Baer, A. Mustafayev, S. Profumo, A. Belyaev, X. Tata, JHEP 0507 (2005) 065; G. Belanger, S. Kraml, A. Pukhov, Phys. Rev. D72 (2005) 015003; B.C. Allanach, G.Belanger, F.Boudjema, A. Pukhov, JHEP 0412 (2004) 020; J. Ellis, K.A. Olive, Y. Santoso, V.C. Spanos, Phys. Lett. B 565 (2003) 176.
- (4) C. Munoz, Int. J. Mod. Phys. A. 19, 3093 (2004).
- (5) J. L. Feng, K. T. Matchev, F. Wilczek, Phys. Rev. D 63, 045024 (2001); G. Bertone, D. Hooper, J. Silk, Phys. Rept. 405, 279 (2005).
- (6) S.D. Hunter et al., Astrophys. J. 481, 205 (1997); H.A. Mayer-Hasselwander et al., A&A 335, 161 (1998); R.C. Hartman et al., Astrophys. J. Suppl. Ser. 123, 79 (1999).
- (7) S. W. Barwick et al. [HEAT Collaboration], Astrophys. J. 482, L191 (1997).
- (8) F. Aharonian et al. [H.E.S.S. Collaboration], A&A 425, L13 (2004).
- (9) K. Tsuchiya et al. [CANGAROO-II Collaboration], Astrophys. J. 606, L115 (2004).
- (10) L. Bergstrom, P. Ullio, J. Buckley, Astropart. Phys. 9, 137 (1998); D. Horns, Phys. Lett. B 607, 225 (2005).
- (11) L. Bergström, J. Edsjö, P. Gondolo, P. Ullio, Phys. Rev. D 59, 043506 (1999); C. Calcaneo-Roldan, B. Moore, Phys.Rev. D 62, 123005 (2002); A.Tasitsiomi and A.V. Olinto, Phys.Rev. D 66, 083006 (2002); R. Aloisio, P. Blasi, A. V. Olinto, Astrophys. J. 601, 47 (2004); L. Pieri, E. Branchini, Phys. Rev. D 69, 043512 (2004); N.W. Evans, F. Ferrer, S. Sarkar, Phys.Rev. D 69, 123501 (2004).
- (12) S.M. Koushiappas, A.R. Zentner, T. P. Walker, Phys. Rev. D 69, 043501 (2004).
- (13) G. Tormen, A. Diaferio, D. Syer, 1998, MNRAS, 299, 728.
- (14) A. Klypin, S. Gottlöber, A. V. Kravtsov, A. M. Khokhlov, 1999, ApJ, 516, 530; A. Klypin et al., ApJ, 522, 82 (1999).
- (15) B. Moore, S. Ghigna, F. Governato, G. Lake, T. Quinn, J. Stadel, P. Tozzi, 1999, ApJ, 524, L19.
- (16) S. Ghigna, B. Moore, F. Governato, G. Lake, T. Quinn, J. Stadel, 2000, ApJ, 544, 616.
- (17) V. Springel, S.D.M. White, G. Tormen, G. Kauffmann, MNRAS, 328, 726 (2001).
- (18) A. R. Zentner, J. S. Bullock, 2003, ApJ, 598, 49.
- (19) G. De Lucia, G. Kauffmann, V. Springel, S. D. M. White, B. Lanzoni, F. Stoehr, G. Tormen, N. Yoshida, 2004, MNRAS, 348, 333.
- (20) A. V. Kravtsov, O. Y. Gnedin, A. A. Klypin, 2004, ApJ, 609, 482.
- (21) Gabrijela Zaharijas, Dan Hooper, Phys.Rev. D73, 103501 (2006).
- (22) P. Ullio, H.S. Zhao, Marc Kamionkowski, Phys. Rev. D 64, 043504 (2001).
- (23) D. Reed, F. Governato, L. Verde, J. Gardner, T. Quinn, J. Stadel, D. Merritt, G. Lake, MNRAS 357, 82 (2005), astro-ph/0312544.
- (24) Y.P. Jing, Y. Suto, Astrophys. J. 529,L69 (2000); Astrophys. J. 574, 538 (2002).
- (25) A.R. Zentner, A.A. Berlind, J.S. Bullock, A.V. Kravtsov, R.H. Wechsler, Astrophys.J. 624, 505 (2005).
- (26) J. S. Bullock, T. S. Kolatt, Y. Sigad, R. S. Somerville, A. V. Kravtsov, A. A. Klypin, J. R. Primack, A. Dekel, MNRAS 321, 559 (2001).
- (27) D. Hooper, I. de la Calle Perez, J. Silk, F. Ferrer, S. Sarkar, JCAP 0409, 002 (2004); D. Horns, Phys. Lett. B607, 225 (2005); S. Profumo, Phys. Rev. D 72, 103521 (2005); F. Ferrer, astro-ph/0505414.
- (28) A.Morselli et al., Proc. of the 32nd Rencontres de Moriond (1997).
- (29) see the home page of AMS02 at http://ams.cern.ch/AMS/ams_homepage.html .
- (30) S. Peirani, R. Mohayaee, J.A. de Freitas Pacheco, Phys. Rev. D 70, 043503 (2004).
- (31) Z. Cao, talk at 29th ICRC, India, August 3, 2005.
- (32) G. Sinnis, A. Smith, J.E. McEnery, astro-ph/0403096.
- (33) J. Diemand, B. Moore, J. Stadel, MNRAS 352, 535 (2004).
- (34) L. Gao, S.D.M. White, A. Jenkins, F. Stoehr, V. Springel, MNRAS 355, 819 (2004).
- (35) F. Stoehr, S.D.M. White, V. Springle, G. Tormen, N. Yoshida, MNRAS, 345, 1313 (2003).
- (36) The physical cutoff of the minimal substructure is given in A. M. Green, S. Hofmann and D. J. Schwarz, JCAP 0508, 003 (2005); MNRAS 353, L23 (2004); S. Hofmann, D. J. Schwarz and H. Stoecker, Phys. Rev. D 64 083507 (2001).
- (37) R. Aloisio, P. Blasi, A. V. Olinto, Astrophys.J. 601, 47 (2004).
- (38) E. Hayashi, J. F. Navarro, J. E. Taylor, J. Stadel, T. Quinn, Astrophys.J. 584, 541 (2003).
- (39) J. F. Navarro, C. S. Frenk, and S. D. M. White, Mon. Not. R. Astron. Soc. 275, 56 (1995); J. F. Navarro, C. S. Frenk, and S. D. M. White, Astrophys. J. 462, 563 (1996); J. F. Navarro, C. S. Frenk, and S. D. M. White, Astrophys. J. 490, 493 (1997).
- (40) A. Huss, B. Jain, M. Steinmetz, Astrophys. J. 517, 64 (1999); J. E. Taylor, J. F. Navarro, Astrophys. J. 563, 483(2001); A. Dekel, J. Devor, G. Hetzroni, MNRAS 341, 326 (2003); A. Dekel, I. Arad, J. Devor, Y. Birnboim, Astrophys. J. 588, 680 (2003); C. Power, J. F. Navarro, A. Jenkins, C. S. Frenk, S. D. M. White, V. Springel, J. Stadel, and T. Quinn, MNRAS 338, 14 (2003).
- (41) B. Moore, F. Governato, T. Quinn, J. Stadel, & G. Lake, ApJ 499, 5 (1998); B. Moore, T. Quinn, F. Governato, J. Stadel, & G. Lake, MNRAS, 310, 1147 (1999).
- (42) S Ghigna, B. Moore, F. Governato, G. Lake, T. Quinn, J. Stadel, Astrophys. J. 544, 616 (2000); F. Governato, S. Ghigna, B. Moore, astro-ph/0105443; T. Fukushige, J. Makino, Astrophys. J. 557, 533 (2001); T. Fukushige, J. Makino, Astrophys. J. 588, 674 (2003).
- (43) X.J. Bi, Nucl. Phys. B 741, 83 (2006).
- (44) V.R. Eke, J.F. Navarro, M. Steinmetz, Astrophys. J. 554, 114 (2001).
- (45) P. Gondolo, J. Edsjo, P. Ullio, L. Bergstrom, M. Schelke, E.A. Baltz, JCAP 0407, 008 (2004), astro-ph/0406204.
- (46) R. Jeannerot, X. Zhang, R. Brandenberger, JHEP 9912, 003 (1999); W.B. Lin, D.H. Huang, X. Zhang, R. Brandenberger, Phys. Rev. Lett. 86, 954 (2001); M. Endo, F. Takahashi, Phys. Rev. D 74, 063502 (2006); G. Gelmini, P. Gondolo, A. Soldatenko, C. E. Yaguna, hep-ph/0610379.
- (47) T. Sjöstrand et al., Comput. Phys. Commun. 135, 238 (2001).
- (48) Amenomori, M, et al., 1999, ApJ, 525, L93.
- (49) R.W. Atkins et al., Nucl. Instrum. Meth. A 449, 478 (2000).
- (50) http://www-ik.fzk.de/ heck/corsika/
- (51) http://www.fisica.unile.it/ argo/analysis/argog/index.html
- (52) R.A. Atkins, et al., 2003, ApJ, 595, 803.