hep-ph/0610333
HRI-P-06-10-001
CU-PHYSICS-17/2006
Neutrino mass hierarchy and with a magic baseline beta-beam experiment
Sanjib Kumar Agarwalla⋆,†,a,
Sandhya Choubey⋆,b, Amitava Raychaudhuri⋆,†,c
⋆Harish-Chandra Research Institute,
Chhatnag Road, Jhunsi, Allahabad 211019, India
†Department of Physics, University of Calcutta,
92 Acharya Prafulla Chandra Road, Kolkata 700009, India
PACS numbers: 14.60.Pq, 14.60.Lm
ABSTRACT
We underscore the physics advantage of an experiment where neutrinos produced in a beta-beam facility at CERN are observed in a large magnetized iron calorimeter (ICAL) at the India-based Neutrino Observatory (INO). The CERN-INO distance is close to the so-called “magic” baseline which helps evade some of the parameter degeneracies and allows for a better measurement of the neutrino mass hierarchy and . We expound the possibility of using radioactive and as the source isotopes for the and beta-beam, respectively, and show that very good sensitivity to both the mass hierarchy and is possible with a boost in the 250-500 ballpark.
a email: sanjib@mri.ernet.in
b email: sandhya@mri.ernet.in
c email: raychaud@mri.ernet.in
1 Introduction
Spectacular results from a series of experiments involving solar [1], atmospheric [2], reactor [3], and accelerator [4, 5] neutrinos have firmly established neutrino oscillations and heralded the precision era in neutrino physics. Next generation experiments have been planned/proposed world-wide to further pin down the values of the oscillation parameters, 111We define . and for solar neutrinos and and for atmospheric neutrinos. However, a vital task to be undertaken in the immediate future is the determination of the hitherto unknown mixing angle 222Currently, only an upper bound ( at [6, 7]) exists.. Discovery of a non-zero value for would open up the possibility of observing CP-violation in the lepton sector. Another outstanding problem concerns the ordering of the neutrino mass states, aka, the neutrino mass hierarchy. If Nature entertains a large enough mixing angle , it could be possible to ascertain and hence the neutrino mass hierarchy333The neutrino mass hierarchy is termed “normal” (“inverted”) if is positive (negative). Note that the terms normal and inverted “hierarchy” in this article refers to the neutrino mass ordering only, i.e., whether is heavier or lighter than , and our discussions are valid even for a quasi-degenerate neutrino mass spectrum..
The neutrino mass hierarchy can be probed in terrestrial experiments through matter effects [8, 9, 10]. Large matter effects are known to exist in the oscillation probability (). Since it also provides the best way of determining the mixing angle and the CP phase, , it has been popularly hailed as the “golden channel” [11]. The channel can be studied in experiments which use an initial (or ) beam and a detector which can efficiently see muons444This is complementary to the standard accelerator beams where the initial (anti)neutrino flux consists of (or ) and where the relevant channel is the probability . Produced from decay of accelerated pions, these conventional (anti)neutrino beams suffer from an additional hurdle of an intrinsic () contamination, which poses a serious problem of backgrounds. A -beam is comprised of pure (or ).. An absolutely pure and intense (or ) flux can be produced using “Beta Beams” (-beam) [12]. There is a possibility of such a facility coming up at the CERN accelerator complex and an international R&D effort is underway to check the feasibility of this proposal [13]. The Tevatron at FNAL has also been discussed as a potential accelerator for producing -beams. Most studies involving beta-beams have concentrated on using megaton water C̆erenkov detectors for observing oscillations through muons produced via (or ). The reason is that these analyses consider low to medium values for the acceleration of the unstable ions which create a relatively low energy (anti)neutrino beam. The detector therefore should be capable of observing the resultant low energy muons efficiently and unambiguously. Water C̆erenkov detectors are particularly well suited for this. However, in contrast to most of the previous work involving -beams, which have mainly shown the physics potential of these kinds of experiments in determining and , in this paper we are especially interested in deciphering the neutrino mass hierarchy and simultaneously. To that end, we suggest a -beam with (anti)neutrino energies where we expect the largest earth matter effects, that is, energies in the multi-GeV regime. These high energy (or ) can be very efficiently observed in large magnetized iron detectors, such as the envisaged ICAL detector at the India-based Neutrino Observatory [14].
A serious complication with all long baseline experiments involving the golden channel arises from degeneracies which manifest in three forms:
This leads to an eight-fold degeneracy [18], with several spurious or “clone” solutions in addition to the true one and severely deteriorates the sensitivity of any experiment. It has been shown [18, 19] that the problem of clone solutions due the first two types of degeneracies can be evaded by choosing the baseline of the experiment equal to the characteristic refraction length due to the matter inside earth [8, 18, 19, 20]. This special value goes by the colloquial name “magic baseline” [19]. As we will discuss in detail later, at this baseline the sensitivity to the mass hierarchy and, more importantly, , goes up significantly [19, 21], while the sensitivity to is absent.
Interestingly, the CERN-INO distance of 7152 km happens to be tantalizingly close to the magic baseline. This large baseline also enhances the matter effect and requires traversal through denser regions of the earth. Thus, for neutrinos (antineutrinos) with energies in the range 3-8 GeV sizable matter effects are induced if the mass hierarchy is normal (inverted). A unique aspect of this set-up is the possibility of observing near-resonant matter effects in the channel. In fact, to our knowledge, what we propose here is the only experimental situation where near-resonant matter effects can be effectively used in a long baseline experiment to study the neutrino mass matrix. We show in this paper that the presence of this near-maximal earth matter effect not only maximizes the sensitivity to the neutrino mass hierarchy, it also gives the experiment an edge in the determination of the mixing angle . The increase in the probability due to near-resonant matter effects, compensates for the fall in the -beam flux due to the very long baseline, so that one can achieve sensitivity to and mass hierarchy which is comparable, even better, than most other proposed experimental set-ups. Therefore a -beam experiment with its source at CERN and the detector at INO could emerge as a powerful tool for a simultaneous determination of the neutrino mass hierarchy and .
In [22] such an experimental set-up was considered for the first time and the physics potential explored. It was demonstrated that both the neutrino mass hierarchy as well as may be probed through such a set-up. The ions considered for the -beam in that work were the most commonly used (for ) and (for ). One requires very high values of the Lorentz boost for these ions () because the energy of the beam has to be in the few GeV range to enable detection in the ICAL detector, which is expected to have a threshold of about 1 GeV555Most studies on the physics reach of -beam experiments have energies in the few hundred MeV range.. Such high values of , although possible in principle, might turn out to be very difficult to realize. Very recently two other ions, (for ) and (for ), have been projected as viable options for the -beam source [23]. The main advantage that these ions offer is their substantially higher end-point energy, . This allows one to access few GeV very easily with medium values of , that could be possible to achieve with either the existing CERN technology, or with the projected upgrades. The physics potential of these alternative ions to study standard neutrino oscillation parameters in the context of a CERN to Gran Sasso -beam experiment has been expounded in [24], while in [25] they have been studied to test R-parity violating SUSY.
In this paper we will work with and as the candidate ions for the -beam source at CERN and ICAL at INO as the far detector. We perform a analysis of the projected data in a future CERN-INO -beam experiment and present our results for three plausible benchmark values of the Lorentz boost factor . We begin in section 2 with a brief description of the -beam produced at the source. In section 3 we discuss the oscillation probability and highlight the importance of the magic baseline and the near-resonant matter effects in the channel. Section 4 contains our results for the event rate expected in the ICAL detector. In section 5 we present the details of the statistical analysis used. The sensitivity of the results on the mixing angle are presented in section 6, while section 7 focuses on the sensitivity to the neutrino mass hierarchy. In section 8 we consider exploiting the potential of muon charge identification at ICAL at INO through a -beam running simultaneously in both the and mode. We end in section 9 with our conclusions.
2 The -Beam Fluxes
The concept of a -beam was proposed by Zucchelli [12, 26]. The idea is to produce a pure, intense, collimated beam of or through the beta decay of highly accelerated and completely ionized radioactive ions circulating in a storage ring [27]. The resultant beam therefore comprises only of (or ) and has definite characteristics, determined by the well known beta decay spectrum and the Lorentz boost factor. The former feature results in very low backgrounds while the latter ensures that there are essentially negligible flux systematics. This proposal is being studied in depth and fully exploits the existing CERN accelerator complex. The main future challenge lies in manufacturing an intense proton driver and a hippodrome-shaped decay ring which are at the core of this program.
2.1 The Beta Decay Spectrum
In the rest frame of the radioactive ion the beta decay spectrum is given by
| (1) |
where is the electron mass, the electron total end-point energy, and are the neutrino energy and lifetime of the decaying ion respectively in the latter’s rest frame and is a function of . In the lab frame, the flux of the unoscillated -beam at the detector is given by
| (2) |
where is the distance between the source and detector, are the number of useful decays in the storage ring per unit time, is the angle between the neutrino flight direction and the direction in which the ions are boosted666We work with the on-axis flux for which . and is the Lorentz boost such that , being the neutrino energy in the lab frame. The maximum energy of neutrinos produced by a -beam with a Lorentz factor is given by
| (3) |
2.2 Candidate Ions for the -beam
| Ion | (s) | (MeV) | Decay fraction | Beam | |
|---|---|---|---|---|---|
| Ne | 2.41 | 3.92 | 820.37 | 92.1% | |
| He | 1.17 | 4.02 | 934.53 | 100% | |
| B | 1.11 | 14.43 | 600684.26 | 100% | |
| Li | 1.20 | 13.47 | 425355.16 | 100% |
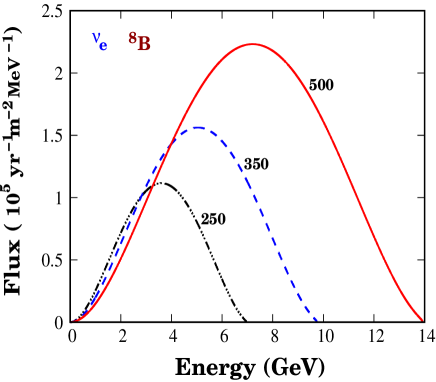
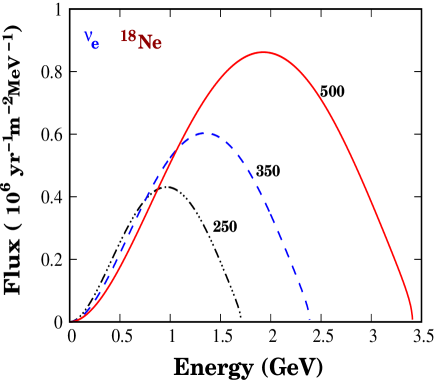
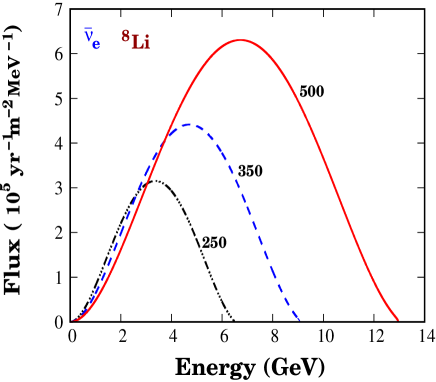
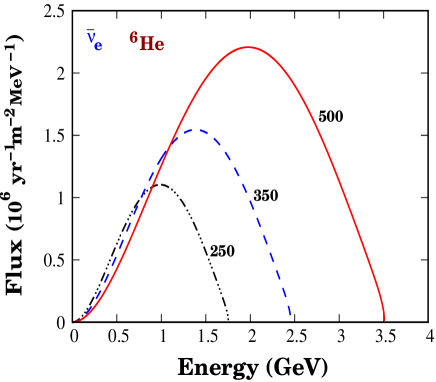
From Eq. (2) it is seen that the total flux and energy of the -beam at the far detector depends mainly on the end point energy of the beta decay ion and the Lorentz boost factor . The flux increases as both and increase. Larger results in better collimation of the impinging flux, thereby increasing the statistics. The spectrum also shifts to larger energies as and increase. The neutrino cross section in the detector increases with energy, so for the same total flux a harder spectrum further enhances the statistics. Since the flux falls as as the source-detector distance increases, high values of either or or both are needed to have sizable number of events at the far detector. is an intrinsic property of the decaying ion while is restricted by the nature of the accelerators and the machine design. The other desired properties which the ion should have include high production yield, large decay fraction, and a life time that is long enough to allow the ions to be adequately accelerated. It is also easier to store larger number of lower- isotopes in the storage ring [28]. In Table 1 we show the characteristic features of the four different ions which have been discussed in the literature as possible candidates for the -beam. While and are emitters (producing a beam), and are emitters (producing a beam). They all have comparable life times, conducive to the requirements necessary for the -beam, very high (or maximal) decay fraction and very low ratio. Note that the end-point energies, , for and are much larger than those for and .
In this paper we are interested in the physics potential of an experimental set-up with a -beam at CERN and a large magnetized iron detector in India. For such a large baseline, one needs a very high value of , both to cross the detector energy threshold as well as to get reasonable statistics in the detector. In particular, with (or ) as the source ion, one needs . Such high values of can only be achieved by using the LHC itself. As noted above, for the alternative options for the radioactive ion source ( and ) is higher by a factor of about four. This means that it should be possible to produce high intensity, high energy beams with and for a much lower boost factor777The loss in collimation is not significant as we show later.. We show in Fig. 1 the (left-hand panel) and (right-hand panel) -beam flux expected at INO as a function of the energy, for three different benchmark values of . Fig. 2 shows the corresponding spectra for the (left-hand panel) and (right-hand panel) -beam. Note that even though apparently it might seem from the figures that the () flux is larger for (), in reality, for a given , the total flux is given by the area under the respective curves. One can easily check that for a fixed this is same for both the ions as expected, since we have assumed equal number of decays for both and for ( and for )888Of course, the on-axis flux increases with because of better collimation of the beam.. Also note that even though the total () flux remains the same for both the ions for a given , the number of events produced in the detector is much enhanced for the () beam since the energy of the beam is larger and the charged current cross sections increase with the neutrino energy. Studies have shown that it is possible to accelerate to with the existing facilities at CERN, while should be accessible with the “Super-SPS”, an upgraded version of the SPS with super-conducting magnets [30, 31]. The Tevatron at FNAL could in principle also be used to produce a -beam with .
In the low design of beta-beams and useful decays per year should be possible to achieve. Earlier, only these ions were considered because it was believed that could not be produced with the standard ISOLDE techniques. Since most exercises focused on observation of CP-violation, it was necessary to have both and beams with similar spectra, so (though considered in [28]) was also generally ignored. Interest in both these ions have been rekindled recently [23, 24], as it appears that having intense and fluxes should be feasible using the ionization cooling technique [23]. In what follows, we will vary the value of to test the physics potential of the CERN -beam INO-ICAL set-up and, following the current practice, assume that it is possible to get useful decays per year for and for for all values of .
3 Oscillation Phenomenology – The Magic Baseline
In this section we will very briefly review some issues related to the neutrino oscillation probability. We consider the standard form of the neutrino mixing matrix
| (4) |
where , and we ignore the Majorana phases. From the analyses of the current solar, atmospheric, reactor, and accelerator data set one has the following constraints on the oscillation parameters [7]:
| (5) |
| (6) |
| (7) |
Throughout this paper we show all our results assuming certain true values for the oscillation parameters , , , and given in Table 2. We will let take all possible true values (which we will call ) and present our result as a function of .
Since both and are very small parameters, as can be seen from the current constraints, we can expand the so-called “golden channel” probability in the constant matter density approximation as999This particular low order expansion of the transition probability is valid only in the range of and where the resonance condition is never reached. For the and range that we consider in this paper, this condition is satisfied and Eq. (8) fails, as we discuss later in this section. Nonetheless, we present this expression to illustrate the effect of the magic baseline. [11, 32]
| (8) | |||||
where
| (9) |
| (10) |
being the matter potential, where is the electron number density inside the earth and we have expanded the probability in and , keeping only up to second order terms in both these parameters. The + ( ) sign in Eq. (10) refers to neutrinos (antineutrinos). The first term of Eq. (8) can be used to extract information about the value of . This is also the term which has the largest earth effect and this effect of matter can be used to determine the sign of . The second (CP violating) and third (CP conserving) terms depend on the CP phase and can be used to find it. The last term is independent of both and and depends mainly on the solar parameters and . In very long baseline experiments, this term has sizable matter effects and if the true value of turns out to be zero (or nearly zero), this would be the only surviving term in which could still be used to study matter enhanced oscillations [33].
Despite its advantage in determining the most interesting oscillation parameters, this channel is, however, rife with the problem of “degeneracies” – the - intrinsic degeneracy [15], the degeneracy [16] and the octant of degeneracy [17] – leading to an overall eight-fold degeneracy in the parameter values [18]. Various schemes to tackle some or all of these problems have been studied in great detail in the literature. These can be broadly categorized into ones where data from experiments at different energies and different baselines are combined together [15, 34, 35, 36, 37, 38], where data from accelerator experiments observing different oscillation channels are considered together [39, 40], and where data from atmospheric [41, 42] or reactor experiments [43] are combined with the golden channel measurements in an accelerator experiment.
A particularly interesting scenario arises when the condition
| (11) |
is satisfied. In such an event, the last three terms in Eq. (8) drop out and the channel enables a clean determination of and .
Since by definition, the condition (11) reduces to , where is the electron fraction inside the earth. This gives
| (12) |
which for the PREM [44] density profile of the earth is satisfied for the “magic baseline” [19]
| (13) |
We refer the reader to [20] for a very recent and enlightening discussion on the physical meaning of the magic baseline.
The CERN-INO distance corresponds to km, which is tantalizingly close to the magic baseline. We therefore expect that the -beam experiment we consider here should give an essentially degeneracy-free measurement of both and .
The large CERN-INO baseline, of course, results in very significant earth matter effects in the channel. In fact, for the baseline of 7152 km, the average earth matter density calculated using the PREM earth matter density profile is gm/cc, for which the resonance energy
| (14) | |||||
| (15) |
for eV2 and . One can check (cf. Figs 1 and 2) that this is roughly in the ballpark where we expect the maximum -beam flux for and ions with the benchmark values used in this paper.
Note that the low order expansion of the probability given by Eq. (8) is valid only for values of and earth matter density (and hence ) where flavor oscillations are far from resonance, i.e., . In the limit , one can check that even though the analytic expression for given by Eq. (8) remains finite, the resultant probability obtained is incorrect [45]. We reiterate that Eq. (8) was presented only in order to elucidate the importance of the magic baseline. For all the numerical results presented in this paper, we calculate the exact three generation oscillation probability using the realistic PREM [44] profile for the earth matter density.
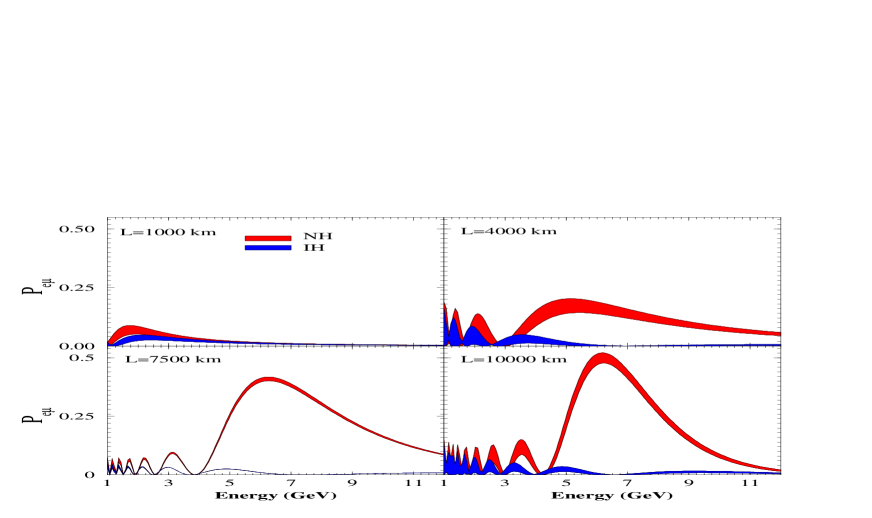
The exact neutrino transition probability using the PREM density profile is given in Fig. 3 as a function of the neutrino energy, for four different baselines (four panels). We allow to take on all possible values between 0-360 degrees and the resultant probability is shown as a band, with the thickness of the band reflecting the effect of on . The figure is drawn assuming the benchmark values of the oscillation parameters given in Table 2 and . We show the probability for both the normal hierarchy (dark band) as well as the inverted hierarchy (light band). As discussed in detail above, for km, which is close to the magic baseline, the effect of the CP phase is seen to be almost negligible, while for all other cases the impact of on is seen to be appreciable. In fact, for km, the probability corresponding to the normal and inverted hierarchy become almost indistinguishable due to the uncertainty arising from the unknown value of . As the baseline is increased, earth matter density increases, enhancing the impact of matter effects. The probability for normal hierarchy is hugely enhanced for the neutrinos, while for the inverted hierarchy matter effects do not bring any significant change. This difference in the predicted probability, evident in the panels corresponding to , 7500 and 10000 km of Fig. 3, can be used to determine the neutrino mass hierarchy.
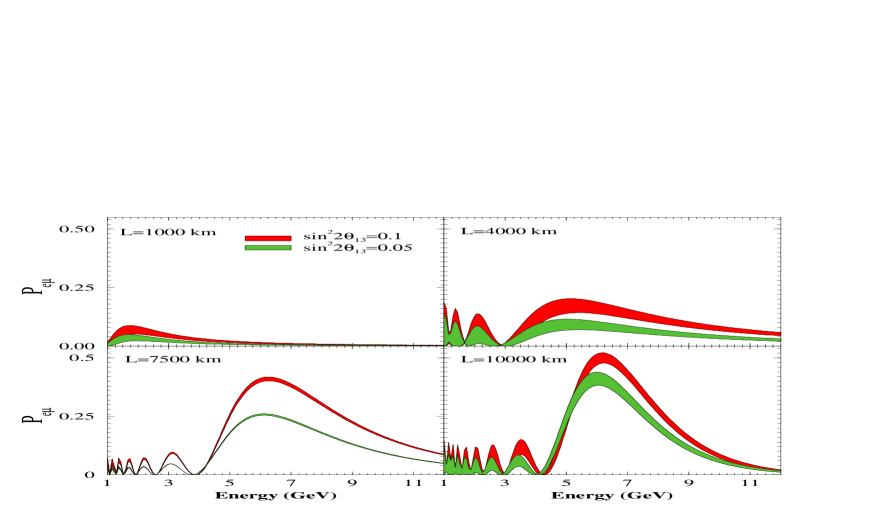
In Fig. 4 we display the dependence of the neutrino probability on the mixing angle for four different baselines. The dark bands, as in Fig. 3, are for normal hierarchy and with full variation of , while the light bands are for normal hierarchy and . The impact of matter effect in increasing the sensitivity of a given experimental set-up is evident from the figure. The sensitivity for km can be seen to be much weaker than for the other cases, since matter effects are smaller. However, the most striking feature seen in Fig. 4 is the effect of the magic baseline in enhancing the sensitivity of the experiment to . The figure clearly shows that the difference in the predicted for the two values of is largest for km (since effect of is the least) and thus an experiment at this baseline is most suitable for probing . Figs. 3 and 4 therefore reinforce our choice of the near-magic baseline as one of the best options for determining the neutrino mass hierarchy and , since both these parameters are directly related to large matter effects and the uncertainty of could prove to be a hindrance in their measurement at non-magic baselines.
4 Event Rates in INO-ICAL
4.1 The ICAL Detector at INO
The proposed large magnetized iron calorimeter at the India-based Neutrino Observatory [14] is planned to have a total mass of 50 kton at startup, which might be later upgraded to 100 kton. The INO facility is expected to come up at PUSHEP (lat. North 11.5∘, long. East 76.6∘), situated close to Bangalore in southern India. This constitutes a baseline of 7152 km from CERN. The ICAL detector will have a modular structure with a total lateral size of , divided into three modules of each. Each of these modules will have 140 horizontal layers of cm thick iron plates, separated from each other by a gap of cm to hold the active detector material, giving a total height of 12 m for the full detector. The active detector elements will be resistive plate chambers (RPC), made from either glass or Bakelite and will be filled with a suitable gas mixture, which will be recycled with approximately one volume change per day. An external magnetic field of Tesla would be applied over the entire detector. The detector will be surrounded by an external layer of scintillator or proportional gas counters which will act both as veto to identify external muon backgrounds as well as to identify partially contained events.
According to the detector simulation performed by the INO collaboration, the detector energy threshold for is expected to be around GeV and charge identification efficiency will be about 95%. In what follows, we will present our numerical results assuming an energy threshold of 1.5 GeV, detector charge identification efficiency as 95% and unless stated otherwise, detection efficiency as 60% for (cf. Table 3). The 60% detection efficiency we have used is an extremely conservative estimate and it should be possible to increase it to at least 80%. We shall therefore also present our main results for this more optimistic estimate for the detector efficiency. However, unless it is mentioned otherwise, all our results correspond to the detector characteristics given in Table 3. We have explicitly checked that our results remain unaffected if the energy threshold is raised to 2 GeV for the entire range of assumed Lorentz boost factor . For the threshold can be even 3 GeV, while for one can work with an energy threshold of 4 GeV, without changing the final results. This can be seen from Figs. 1 and 2; for , the majority of neutrinos arriving at INO-ICAL would have GeV.
| Total Mass | 50 kton |
|---|---|
| Energy threshold | 1.5 GeV |
| Detection Efficiency () | 60% |
| Charge Identification Efficiency () | 95% |
4.2 Oscillation Signal
The total number of events collected in INO-ICAL from a (or ) -beam exposure over a period of years is given by,
| (16) |
where are the number of target nucleons, is the charge identification efficiency, is the detection efficiency, (given by Eq. (2)) is the -beam flux at INO-ICAL in units of m-2year-1GeV-1, is the detection cross section for in units of m2, is the true energy of the incoming neutrino and is the measured energy101010The “measured” energy of the neutrino can be reconstructed from the total measured energy of the muon and the accompanying hadron shower. ,111111The integration over the reconstructed (measured) neutrino energy is done from the threshold energy (taken as 1.5 GeV in this paper) to infinity., is the detector energy resolution function121212 We assume a Gaussian resolution function with ., is the maximum energy of the neutrinos for a given Lorentz factor (given by Eq. (3)) and is the oscillation probability. The expression for the signal in the detector from a -beam flux is given by replacing by , by and by . For the neutrino-nucleon interaction we consider quasi-elastic scattering, single-pion production and deep inelastic scattering and use the cross sections given in the Globes package [46] which are taken from [47, 48].
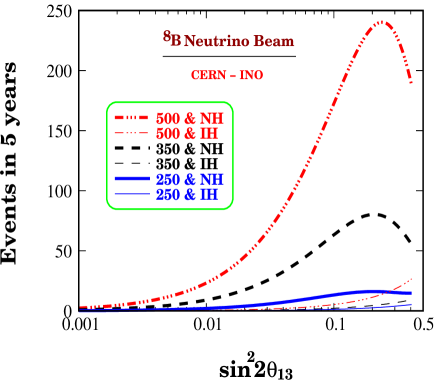
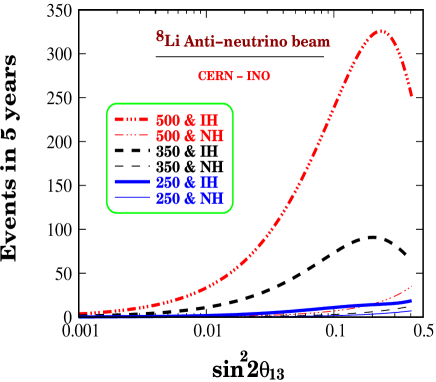
We show in Fig. 5 the number of events expected in INO-ICAL from 5 years exposure of an (for , shown in the left-hand panel) or (for , shown in the right-hand panel) -beam from CERN. The expected number of events is presented as a function of for both normal (NH) and inverted (IH) hierarchy for three benchmark values of the boost factor . Large resonant matter effects in the neutrino channel for normal hierarchy drives the number of expected events to very large values, compared to what would be expected for inverted hierarchy. Similarly, in the antineutrino channel we have resonant matter effects for inverted hierarchy and the number of predicted events is many times larger than for normal hierarchy131313In fact, matter effects are seen to suppress the oscillation probability for neutrinos (antineutrinos) compared to that in vacuum when the hierarchy is inverted (normal). . This difference in the number of events is seen to increase with up to a certain (large) value, beyond which it starts to decrease. This limiting value of at which the number of events in the neutrino (antineutrino) channel peaks for the normal (inverted) hierarchy comes from an interplay of two effects which we now discuss. In the approximation where can be neglected, the probability would be largest if the mixing angle in matter () and the mass squared difference driven oscillatory term in matter () are maximum simultaneously. In other words, largest matter effects come when the resonance energy is almost equal to the energy at which the oscillatory factor goes to one [49, 50, 51]. For a given (and hence matter density, ), one can calculate the value of for which this condition can be satisfied and it is given by [50, 51]
| (17) |
For km, it turns out that this value is . Therefore, matter effects and hence the event rate in the detector keeps increasing until this value of is reached. Beyond this limiting value of , effect of earth matter in falls and the event rate for the neutrinos, for normal hierarchy, and antineutrinos, for inverted hierarchy, decreases. However, note that this value of is already disfavored from the CHOOZ data [6, 7].
From the left-hand panel of Fig. 5 we note that for and , the predicted number of neutrino events for normal hierarchy is 101, while that for inverted hierarchy is only 3. This implies that if the normal hierarchy was true, we could comprehensively rule out the wrong inverted hierarchy. For smaller boost factors , the difference between the number of events decreases; however, we could still determine the neutrino mass hierarchy if (true) is not very small. We will perform a statistical analysis of projected data in the following sections and present our results on the hierarchy sensitivity in section 7. Instead of the neutrino, one could work with the -beam and achieve similar sensitivity to the neutrino mass hierarchy. Note that while the interaction cross section for the s are much smaller, the flux itself is larger owing to the (assumed) larger number of decays per year for . Thus the statistics expected in both the neutrino as well as the antineutrino channel is comparable and, as we will see, the hierarchy sensitivities for the and -beam are hence similar.
As discussed above, resonant matter effects in the neutrino (antineutrino) channel for the normal (inverted) hierarchy, results in substantial enhancement in the observed number of events. In particular, we note from Fig. 5 that the number of events in the near-resonant channels depend strongly on the value of , since the extent of matter effects is dictated directly by . We can see from the figure that the dependence of the event rate on is much enhanced due to matter effects. Therefore, if the true hierarchy was normal (inverted), we could use the neutrino (antineutrino) -beam in the proposed experiment to measure/constrain the mixing angle .
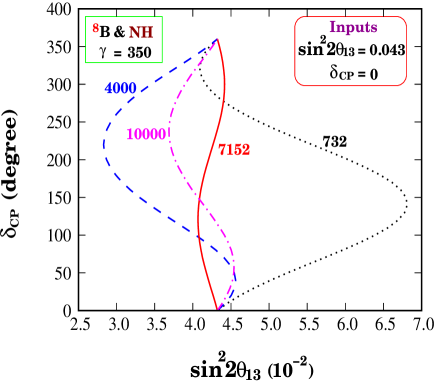
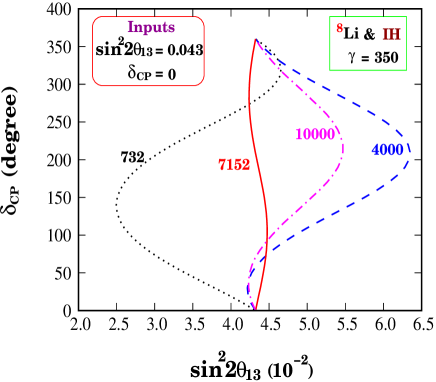
In Fig. 6 we show the effect of on the variation of the measured rate with the value of the mixing angle , for four different baselines 732 km, 4000 km, 7152 km and 10000 km. The left-hand panel shows the results for the -beam assuming a normal mass hierarchy, while the right-hand panel gives the same for the -beam flux with inverted hierarchy. For all cases in any panel, we have considered a 50 kton magnetized iron calorimeter as the far detector and the same flux created at the source. Each curve gives the sets of values of which give the same observed rate in the detector as the set . In other words, if the true value of and were 0.04 and respectively, then every point on a given curve would also be a solution for that experiment. It is clear from this figure that combining results from experiments at different baselines helps solve/reduce the problem. However, the most important issue exemplified here is the fact that for the baseline 7152 km, which is the CERN-INO distance, the effect of the unknown value of on the measurement of and the mass hierarchy, is very small. This happens because this distance corresponds to a near-magic baseline for which, as noted earlier, the dependent terms are almost vanishing.
4.3 Backgrounds
The possible backgrounds in a -beam experiment141414The discussion concerning the -beam is similar and hence is not repeated here. using as an oscillation signal come from neutral current events such as
| (18) | |||||
| (19) |
and charged current events
| (20) | |||||
| (21) |
The quarks in the final state could produce mesons as a part of the hadronic junk. These mesons may then decay producing secondary muons, giving rise to a signal which might constitute a possible background.
As discussed earlier, INO-ICAL will have 6 cm thick iron plates. Such a dense tracking detector will have excellent muon/pion and muon/electron separation capability in the energy range we are working with. The simulations carried out by the INO collaboration have shown that after the standard kinematical cuts are imposed, the electrons do not give any signal at all, while in 99% of the cases, the pions and kaons get absorbed very quickly in the iron for the energy range of interest to us and therefore do not hit enough RPCs to give a signal. At the energies of the -beams considered here, production cross section of mesons (also Cabibbo suppressed) is small and they do not constitute a problem for the experiment. The associated strange or charm production is also highly suppressed at these energies. In addition, the fact that the detector will have a charge identification capability means that secondary produced can be safely discarded, reducing the background even further. Therefore, in this analysis we do not consider any backgrounds coming from either the neutral current events or charged current events of 151515Mesons produced in neutral current processes are degraded in energy. Note that backgrounds from these mesons are very important in the case of the neutrino factory. However, since our relevant energy range is lower, the mesons produced in each event are much lower in energy and hence can be easily rejected by putting suitable cuts. In our analysis we have assumed cuts that are stringent enough to completely reject these backgrounds..
Since the oscillation probability is about the same as that for , we expect almost as many arriving at the detector as . The produced through charged current interaction may decay producing secondary with a branching ratio of 17.36%. But, the threshold (3.5 GeV) is high and the production cross section suppressed compared to . So we do not expect any significant background from this source either. We have estimated the number of secondary muons produced from the component of the beam. For , we expect 0.008, 0.061 and 0.2 muon events per year respectively, for , 350 and 500. In addition, these secondary muons will be severely degraded in energy and therefore can be eliminated through energy cuts. We therefore neglect the backgrounds from this source as well.
5 Details of the Statistical Method
In order to quantify the sensitivity of this -beam experimental set-up to the mixing angle and , we perform a statistical analysis of the “data” generated in INO-ICAL, assuming certain true values of the parameters. Since the number of events expected in the detector might be very small, depending on how small the true value of is, we define a assuming Poissonian distribution for the error as,
| (22) |
In Eq. (22), is a set of oscillation parameters, is the observed number of events, while the systematic errors in the data and the theory are accounted for through the set of “pulls” , where runs over the different systematic uncertainties involved. The pulls are defined in such a way that the number of expected events, , corresponds to . is the number of events when the systematic errors are included in a manner such that the effect of the -th uncertainty at the level is picked up when :
| (23) |
In Eq. (23) has been expanded in powers of , keeping only linear terms. The quantities give the fractional rate of change of due to the th systematic error. In our analysis, we include systematic uncertainties in the normalization of the -beam flux at the source, the error in the cross section and the detector systematic uncertainty. For the flux normalization error we adopt a total uncertainty of 2%. The neutrino-nucleon cross sections, especially at large energies and for massive target nuclei, are known to have large uncertainties. We include a 10% error coming from the uncertainty in the interaction cross section. A total detector systematic uncertainty of 2% is also included. We do not include any systematic error related to the shape of the energy spectrum since we work only with the energy integrated total rates, for which such types of errors would be negligible.
Unless otherwise stated, the data are always generated at the benchmark values of the oscillation parameters , , , and given in Table 2. The true value of as well as will be allowed to change, since these are the parameters under study in this experimental set-up of interest. Throughout the paper we will use the notation as the true value of this parameter chosen by Nature, and as the fitted value. The data, simulated with the (assumed) true values of the oscillation parameters, are fitted by calculating for any set of values for the oscillation parameters. We next calculate the chi-square function for every possible , obtained by varying the oscillation parameters and . We first minimize this function with respect to the pulls . This (given by Eq. (22)) is next minimized with respect to all the oscillation parameters161616 In order to save computer time, we keep and fixed in our analysis. There is two-fold motivation for this approximation. Firstly, these parameters, especially , is expected to be measured with a high precision in the proposed solar and reactor neutrino experiments [52]. Secondly, since we are working at a near-magic baseline, we do not expect any significant impact of these parameters on our results., which are permitted to assume all allowed values in calculating .
It is expected that the parameters and would be fairly well determined by the long baseline experiments T2K [53] and NOA [54]. In order to take into account this information, which should be available by the time the -beam facility comes up at CERN, we add to our the “prior” function such that
| (24) |
| (25) |
where and (true) are taken as the benchmark values in Table 2. We will assume that the error on these parameters would be reduced to and [55]. We minimize the total function with respect to the oscillation parameters and present the C.L. results assuming as a convention that corresponds to
| (26) |
where is the minimum obtained in the analysis for a given value of the parameter and/or the mass hierarchy.
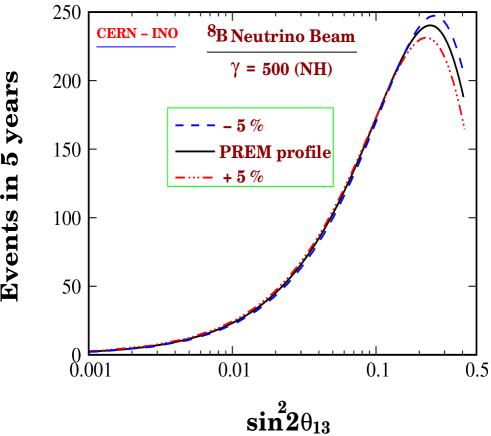
Note that we have not taken into account any error coming from the uncertainty in the matter density. Fig. 7 shows our justification for this. This figure shows the expected event rate for the -beam as a function of . The solid curve corresponds to the PREM profile, while the dashed and dot-dashed curves are for PREM densities scaled by -5% and +5% respectively. We can see that the effect of the 5% uncertainty in the matter density profile shows up in the event rate only for values of already disfavored by the CHOOZ experiment. In particular, we note that for the effect of the matter density uncertainty is negligible.
6 Determining
We begin by presenting results on how well can be determined by the set-up we are proposing. We divide our results into two subcategories. First we assume that (true) and expound the possibility of improving the upper bound on this parameter. This is what we would call the sensitivity of the experiment to . Next we will assume that (true) is large enough to give a positive signal in the experiment. In that case, we will probe quantitatively how precisely this parameter could then be determined. All results are presented after marginalizing over , , and , as described in section 5.
6.1 Sensitivity to
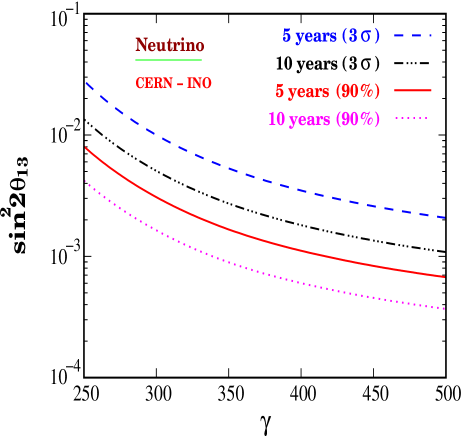
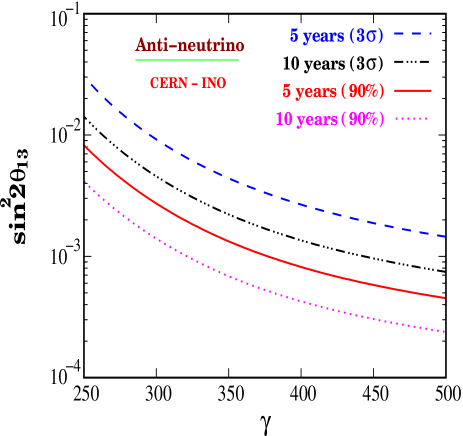
We define the sensitivity to as the minimum value of which this experiment would be able to distinguish from . The results of our analysis are presented in Fig. 8, where we show the upper bounds on that this experiment can impose at the 90% C.L. (solid curve for 5 years running and dotted curve for 10 years running) and C.L. (long dashed curve for 5 years running and dashed-dotted curve for 10 years running). The left-hand panel is for a -beam assuming that normal hierarchy is the true hierarchy, while the right-hand panel is for an -beam with the assumption that the inverted hierarchy is true. We show our results as a function of the Lorentz boost . The 90% and C.L. upper bounds that we can impose on are displayed in Table 4 for the three benchmark values of and with five and ten years of running of the experiment in the neutrino (columns 3 and 4) and in the antineutrino (columns 5 and 6) mode. In the Table we show the sensitivity limits for the conservative detector efficiency of 60% for as well as for 80% efficiency.
| Neutrino Beam (NH true) | Anti-neutrino Beam (IH true) | |||||
| Detection | Years | 90% C.L. | C.L. | 90% C.L. | C.L. | |
| Efficiency | ||||||
| 60% | 250 | |||||
| 5 years | 350 | |||||
| 500 | ||||||
| 250 | ||||||
| 10 years | 350 | |||||
| 500 | ||||||
| 80% | 250 | |||||
| 5 years | 350 | |||||
| 500 | ||||||
| 250 | ||||||
| 10 years | 350 | |||||
| 500 | ||||||
This can be compared with the sensitivity we expect from the other forthcoming/planned experiments. At the 90% C.L., the T2K and NOA experiments are expected to constrain and respectively [55]. The Double-Chooz experiment is likely to push the limit down to at 90% C.L., which could be improved to by the Reactor-II set-up [55]. The “discovery potential”171717The authors define the “discovery potential” as the minimum value of (true) for which gives a . of the CERN-MEMPHYS project for five years of running of both the -beam and the SPL super-beam set-ups considered alone is at [42]. With a combined data set in MEMPHYS for five years running in -beam and five years in the SPL super-beam, the discovery limit could be improved to at [42]. The best limit, obtained after a thorough optimization of the -beam experimental options for the sensitivity reach in [56] (see also [57]), is at , for what the authors label as set-up 1181818This corresponds to successive 8 year runs of a -beam in the neutrino and antineutrino mode (total 16 years) with , km and a water C̆erenkov detector with 500 kton fiducial mass. and set-up 2191919This corresponds to successive 8 year runs of a -beam in the neutrino and antineutrino mode (total 16 years) with , km and 50 kton of totally active scintillator detector.. Therefore, for the experimental set-up with the -beam source in CERN and INO-ICAL as the far detector the projected sensitivity is comparable to, if not better, than most of the other planned schemes. In fact, the sensitivity reach of this experiment is even better than that expected for an entry level Neutrino Factory (NuFact-I) [58]. Only a NuFact-II with km [19] corresponding to the magic baseline, could give a sensitivity significantly better than what one can achieve with the CERN-INO -beam set-up [19, 21].
We reiterate that the tremendous sensitivity of the CERN-INO -beam set-up comes not really from high -beam flux, but from the fact that one has near-resonant matter effects at the near-magic baseline. While the latter feature smothers the problems arising from clone solutions, the former lends the experiment an extra sensitivity due to the dependence of matter effects on . This is why the sensitivity depends on the true hierarchy. We have checked that if we run the experiment for 10 years in the neutrino mode alone and with inverted hierarchy assumed as true, then the sensitivity we expect is a meagre at the 90% C.L. Therefore, a hierarchy independent sensitivity can in principle be obtained after runs in both the neutrino and the antineutrino mode, unless one is very lucky. We will return to this issue again in section 8.
6.2 Precision in measurement of
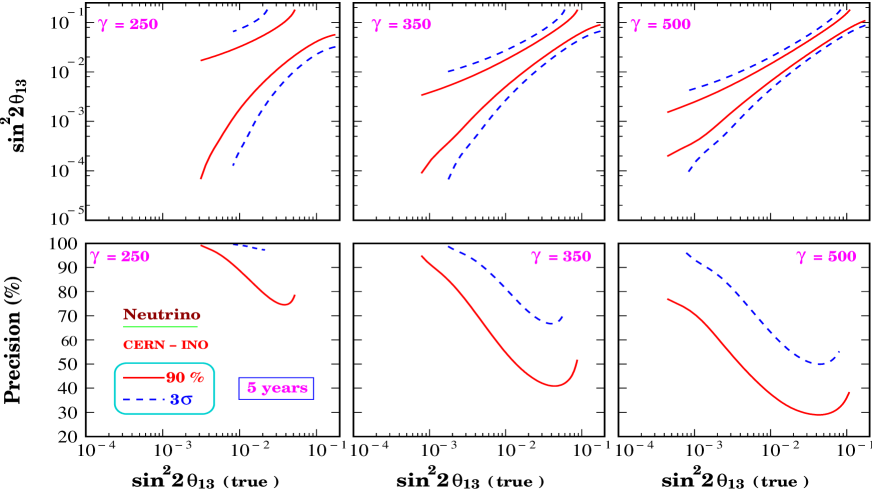
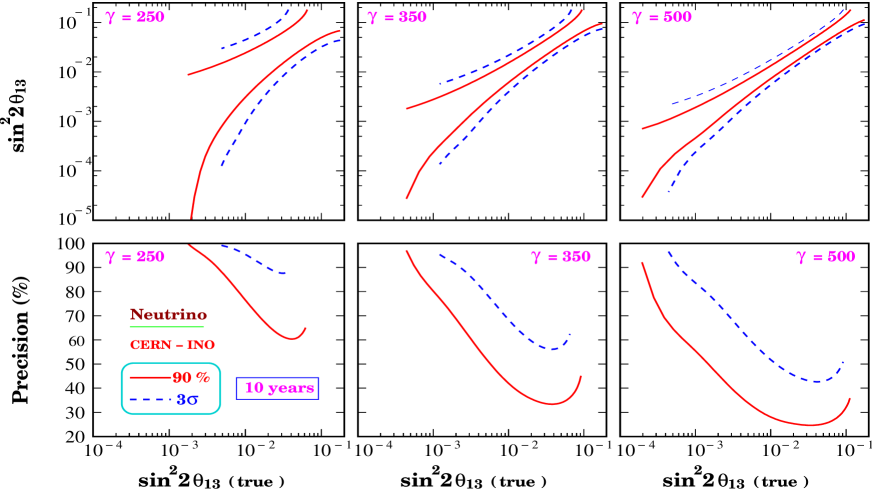
In this subsection we assume that (true) is large enough such that, for a given boost , we have a positive signal in the ICAL detector. For each value of (true), varied between the limiting value obtained in the previous subsection and the current upper limit, we generate the data and fit it back using the analysis to give us the range of “measured” values of . We plot in the upper panels of Figs. 10 and 10, the 90% and C.L. bands of as a function of (true) for 5 years and 10 years run respectively. The left, middle and right-hand panels are for , 350 and 500, respectively. Plots are shown for the -beam assuming normal hierarchy as true. In order to quantify the precision which can be obtained on , we define, for any value of (true),
| (27) |
where and are respectively the largest and smallest values of allowed at the given C.L. We show in the lower panels of Figs. 10 and 10, the variation of this precision function with (true) for the 90% and C.L. for 5 years and 10 years of running respectively, in the neutrino channel assuming normal hierarchy. Similar results are expected if we run the experiment in the antineutrino mode for inverted hierarchy.
As expected, the precision in the measurement improves as increases. However, a very interesting feature in the plots of Fig. 10 is the emergence of minima in the precision, thereby implying that for values of (true) beyond this limiting value, the precision actually deteriorates.
7 Sensitivity to
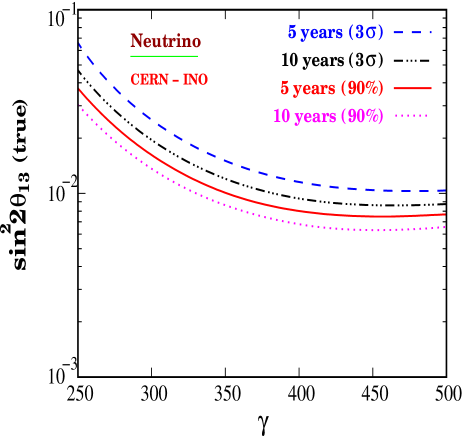
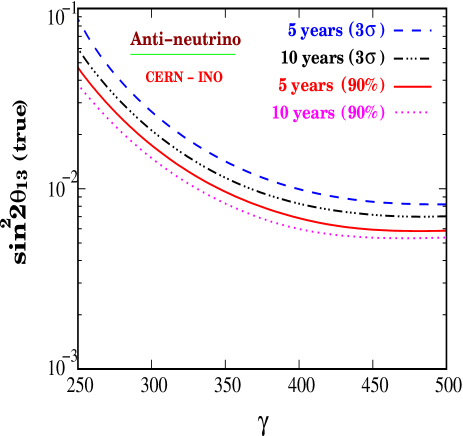
We next turn our attention to the determination of the neutrino mass hierarchy. If the true value of has indeed been chosen to be large by Nature, we can expect sizable matter effects in this experimental set-up, giving us a handle on the mass hierarchy. In our analysis, we assume a certain true mass hierarchy and generate the prospective data in INO-ICAL for the benchmark oscillation parameter values given in Table 2 and for different values of . We next fit this data with the wrong hierarchy and calculate a , after marginalizing over , , as well as , as described in section 5. The results of this analysis are presented in Fig. 11. The figure shows, as a function of , the minimum value of (true) for which the wrong hierarchy can be disfavored at the 90% C.L. (solid curve for 5 years running and dotted curve for 10 years running) and C.L. (long dashed curve for 5 years running and dashed-dotted curve for 10 years running). The left-hand panel is for a -beam and assuming that normal hierarchy is the true hierarchy, while the right-hand panel is for an -beam with the assumption that the inverted hierarchy is true. Of course, since large matter effects appear in only either the neutrino or the antineutrino channel for a given hierarchy, the sensitivity of the experiment to would be zero if we used a beam when the true hierarchy was normal or an beam when the true hierarchy was inverted.
| Neutrino Beam (NH true) | Anti-neutrino Beam (IH true) | |||||
| Detection | Years | 90% C.L. | C.L. | 90% C.L. | C.L. | |
| Efficiency | ||||||
| 60% | 250 | |||||
| 5 years | 350 | |||||
| 500 | ||||||
| 250 | ||||||
| 10 years | 350 | |||||
| 500 | ||||||
| 80% | 250 | |||||
| 5 years | 350 | |||||
| 500 | ||||||
| 250 | ||||||
| 10 years | 350 | |||||
| 500 | ||||||
In Table 5 we show the limiting values of (true), for which the wrong hierarchy can be disfavored at the 90% and C.L. for three specific values of . We show the results for 5 years and 10 years of running of the experiment in the neutrino and the antineutrino mode. Table 5 shows the results for both 60% and 80% detection efficiency. This can be directly compared with the expected potential of the other planned/proposed long baseline experiments in discriminating between the right and the wrong hierarchy. The T2K experiment [53] has a baseline of only 295 km which entails almost negligible matter effects. The NOA experiment [54] on its own might find it hard to say anything conclusive about the neutrino mass hierarchy, unless Nature conspires to arrange oscillation parameters in a conducive way. The so-called T2KK experimental set-up with the 4 MW beam from the JPARC facility and two detectors, one in Japan and another in Korea [35]202020For an alternate T2KK proposal, see [36]., is expected to rule out the wrong hierarchy at the C.L. if for a total of 8 years of running, 4 years in the and 4 years in the mode. The CERN-MEMPHYS -beam and SPL superbeam proposals [42] again concern a baseline of only 130 km, which is too short to enable these beam experiments to decipher the mass hierarchy on their own. A higher -beam from CERN to (say) Gran Sasso, with a baseline of 732 km could have sensitivity to the mass hierarchy [24, 57]. It was shown in [56] that for and km, the wrong hierarchy could be disfavored at C.L. if after 8 years of simultaneous running in the neutrino and antineutrino mode and with a 500 kton water detector. Therefore we see that our sensitivity to the neutrino mass hierarchy can be well surpassed only by a Neutrino Factory, where the right normal hierarchy could be determined at C.L. for , if the experiment is done at the magic baseline km.
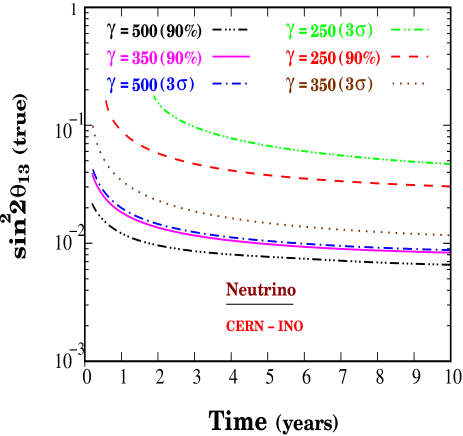
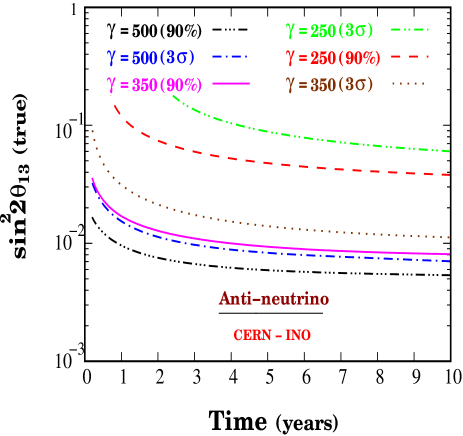
In Fig. 12 we show the minimum as a function of the running time T (in years) needed in this experimental set-up to discriminate between the wrong and the right hierarchy at the 90% and C.L. The left-hand panel is for a run in the mode with true normal hierarchy, while the right-hand panel shows the results for running in the mode with true inverted hierarchy. We show the results for the three chosen values of . We see, for example, that if and the normal hierarchy was true, then the wrong inverted hierarchy could be disfavored at the C.L. after just 9 (26) months of running in the mode with (350).
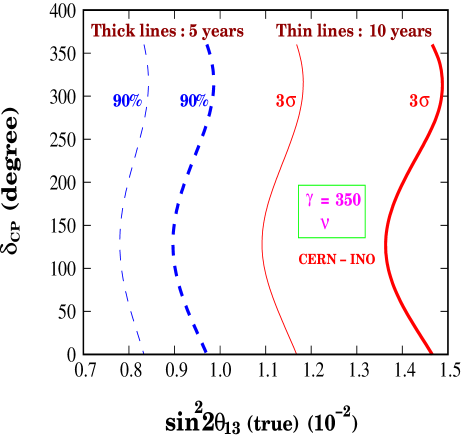
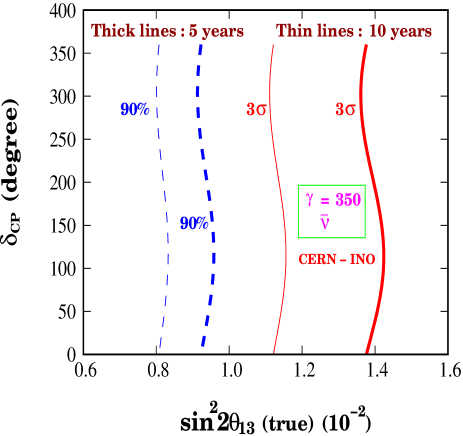
Fig. 13 shows the impact of on the hierarchy sensitivity of this experiment. The left-hand panel is for the neutrino channel with normal hierarchy as true, while the right-hand panel is for the antineutrino channel with inverted hierarchy as true. We show the 90% (dashed curves) and (solid curves) C.L. curves for 5 years (thick lines) and 10 years (thin lines) running of the -beam with . We note that loss in hierarchy sensitivity due to the uncertainty in is very marginal, owing to the fact that we are proposing this set-up at a near-magic baseline. The best sensitivity to hierarchy comes for in the neutrino mode and in the antineutrino mode.
8 Running the and -Beam Simultaneously
An exquisite feature of magnetized iron detectors is their charge identification capability. Thus, if both the and the -beam were produced simultaneously at CERN, the oscillated could be measured distinctly from the oscillated at INO212121The and -beam fluxes could be produced in distinct bunches from the storage ring. Therefore, in principle, it should be straight-forward to distinguish the neutrino from the antineutrino events at any detector using the nano-second time resolution that most detectors possess. However, since ICAL will be magnetized, it could directly distinguish between the two channels irrespective of the timing information.. Since near-resonant matter effects appear only in either the neutrino or the antineutrino channel, this gives the experiment an added edge to unravel both the mass hierarchy as well as simultaneously, within a much shorter time. The argument goes as follows.
Throughout the paper so far, we had been tacitly working in a scenario where we have just one type of -beam from CERN and the hierarchy was conducive to having large matter effect, the key behind the excellent as well as mass hierarchy sensitivity. However, we have to bear in mind that in the absence of any prior knowledge of the true value of and/or the mass hierarchy, one would not know which of the two modes – neutrino or the antineutrino – would be preferable for extracting maximal matter effects. With luck, it might so happen that the beam is run in the neutrino mode first and the true hierarchy turns out to be normal and not too small. In that case, we would see large number of events in the detector and know without ambiguity both the mass hierarchy as well as the value of . However, if the experiment is run in say only, the neutrino mode and if we do not see enough number of events (as expected from large matter effects), it would be difficult to tell if the non-observation should be attributed to the true hierarchy being inverted or whether the mixing angle is very small. We would find ourselves in a similar impasse if a -beam is used and one observed a very small number of events. This deadlock would then be broken only if we run the -beam in both the neutrino and the antineutrino mode.
Recall that a -beam facility has the useful feature that it can be operated simultaneously in the as well as mode, since both the and ions are positively charged, and therefore move in the same direction in the storage ring. The only constraint is that, since the magnetic field would be the same for both channels, the different charge-to-mass ratio for the two candidate ions would fix the boost for the antineutrino channel to be 0.6 times that in the neutrino channel. Therefore, we could work within a set-up where we have simultaneous and beams with say and 300 respectively for the two channels. Since INO-ICAL would have excellent charge identification capability, it would distinguish the produced from oscillated and produced from oscillated , when the and beams are run simultaneously. In this scenario, unless is extremely small, we would observe an enhancement in the number of events due to earth matter effects in one of the channels, irrespective of the true mass hierarchy. Therefore, a direct comparison of the number of and events would immediately tell us the mass hierarchy for not small. If the true value of is indeed chosen to be very small by Nature, then we would see no enhancement in the event rate in either the neutrino or the antineutrino channel and one would be able to place an upper limit on the value of unambiguously.
We have checked that with and beams running simultaneously with and 300 respectively for the two channels, we could obtain a sensitivity of at , irrespective of the true mass hierarchy, after 10 years of running. We would have sensitivity to the neutrino mass hierarchy for at least at after 10 years of simultaneous running, again irrespective of whether the true hierarchy was normal or inverted. One could argue that running the beam successively with , first in the mode followed by the mode would give an unambiguous sensitivity limit of at and the mass hierarchy sensitivity limit of at . However, note that it is not possible to run the beam with the same as the beam without any accelerator upgrade. Running the -beam simultaneously in both polarities has the additional advantage that if is indeed large in Nature and within reach of the CERN-INO -beam set-up, then one would have a surplus of either or events in INO-ICAL. This would directly tell us the neutrino mass hierarchy unambiguously.
9 Conclusions
We explored the physics potential of an experimental program with the -beam source ( or ) at CERN and a 50 kton magnetized iron detector at INO. The CERN-INO distance is very close to the magic baseline, which is ideal for performing a degeneracy-free measurement of the mixing angle and the neutrino mass hierarchy. The large baseline also opens up the possibility for large matter effects. For the CERN-INO baseline, the largest earth effects corresponding to resonant conversion of (anti)neutrinos in matter, happen for (anti)neutrino energy of GeV. or produced at these energies through oscillations can be effectively detected in magnetized iron calorimeters via the they produce, the detection energy threshold being about 1 GeV. For the most common ions used in -beam studies, this range of (anti)neutrino energies can be achieved for Lorentz factor . In this paper we have considered the new possibility of using the and as source ions for and -beam respectively. Owing to the large end-point energy of these ions, the resultant energy spectrum of the Lorentz boosted -beam for these ions is harder by more than a factor of 3, compared to the standard alternative ions and . Therefore, with these ions we would get a -beam flux peaked at about 6 GeV, for plausible values of the Lorentz boost in the range 250-500. We showed that for this -beam flux from CERN, it will be possible to get an essentially background free measurement of the “golden channel” probability , through observation of (or ) events in the ICAL detector at INO. We argued that the number of events in this experimental set-up is dictated directly by the extent of near-resonant earth matter effect, which significantly enhances the transition probability . The extent of earth matter effect in turn is governed by the neutrino mass hierarchy and the value of . The CERN-INO -beam experiment that we propose therefore emerges as a powerful tool to pin down the neutrino mass hierarchy and .
We simulated the prospective data in this experimental set-up for 5 years and 10 years of running of the -beam in either the neutrino or the antineutrino mode and presented the sensitivity results from a rigorous analysis, after marginalizing over all the oscillation parameters and taking into account the systematic uncertainties coming from the -beam source, the detector, as well as the theoretical calculation of the interaction cross sections. For =500, if true value of was zero, this experiment with 60% detection efficiency and 5 years of running would put a limit of () at C.L. with the () -beam for the normal (inverted) mass hierarchy. With 80% detection efficiency and 10 years of running the corresponding limits would be () at C.L. with the () -beam for the normal (inverted) mass hierarchy. With 60% detection efficiency and 5 years of running the wrong hierarchy could be ruled out at the C.L. if () with the () -beam for the true normal (inverted) mass hierarchy. If the detection efficiency was 80% and running period 10 years the corresponding sensitivity would be enhanced to () respectively at the C.L. We showed that if , and the true hierarchy was normal, then the inverted hierarchy could be disfavored at C.L. with a -beam within just 9 months of running. Finally, we considered the scenario where the and flux could be produced simultaneously at the CERN -beam facility. Since ICAL at INO would be magnetized and hence would possess charge identification capability, we argued that an unambiguous information on and the mass hierarchy could be obtained within a much shorter time scale if is large. If is very small, one would not be able to determine the mass hierarchy, but could still save time in putting an upper bound on the mixing angle .
In conclusion, the sensitivity for and the neutrino mass hierarchy that is expected in the CERN-INO -beam experiment appears to be better than most of the other experimental proposals involving superbeams and -beam and can only be surpassed by the NuFact-II experiment.
Acknowledgements The authors acknowledge help from the INO collaboration and thank F. Terranova for a useful communication. S.K.A. is grateful to Abhijit Samanta for discussions. S.C. wishes to thank Walter Winter, Andrea Donini and Pasquale Migliozzi for helpful discussions. S.C. acknowledges support from the University of Oxford and PPARC during the initial part of this work.
References
- [1] B. T. Cleveland et al., Astrophys. J. 496, 505 (1998); J. N. Abdurashitov et al. [SAGE Collaboration], J. Exp. Theor. Phys. 95, 181 (2002) [Zh. Eksp. Teor. Fiz. 122, 211 (2002)]; W. Hampel et al. [GALLEX Collaboration], Phys. Lett. B 447, 127 (1999); S. Fukuda et al. [Super-Kamiokande Collaboration], Phys. Lett. B 539, 179 (2002); B. Aharmim et al. [SNO Collaboration], Phys. Rev. C 72, 055502 (2005).
- [2] Y. Ashie et al. [Super-Kamiokande Collaboration], Phys. Rev. D 71, 112005 (2005).
- [3] K. Eguchi et al., [KamLAND Collaboration], Phys.Rev.Lett.90 (2003) 021802; T. Araki et al. [KamLAND Collaboration], Phys. Rev. Lett. 94, 081801 (2005).
- [4] E. Aliu et al. [K2K Collaboration], Phys. Rev. Lett. 94, 081802 (2005).
- [5] D. G. Michael et al., [MINOS Collaboration], arXiv:hep-ex/0607088.
- [6] M. Apollonio et al., Eur. Phys. J. C 27, 331 (2003).
- [7] M. Maltoni et al., New J. Phys. 6, 122 (2004), hep-ph/0405172 v5; S. Choubey, arXiv:hep-ph/0509217; S. Goswami, Int. J. Mod. Phys. A 21, 1901 (2006); A. Bandyopadhyay et al., Phys. Lett. B 608, 115 (2005); G. L. Fogli et al., Prog. Part. Nucl. Phys. 57, 742 (2006).
- [8] L. Wolfenstein, Phys. Rev. D 17, 2369 (1978);
- [9] S. P. Mikheev and A. Y. Smirnov, Sov. J. Nucl. Phys. 42, 913 (1985) [Yad. Fiz. 42, 1441 (1985)]; S. P. Mikheev and A. Y. Smirnov, Nuovo Cim. C 9, 17 (1986).
- [10] V. D. Barger, K. Whisnant, S. Pakvasa and R. J. N. Phillips, Phys. Rev. D 22, 2718 (1980).
- [11] A. Cervera et al., Nucl. Phys. B 579, 17 (2000) [Erratum-ibid. B 593, 731 (2001)].
- [12] P. Zucchelli, Phys. Lett. B 532, 166 (2002).
- [13] http://www.hep.ph.ic.ac.uk/iss/
-
[14]
M. S. Athar et al. [INO Collaboration],
A Report of the INO Feasibility Study,
http://www.imsc.res.in/ ino/OpenReports/INOReport.pdf - [15] J. Burguet-Castell et al., Nucl. Phys. B 608, 301 (2001).
- [16] H. Minakata and H. Nunokawa, JHEP 0110, 001 (2001).
- [17] G. L. Fogli and E. Lisi, Phys. Rev. D 54, 3667 (1996).
- [18] V. Barger, D. Marfatia and K. Whisnant, Phys. Rev. D 65, 073023 (2002).
- [19] P. Huber and W. Winter, Phys. Rev. D 68, 037301 (2003).
- [20] A. Y. Smirnov, arXiv:hep-ph/0610198.
- [21] P. Huber, M. Lindner, M. Rolinec and W. Winter, Phys. Rev. D 74, 073003 (2006).
- [22] S. K. Agarwalla, A. Raychaudhuri and A. Samanta, Phys. Lett. B 629, 33 (2005).
- [23] C. Rubbia, A. Ferrari, Y. Kadi and V. Vlachoudis, Nucl. Instrum. Meth. A 568, 475 (2006); C. Rubbia, arXiv:hep-ph/0609235.
- [24] A. Donini and E. Fernandez-Martinez, Phys. Lett. B 641, 432 (2006).
- [25] R. Adhikari, S. K. Agarwalla and A. Raychaudhuri, Phys. Lett. B 642, 111 (2006). S. K. Agarwalla, S. Rakshit and A. Raychaudhuri, arXiv:hep-ph/0609252.
- [26] For a recent review see C. Volpe, J. Phys. G 34, R1 (2007).
- [27] J. Bouchez, M. Lindroos and M. Mezzetto, AIP Conf. Proc. 721, 37 (2004).
- [28] B. Autin et al., J. Phys. G 29, 1785 (2003).
-
[29]
L. P. Ekstrom and R. B. Firestone, WWW Table of Radioactive Isotopes,
database version 2/28/99 from URL http://ie.lbl.gov/toi/ - [30] J. Burget-Castell et al., Nucl. Phys. B 695, 217 (2004).
- [31] A. Donini et al., arXiv:hep-ph/0511134; A. Donini et al., arXiv:hep-ph/0604229.
- [32] M. Freund, P. Huber and M. Lindner, Nucl. Phys. B 615, 331 (2001).
- [33] W. Winter, Phys. Lett. B 613, 67 (2005).
- [34] H. Minakata, H. Nunokawa and S. J. Parke, Phys. Rev. D 68, 013010 (2003); P. Huber, M. Lindner and W. Winter, Nucl. Phys. B 654, 3 (2003); O. Mena and S. J. Parke, Phys. Rev. D 70, 093011 (2004); O. Mena, H. Nunokawa and S. J. Parke, arXiv:hep-ph/0609011.
- [35] M. Ishitsuka et al., Phys. Rev. D 72, 033003 (2005).
- [36] K. Hagiwara, N. Okamura and K. i. Senda, Phys. Lett. B 637, 266 (2006) [Erratum-ibid. B 641, 486 (2006)]; K. Hagiwara, N. Okamura and K-i. Senda, arXiv:hep-ph/0607255.
- [37] O. Mena Requejo, S. Palomares-Ruiz and S. Pascoli, Phys. Rev. D 72, 053002 (2005); O. Mena, S. Palomares-Ruiz and S. Pascoli, Phys. Rev. D 73, 073007 (2006).
- [38] H. Minakata and H. Nunokawa, Phys. Lett. B 413, 369 (1997) J. Burguet-Castell et al., Nucl. Phys. B 608, 301 (2001). V. Barger, D. Marfatia and K. Whisnant, Phys. Lett. B 560, 75 (2003); V. Barger, D. Marfatia and K. Whisnant, Phys. Rev. D 66, 053007 (2002).
- [39] D. Autiero et al., Eur. Phys. J. C 33, 243 (2004); A. Donini, D. Meloni and P. Migliozzi, Nucl. Phys. B 646, 321 (2002).
- [40] A. Bueno, M. Campanelli, S. Navas-Concha and A. Rubbia, Nucl. Phys. B 631, 239 (2002).
- [41] P. Huber, M. Maltoni and T. Schwetz, Phys. Rev. D 71, 053006 (2005).
- [42] J. E. Campagne, M. Maltoni, M. Mezzetto and T. Schwetz, arXiv:hep-ph/0603172.
- [43] P. Huber, M. Lindner, T. Schwetz and W. Winter, Nucl. Phys. B 665, 487 (2003).
-
[44]
A. M. Dziewonski and D. L. Anderson,
Phys. Earth Planet. Interiors 25, 297 (1981);
S. V. Panasyuk, Reference Earth Model (REM) webpage,
http://cfauves5.harvrd.edu/lana/rem/index.html. - [45] A. Takamura and K. Kimura, JHEP 0601, 053 (2006).
- [46] P. Huber, M. Lindner and W. Winter, Comput. Phys. Commun. 167, 195 (2005).
- [47] M. D. Messier, PhD thesis, UMI-99-23965.
- [48] E. A. Paschos and J. Y. Yu, Phys. Rev. D 65, 033002 (2002).
- [49] M. C. Banuls, G. Barenboim and J. Bernabeu, Phys. Lett. B 513, 391 (2001).
- [50] R. Gandhi, P. Ghoshal, S. Goswami, P. Mehta and S. Uma Sankar, Phys. Rev. Lett. 94, 051801 (2005).
- [51] R. Gandhi, P. Ghoshal, S. Goswami, P. Mehta and S. Uma Sankar, Phys. Rev. D 73, 053001 (2006).
- [52] See for example, A. Bandyopadhyay et al., Phys. Rev. D 72, 033013 (2005); J. N. Bahcall and C. Pena-Garay, JHEP 0311, 004 (2003).
- [53] Y. Itow et al., arXiv:hep-ex/0106019.
- [54] D. S. Ayres et al. [NOvA Collaboration], arXiv:hep-ex/0503053.
- [55] P. Huber et al., Phys. Rev. D 70, 073014 (2004).
- [56] P. Huber, M. Lindner, M. Rolinec and W. Winter, Phys. Rev. D 73, 053002 (2006).
- [57] J. Burguet-Castell, D. Casper, E. Couce, J. J. Gomez-Cadenas and P. Hernandez, Nucl. Phys. B 725, 306 (2005).
- [58] P. Huber, M. Lindner and W. Winter, Nucl. Phys. B 645, 3 (2002).