EFI 06-22
TECHNION-PH-2006-17
hep-ph/0610227
October 2006
SUM RULE FOR RATE AND CP ASYMMETRY IN
Michael Gronaua and Jonathan L. Rosnerb
aPhysics Department, Technion – Israel Institute of Technology
32000 Haifa, Israel
bEnrico Fermi Institute and Department of Physics, University of Chicago
Chicago, Illinois 60637, USA
ABSTRACT
A sum rule relating the ratio and the CP asymmetry is proved to first order in the ratio of tree to penguin amplitudes. The sum rule explains why it is possible to have consistent with 1 together with a small CP asymmetry in . The measured ratio rules out a small strong phase difference between a color-suppressed and a color-favored tree amplitude contributing to as favored by QCD factorization.
PACS Categories:
Partial decay rates and CP asymmetries in decays have been mapped out with increasing accuracy thanks to high-statistics studies by the BaBar [1, 2, 3] and Belle [4] Collaborations. The experimental situation for branching ratios and CP asymmetries is summarized in Table I [5, 6, 7], defining asymmetries by . These decays are dominated by an effective penguin amplitude, whose isospin-preserving property leads to the rate predictions for and decays,
| (1) |
Tests for non-penguin amplitudes are provided by useful CP-averaged ratios [8, 9, 10, 11],
| (2) |
where . We have converted ratios of branching ratios to ratios of rates in the first relation using the ratio of and lifetimes [5]. At this time none of the three measured ratios provides a statistically significant evidence for a small amplitude. Potental deviations from Eq. (1), providing evidence for such an amplitude, are not expected to lead to a violation of a more general isospin sum rule obeyed by the four decay rates [12, 13]. This sum rule which is obeyed in the Standard Model up to second order corrections of non-penguin amplitudes, holding also in the presence of first order isospin-breaking corrections [14], is equivalent to the relation [15].
Evidence for a non-penguin contribution and for a relative strong phase between it and the penguin amplitude is provided by the non-zero direct CP asymmetry . On the other hand, is consistent with zero, whereas one might have expected it to be equal to if only the penguin amplitude and a color-favored tree amplitude contributed to both processes [12]. In fact, obtains also a contribution from a color-suppressed tree amplitude [16]. There are now several arguments for to be large, comparable in magnitude to . The arguments include a global SU(3) fit to rates and asymmetries in and [17], two separate analyses of [18] and [19], and recent calculations within perturbative QCD [20] and QCD factorization [21]. A significant amplitude contributing in may lead to a net small and even positive CP asymmetry in this process if the interference terms of and with occur with opposite signs [22]. Instead of equal asymmetries in and one expects the leading terms in CP asymmetries to obey an isospin sum rule relating all four processes [23, 24], or three decay modes, if one uses the expectation that should be very small [25].
| Mode | ||
|---|---|---|
| [6, 7] |
A small asymmetry in implies bounds on the sine of the strong phase difference between and . The cosine of this phase affects the ratio involving the decay rates for and . The question we wish to study in this note is whether the two upper bounds on and , from and , respectively, are consistent with each other. A potential inconsistency would be evidence for New Physics. We will prove a sum rule involving both observables, in which an electroweak penguin amplitude plays an important role. It will be shown that thanks to a particular electroweak penguin contribution, the decay need not display any evidence of non-penguin amplitudes through its rate or its CP asymmetry. We will turn the argument around to update bounds on the weak phase using the current measurements of and . We will also study the ratio of asymmetries in terms of the strong phase difference between the amplitudes and , showing that the measured ratio excludes a small phase difference predicted by QCD factorization.
In order to prove the sum rule we write decay amplitudes in terms of topological contributions [16],
| (3) |
Color-favored and color-suppressed electroweak penguin contributions, and , are included by defining [26]
| (4) |
The annihilation amplitude can be safely neglected, as made evident by the small CP asymmetry measured in . (We are assuming that the strong phase difference between and is not very small, as a sizable would require rescattering.) A small quark contribution to the penguin amplitude involving a CKM factor is absorbed in and . In the standard phase convention [27] the amplitudes and involve a weak phase , while and carry a weak phase .
Flavor SU(3) symmetry relates electroweak penguin and tree amplitudes through a calculable ratio [10],
| (5) |
The error in is dominated by the current uncertainty in [27], including also a smaller error from SU(3) breaking estimated using QCD factorization. Eqs.(3) (4) and (S0.Ex3) imply [11]
| (6) |
| (7) |
where and is the strong phase difference between and .
The parameter is calculable in terms of measured decay rates, using flavor SU(3) and noting that the tree amplitude dominates with a CKM factor replacing in , up to negligible electroweak penguin contributions. Assuming factorization for this amplitude introduces a factor for SU(3) breaking, thus implying [28]
| (8) |
Using [5] and taking from Table I, one finds
| (9) |
The error in does not include an uncertainty from assuming factorization for SU(3) breaking in . While this assumption should hold well for , it may not be a good approximation for which is more susceptible to final state interactions. In fact, we will show below that the relative phase between and is not small, contrary to a factorization prediction. Thus one should allow a theoretical error when using factorization for relating and amplitudes, so that
| (10) |
Eliminating in Eqs. (6) and (7) by retaining terms which are linear in , one finds
| (11) |
The sum rule (11) implies that at least one of the two terms whose squares occur on the left-hand-side must be sizable, of the order of . The second term, , is already smaller than 0.13 for [29] and using the current upper bound, . This bound implies a small value for . The first term in (11) can saturate the sum rule with values of near 1 as long as is small. Since implies , this is easily arranged. Thus, we conclude that thanks to the electroweak penguin contribution, the decay need not display any evidence of non-penguin amplitudes through its rate or its CP asymmetry.
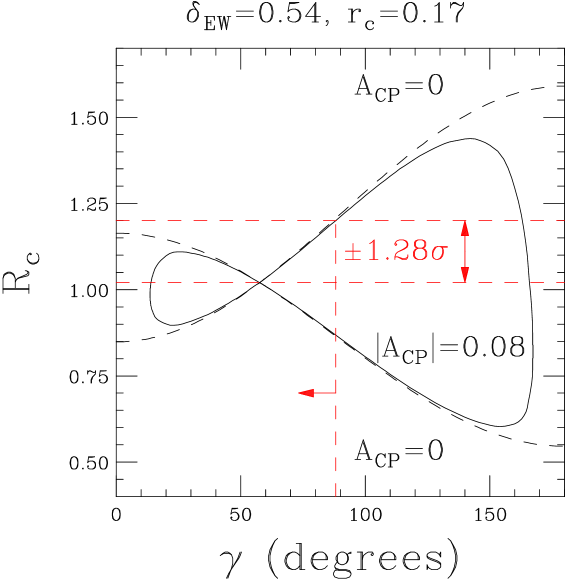
In principle one could use Eq. (11) to place a bound on . More precisely, the relations (6) and (7) correlate , , and [10, 11], as in the updated plot of Fig. 1. We show the correlation that gives the weakest upper bound on , which corresponds to the lowest values of and . Accordingly, we take the values and . We show the cases and which represents a 90% confidence level upper limit. Taking the 90% c.l. upper limit , one finds , which is consistent but not competitive with other bounds on [29].
Writing a first order expression in ,
| (12) |
we can now compare this asymmetry with the asymmetry in . The amplitude of this process [16, 26],
| (13) |
implies an asymmetry
| (14) |
where , and is the strong phase difference between and . We have neglected an interference of an electroweak penguin amplitude with which is higher order and a term which is quadratic in .
A comparison of Eqs. (12) and (14) with current measurements of the two asymmetries can shed some light on , the strong phase difference between the color-suppressed and color-favored tree amplitudes. An interesting question is whether this phase difference can be small. A small phase, no larger than , calculated in QCD factorization for in [30], would be a useful input for extracting the weak phase in these decays [31]. Assuming small SU(3) breaking in the phase, one does not expect a much larger phase in than in . We note that in contrast to QCD factorization, large negative values were obtained for the phase of in fits to and data [17, 19, 32].
Let us assume for a moment that the magnitude of the phase difference is smaller than , for which evidence of being nonzero and positive has been obtained in . [As an example, and correspond to .] Simple geometry shows that . That is, holds for . This implies that, if is positive and of arbitrary size or negative but smaller in magnitude than , the asymmetry in should be of the same sign (i.e. negative) and larger than the asymmetry in . This is excluded within by the measured asymmetries.
To conclude, we have proved a sum rule (11) which shows that one can have both near 1 and near zero in the presence of significant non-penguin amplitudes. The key feature of the sum rule is the approximate cancellation in between the real part of the ratio and an electroweak penguin contribution. We have used the measured asymmetries in and to show that the strong phase difference between the color-suppressed and color-favored tree amplitudes contributing to must be negative and cannot be very small.
We thank Martin Beneke, Harry Lipkin and Dan Pirjol for helpful comments. This work was supported in part by the Israel Science Foundation under Grant No. 1052/04, by the German-Israeli Foundation under Grant No. I-781-55.14/2003, and by the U. S. Department of Energy under Grant No. DE-FG02-90ER40560.
References
- [1] M. Bona, presented at ICHEP06, Moscow, USSR, July 26 – August 2, 2006.
- [2] E. Di Marco, arXiv:hep-ex/0610015, presented at XXXIII International Conference on High Energy Physics (ICHEP06), Moscow, USSR, July 26 – August 2, 2006.
- [3] B. Aubert al. [BABAR Collaboration], arXiv:hep-ex/0608036.
- [4] Y. Unno, presented at ICHEP06, Moscow, USSR, July 26 – August 2, 2006.
- [5] We use the averages of the Heavy Flavor Averaging Group, http://www.slac.stanford.edu/xorg/hfag/, hep-ex/0603003.
- [6] B. Aubert et al. [BaBar Collaboration], arXiv:hep-ex/0607096, BaBar report BaBar-CONF-06/030, SLAC-PUB-11982, presented by A. Lazzaro at ICHEP06, Moscow, arXiv:hep-ex/0610033.
- [7] K. Abe et al. [Belle Collaboration], arXiv:hep-ex/0609006, Belle report BELLE-CONF-0648, presented by M. Hazumi, plenary talk at 33rd International Conference on High Energy Physics (ICHEP06), Moscow, Russia, 26 July – 2 August 2006.
- [8] R. Fleischer and T. Mannel, Phys. Rev. D 57 (1998) 2752; M. Gronau and J. L. Rosner, Phys. Rev. D 57 (1998) 6843.
- [9] A. J. Buras and R. Fleischer, Eur. Phys. J. C 11 (1999) 93; ibid. 16 (2000) 97.
- [10] M. Neubert and J. L. Rosner, Phys. Lett. B 441 (1998) 403; Phys. Rev. Lett. 81 (1998) 5076; M. Gronau, D. Pirjol and T. M. Yan, Phys. Rev. D 60 (1999) 034021.
- [11] M. Gronau and J. L. Rosner, Phys. Rev. D 65 (2002) 013004 [Erratum-ibid. D 65 (2002) 079901]; Phys. Lett. B 572 (2003) 43.
- [12] M. Gronau and J. L. Rosner, Phys. Rev. D 59 (1999) 113002.
- [13] H. J. Lipkin, Phys. Lett. B 445 (1999) 403.
- [14] M. Gronau, Y. Grossman, G. Raz and J. L. Rosner, Phys. Lett. B 635 (2006) 207.
- [15] A proof of this equivalence was given first in the second paper of Ref. [11].
- [16] M. Gronau, O. F. Hernandez, D. London and J. L. Rosner, Phys. Rev. D 50 (1994) 4529.
- [17] C. W. Chiang, M. Gronau, J. L. Rosner and D. A. Suprun, Phys. Rev. D 70 (2004) 034020.
- [18] S. Baek, P. Hamel, D. London, A. Datta and D. A. Suprun, Phys. Rev. D 71 (2005) 057502.
- [19] A. J. Buras, R. Fleischer, S. Recksiegel and F. Schwab, Phys. Rev. Lett. 92 (2004) 101804; Nucl. Phys. B 697 (2004) 133; Acta Phys. Polon. B 36 (2005) 2015.
- [20] H. n. Li, S. Mishima and A. I. Sanda, Phys. Rev. D 72 (2005) 114005. See also Y. Y. Keum, H. n. Li and A. I. Sanda, Phys. Lett. B 504 (2001) 6; Phys. Rev. D 63 (2001) 054008.
- [21] M. Beneke and S. Jager, Nucl. Phys. B 751 (2006) 160. See also M. Beneke, G. Buchalla, M. Neubert and C. T. Sachrajda, Nucl. Phys. B 606 (2001) 245; M. Beneke and M. Neubert, Nucl. Phys. B 675 (2003) 333.
- [22] H. J. Lipkin, arXiv:hep-ph/0608284.
- [23] D. Atwood and A. Soni, Phys. Rev. D 58 (1998) 036005.
- [24] M. Gronau, Phys. Lett. B 627 (2005) 82; M. Gronau and J. L. Rosner, Phys. Rev. D 74 (2006) 057503.
- [25] M. Gronau and J. L. Rosner, Phys. Rev. D 71 (2005) 074019.
- [26] M. Gronau, O. F. Hernandez, D. London and J. L. Rosner, Phys. Rev. D 52 (1995) 6374.
- [27] W. M. Yao et al. [Particle Data Group], J. Phys. G 33 (2006) 1.
- [28] M. Gronau, J. L. Rosner and D. London, Phys. Rev. Lett. 73 (1994) 21.
- [29] J. Charles et al. [CKMfitter Group], presenting updated results periodically on the web site http://ckmfitter.in2p3.fr. For general methods see A. Höcker et al., Eur. Phys. J. C 21 (2001) 225. The latest publicly available analysis in April 2006 quotes the range . Slightly more restrictive limits are implied by the latest results of M. Bona et al. [UTfit Group], hep-ph/0606167 and http://www.utfit.org/. In the latter, the “full fit” value for is , implying at the level.
- [30] Ref. [21]; M. Beneke, private communication.
- [31] C. W. Bauer, D. Pirjol, I. Z. Rothstein and I. W. Stewart, Phys. Rev. D 70 (2004) 054015; C. W. Bauer, I. Z. Rothstein and I. W. Stewart, Phys. Rev. Lett. 94 (2005) 231802.
- [32] C. W. Chiang and Y. F. Zhou, arXiv:hep-ph/0609128.