EUROPEAN LABORATORY FOR PARTICLE PHYSICS
CERN–PH–EP / 2006–013–rev
September 8, 2006
Heavy-Flavour Hadro-Production
from Fixed-Target to Collider Energies
C. Lourenço
CERN-PH, Geneva, Switzerland
H.K. Wöhri ∗
CFTP-IST, Lisbon, Portugal and
CERN-PH, Geneva, Switzerland
Abstract
We review the hadro-production data presently available on open charm and beauty absolute production cross-sections, collected by experiments at CERN, DESY and Fermilab. The published charm production cross-section values are updated, in particular for the “time evolution” of the branching ratios. These measurements are compared to LO pQCD calculations, as a function of the collision energy, using recent parameterisations of the parton distribution functions. We then estimate, including nuclear effects on the parton densities, the charm and beauty production cross-sections relevant for measurements at SPS and RHIC energies, in proton-proton, proton-nucleus and nucleus-nucleus collisions. The calculations are also compared with measurements of single D and B kinematical distributions, and pair correlations. We finish with two brief comments, concerning the importance of beauty production as a feed-down source of J/ production, and open charm measurements performed using leptonic decays.
PACS numbers: 14.40.Lb, 14.40.Nd, 13.25.Ft, 13.25.Hw
To appear in Physics Reports
∗ Now at INFN-Cagliari, Italy.
1 Introduction
In the context of the study of heavy ion collisions, heavy flavour production is becoming increasingly more interesting, as the energies available for particle production increase from fixed target (SPS) to collider (RHIC, LHC) experiments. Charm is the heaviest flavour which can be produced in nucleus-nucleus collisions at SPS energies, where experiments with high intensity beams and a dimuon trigger made detailed studies of the production and suppression of charmonium states (J/, ). Besides being the natural reference for charmonia studies (same initial state), open charm significantly contributes to the yield of dimuons measured in the mass range between the and the J/ resonances, through the simultaneous semi-muonic decays of a pair of D mesons. Enhanced production of continuum dileptons in this mass range, as seen by several experiments at the CERN SPS, could be a signal of thermal dimuon production from a Quark-Gluon Plasma phase, emphasising the importance of understanding the charm “background”.
At the higher energies of RHIC and LHC, also beauty production comes into play, not only as a direct probe of the properties of the very early phase of the collision system but also as a source of J/ mesons. Indeed, the very important study of J/ production (and suppression or enhancement) at collider energies requires a good understanding of the fraction of J/’s coming from the feed-down of B decays. If this feed-down source is not well understood, no proper physics interpretation of the J/ data will be possible.
Therefore, it is very important to have a good evaluation of the yield of charm and beauty production as a function of the collision energy. This is necessary for the understanding of the SPS data and to make reliable estimates of the yields expected at the collider experiments. To ensure their usefulness, these evaluations should be made using a well known and easily available calculation procedure, such as the one provided by the event generator Pythia. However, it is essential to ensure that the generator properly describes existing data, collected over the last years, essentially in fixed target experiments with proton and pion beams.
Since the calculations critically depend on the distribution functions of the quarks and gluons present in the interacting hadrons, we must see how the results vary if we use different sets of parton distribution functions (PDFs). Finally, since we want to use these evaluations in the context of nuclear collisions, it is also important to correctly estimate the effects of the nuclear modifications of the PDFs on the production of heavy flavours. However, the degree of nuclear shadowing at low values of is not well known for the valence and sea quark distributions, and there is no direct information at all on the nuclear effects on the gluon distribution function, at any value of . This makes the predictions of heavy flavour production particularly uncertain for nuclear collisions, especially at the higher energies (lower values) available at the colliders, where gluon fusion dominates the production cross-sections.
In the following section we will discuss some basic concepts relevant to the topic of heavy flavour hadro-production, with emphasis on the importance of the parton distribution functions, including nuclear effects. In Section 3 we introduce the experiments which provided the data included in this report. The data are critically reviewed and compiled in Section 4 for open charm production and in Section 5 for the beauty case. These data are then compared, in Section 6, to the LO pQCD calculations provided by the event generator Pythia. In this section we also estimate the cross-sections for experiments made at SPS and RHIC energies, and we compare the calculations with existing data on single meson kinematical distributions and on pair correlations. We finish with brief comments on the relevance of the beauty feed-down to the studies of J/ suppression at RHIC and higher energies, and on some (indirect) measurements of charm production yields using leptonic decays.
We should clarify that several issues related to heavy-flavour production are not addressed in this review. In particular, we only addressed hadro-production data; see, for instance, Ref. [1] (and references therein) for information related to photo-production or experiments. We have also not covered in here any effects related to “heavy-ion physics”, such as charm flow, gluon saturation, recombination, dead-cone effect, etc; see Refs. [2, 3], for instance, for details on such issues. And it is clear that we only addressed open heavy flavour production; see, for instance, Refs. [3, 4] for details on quarkonia production, in elementary and nuclear collisions.
2 Heavy flavour production in pQCD
In this section we will briefly review some basic issues related to the physics of heavy-flavour production in hadronic collisions. For a more detailed introduction, see e.g. Ref. [1].
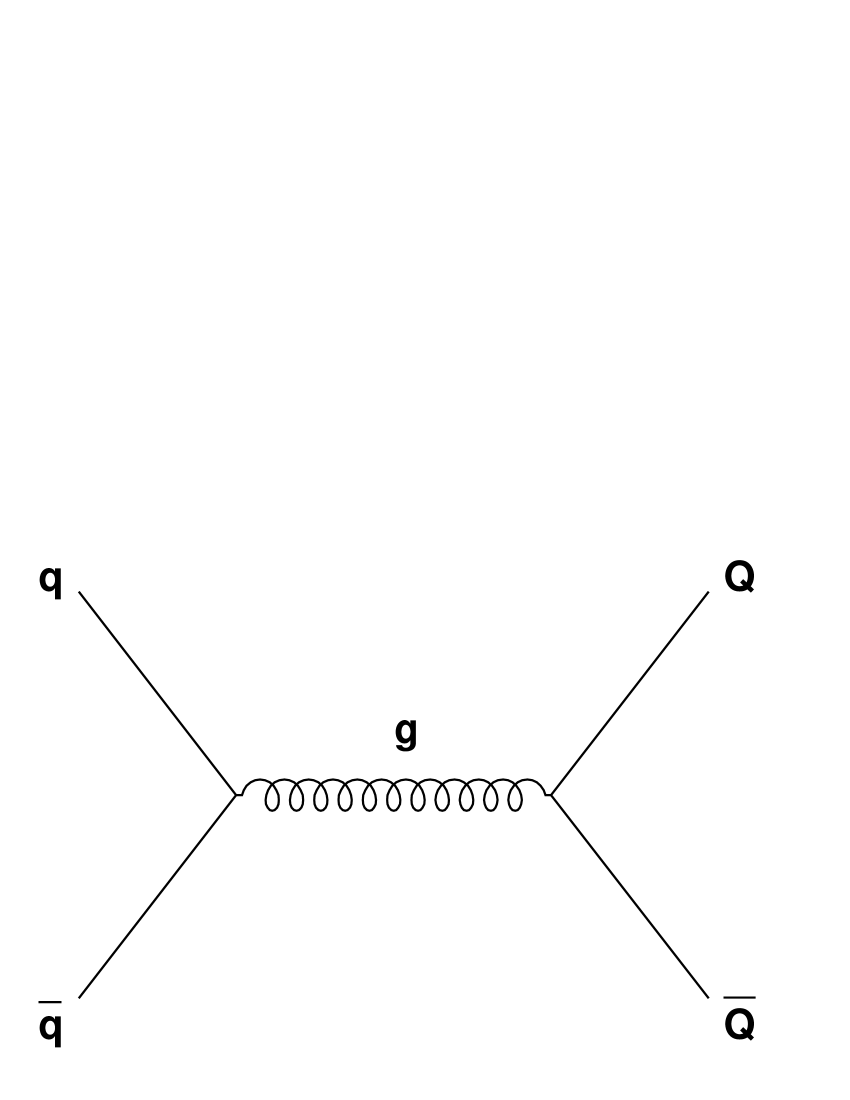
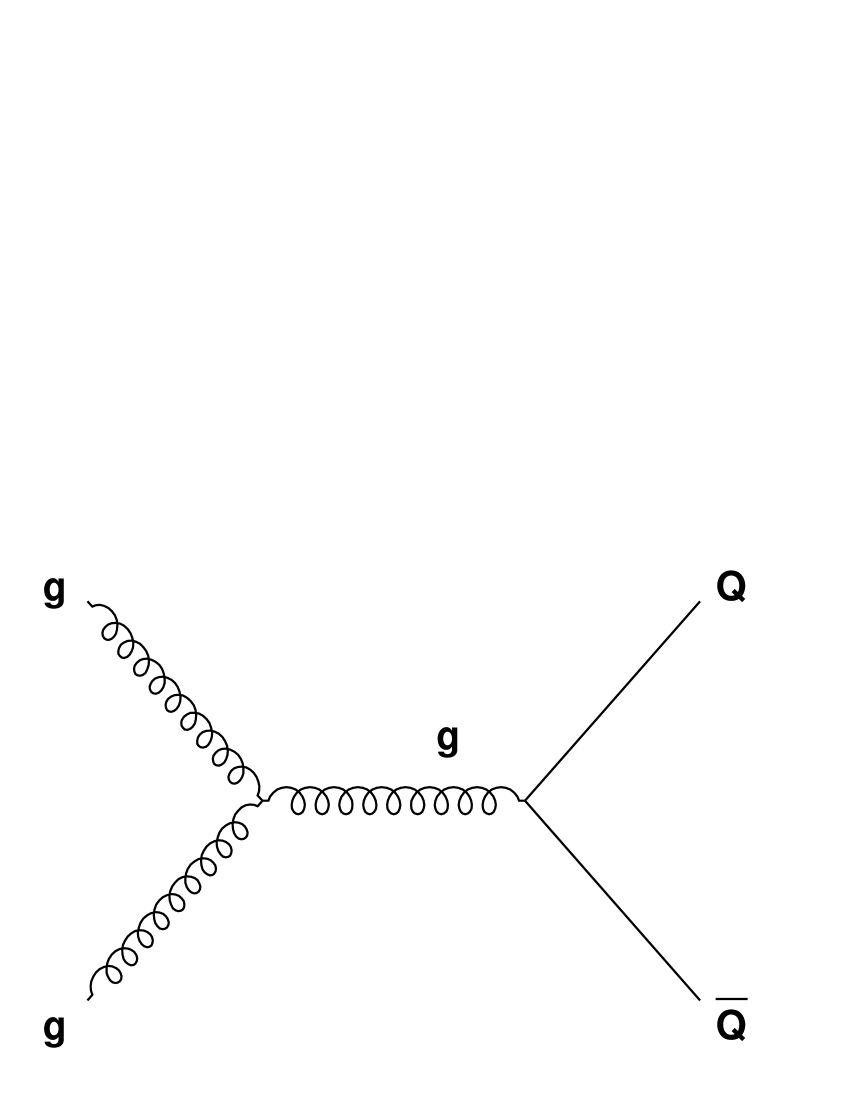
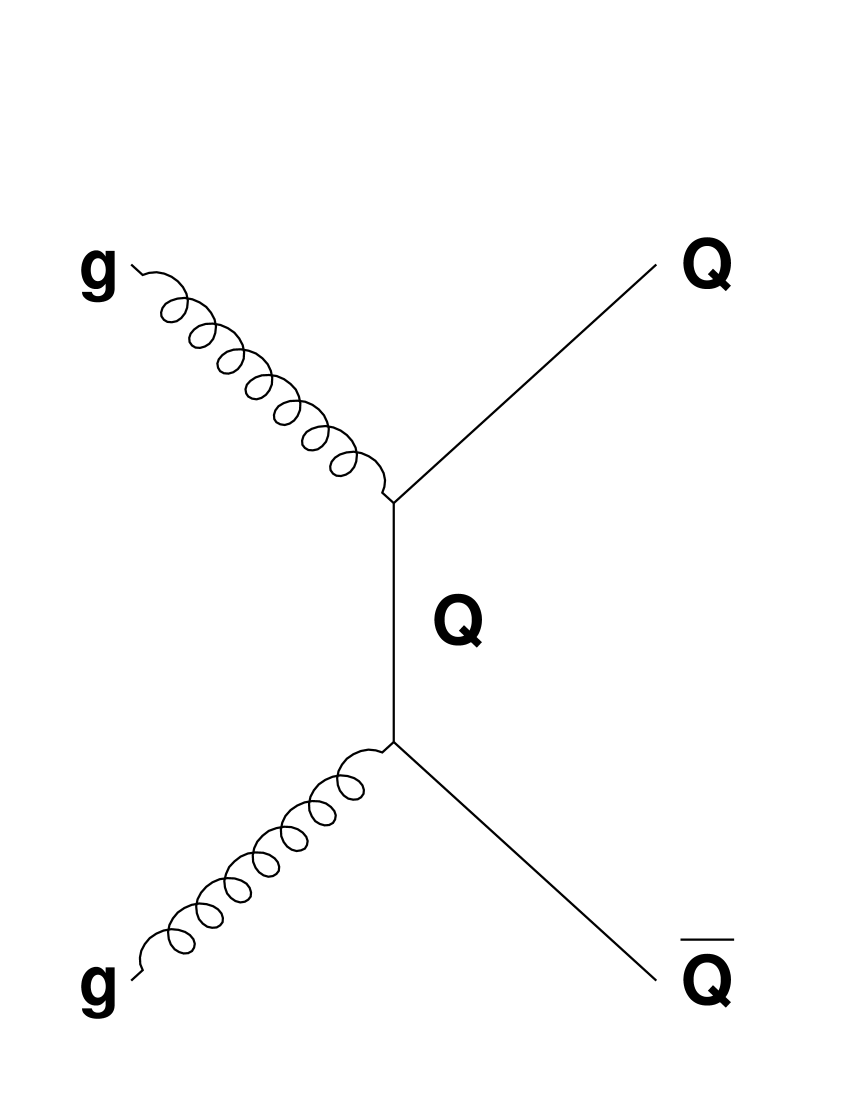
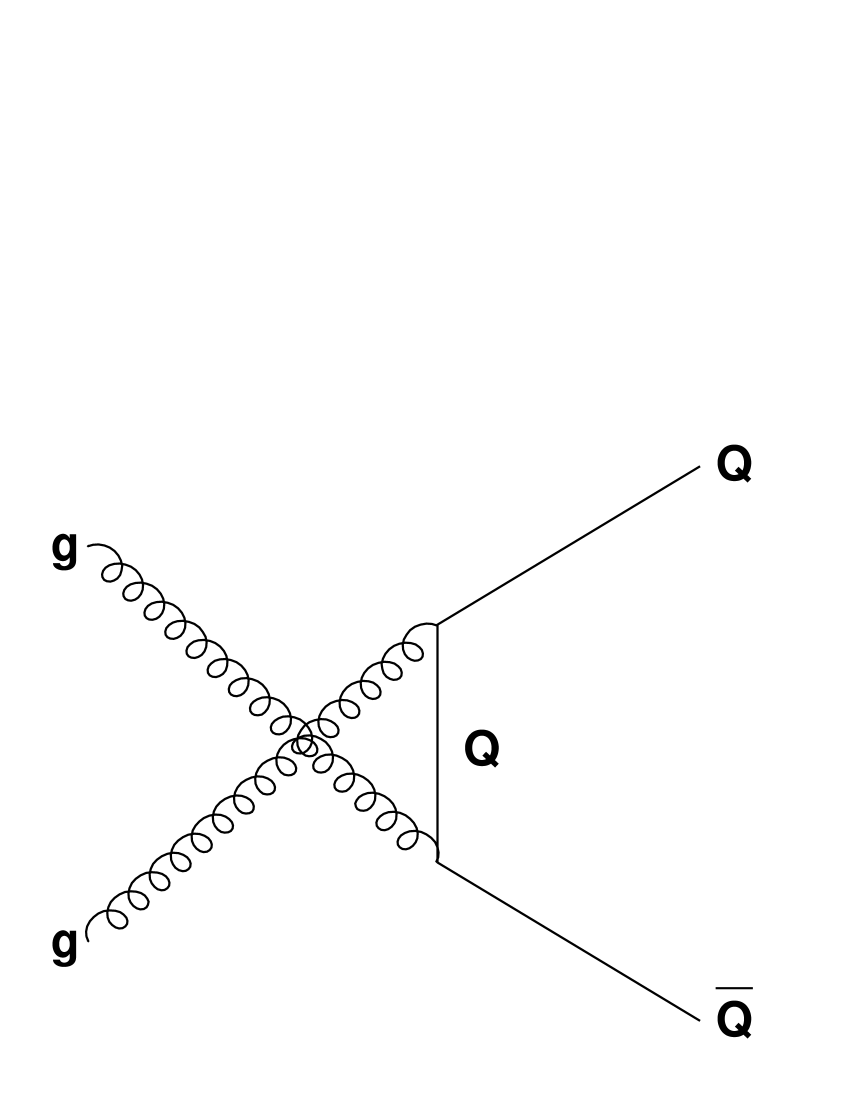
At leading order (LO), the only processes which can lead to heavy flavour production are quark-antiquark annihilation and gluon fusion, as illustrated in Fig. 1. In general, pQCD processes can be factorised into three different parts: the non-perturbative initial conditions, describing the state before the collision takes place, the hard process itself, perturbatively calculable, and the subsequent step of hadronisation (also non-perturbative).
|
|
|
|
The first part is mainly determined by the interacting quarks’ and gluons’ fractional momenta, , where 1 and 2 stand for the projectile and target nucleons. It also depends on the squared energy-momentum transfer between the two partons, , and on the intrinsic transverse momenta, , which the partons carry inside the projectile (proton, pion or nucleus). The distributions of the fractional momenta of the various quarks inside protons and pions were studied in deep inelastic scattering (DIS) experiments, among others, and were parameterised by several groups. They will be discussed in the next section. The “strength” of the process is given by the partonic cross-section, , which depends, in particular, on the available energy. At a given energy, in LO calculations, the partonic cross-section is determined by the mass of the heavy quark, , and by the strong coupling constant, , evaluated at the scale ,
| (1) |
is a dimensionless scaling function which determines the energy dependence of the charm or beauty production cross-section, and which depends on the ratio , where is the squared partonic centre of mass energy, [5]. The indices represent the interacting partons ( or ).
The cross-section to produce a heavy quark pair in a proton-proton collision, , is then obtained by convoluting the perturbatively calculated partonic cross-section with the (non-perturbative) parton distribution functions, , of the interacting hadrons,
| (2) |
If the protons are inside nuclei, their partons have modified distribution functions. In Eq. (2) the parton distribution functions should then be represented by instead of , where A represents the mass number of the nucleus. The implications of this effect on the total cross-sections will be studied in Sections 2.2 and 6.4.
In the last step, the hadronisation, the heavy quark pair fragments into hadrons, including the neutral and charged D or B mesons. We will discuss this step in Section 2.3.
2.1 Parton distribution functions
Figure 3 shows the fractional momentum distributions, in protons, of the valence quarks, sea quarks and gluons. The valence quarks usually have relatively high momentum fractions while the sea quarks and the gluons are mostly found at low values.
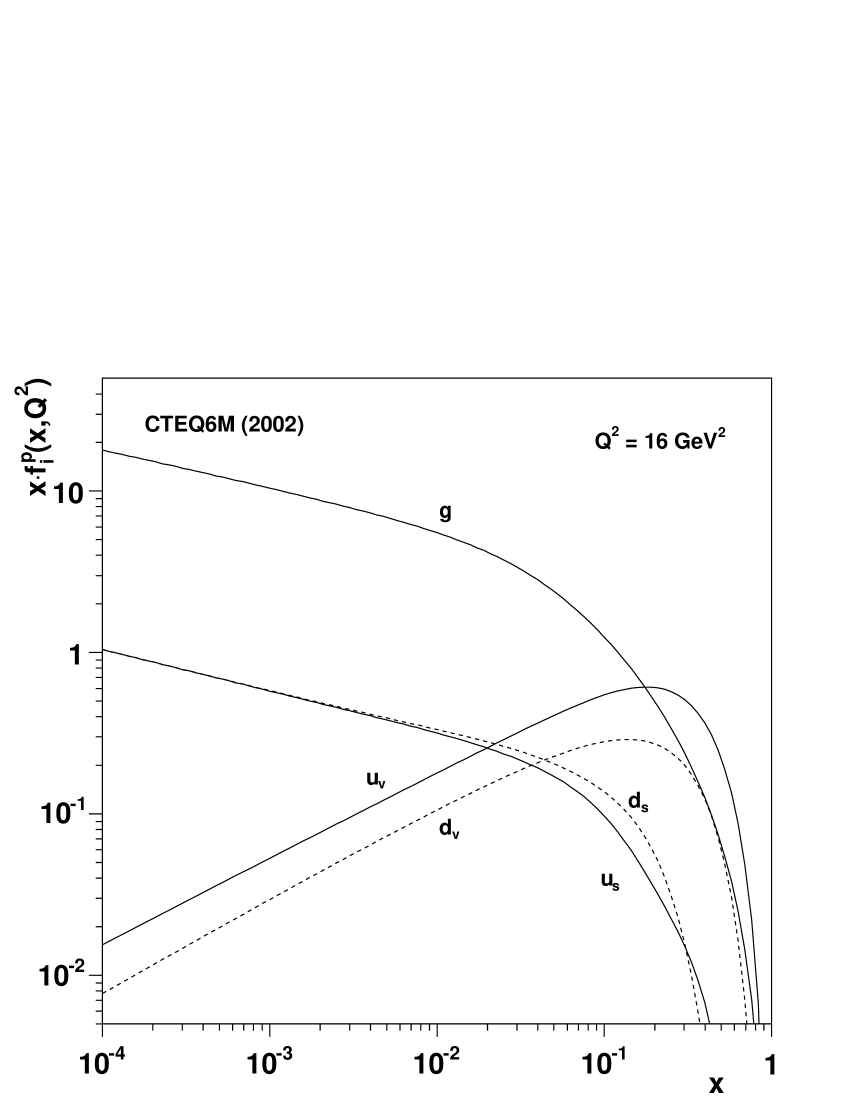


As first observed by NA51 [6] and then studied in more detail by E866 [7], the and distributions are not identical; at there are almost twice as many than in the proton sea. The right panel of Fig. 3 shows how the probabilities of finding certain partons at given momentum fractions change when we probe them in reactions of different values. The higher the energy-momentum transfer, , the higher the probability that low- partons participate in the particle production process.
Later in this report we will calculate the dependence of and production, using different PDF sets. In view of this work, we have upgraded the PDFLIB package [8] to include the recent CTEQ6 [9] and MRST 2001 [10] parameterisations.
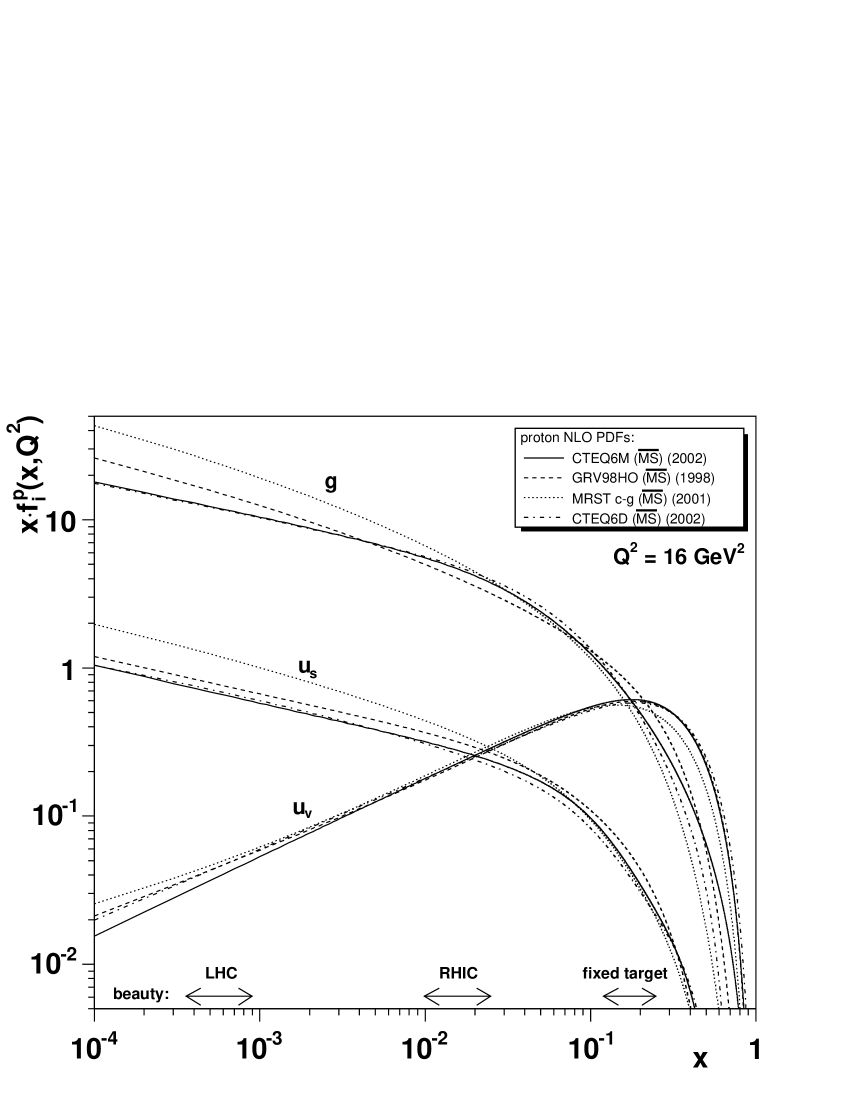
Figure 3 shows different sets of LO and NLO proton PDFs. While the four LO sets show a similar behaviour, the NLO parameterisations show a more significant spread, in particular for the gluons. The CTEQ6M parameterisation differs from other sets mainly in the following two aspects: an extended function is used to fit the data points, including correlated systematic errors, and new measurements are included, with improved precision and expanded ranges. Among the new data sets, the inclusive jet cross-section measurements of the DØ experiment at Fermilab, giving access to the x range , are particularly important, since they have a big impact on the CTEQ6M gluon distribution functions. In Ref. [9] the CTEQ Collaboration gives a detailed description of their new method, which mainly uses the scheme, and outlines the differences with respect to the MRST 2001 sets.
At the bottom of Fig. 3 we roughly indicate the ranges probed by fixed target (SPS, FNAL, DESY) and collider (RHIC, LHC) experiments, for charm and beauty production. They were evaluated using the expression , with masses of 1.5 and 5 GeV/ for charm and beauty, respectively. We set , where is the rapidity in the centre of mass frame, and varied the energy within the ranges of the available experimental measurements.
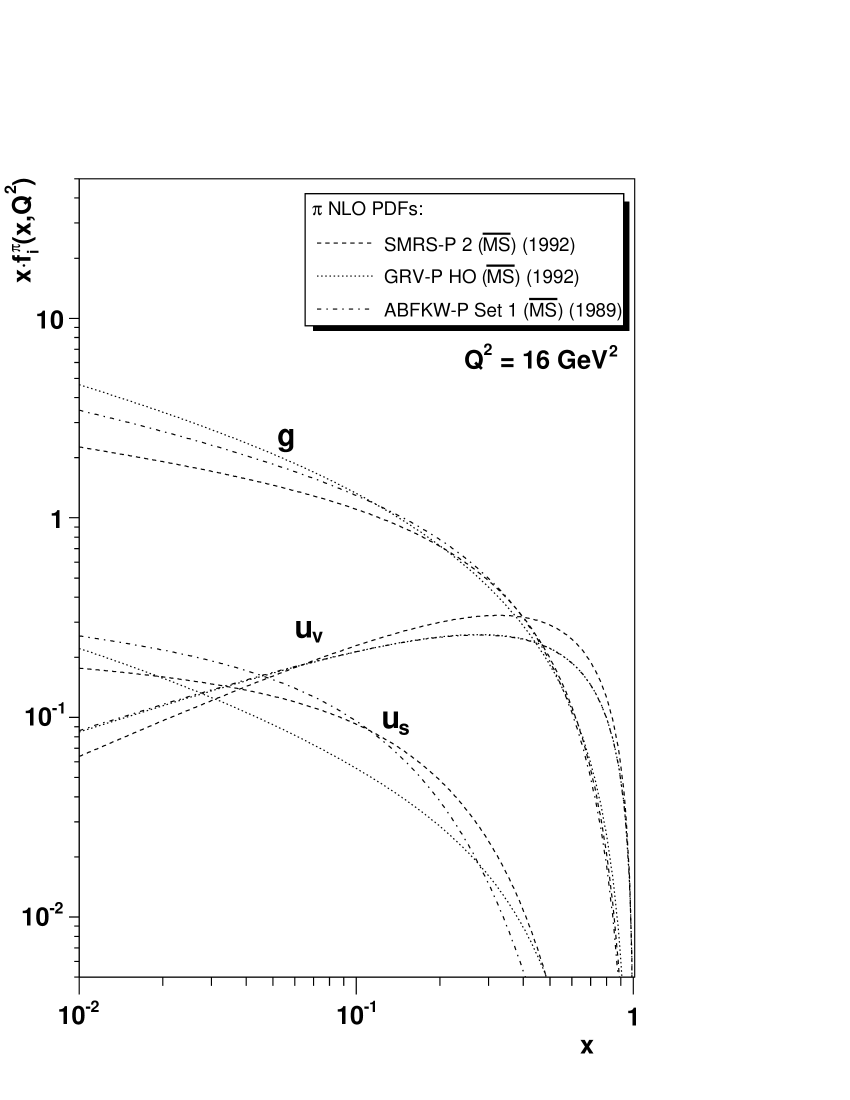

In this report we will consider measurements of open charm and beauty production cross-sections from data obtained with proton and pion beams. In the left panel of Fig. 4 we show three pion PDFs, calculated at NLO. It should be noted that all available pion PDF sets are more than 10 years old. These three pion PDFs are significantly different from each other. On the right panel of this figure we compare LO parton distribution functions in a pion and in a proton. We can see that the valence quark distributions are peaked at in protons and in pions, where the gluons are much harder.

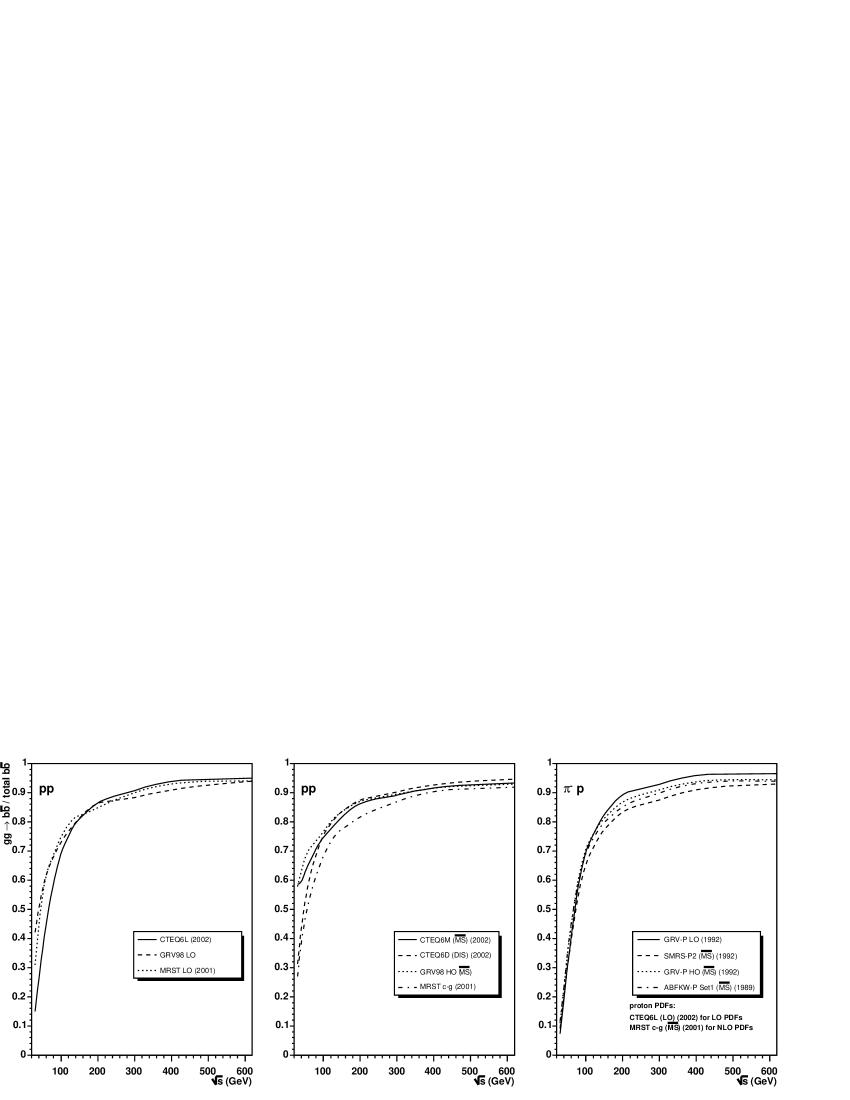
It is clear that the use of different PDF sets will change the calculated total production cross-section of heavy flavour production (see Eq. 2). It also influences the relative importance of gluon fusion and annihilation. Figure 6 shows the relative contribution of gluon fusion to the total production cross-section, as a function of , as calculated by the Monte Carlo event generator Pythia [11], for pp and p collisions. The remainder of the total cross-section is due to annihilation, since at LO there are only these two processes. More details on the calculations will be given later. Note that for the p collisions we used the CTEQ6L (2002) and MRST c-g (2001) sets to describe the parton distributions inside the target proton, but other sets of proton PDFs give similar results. Most measurements of the cross-section were made in the range GeV, or –40 GeV, where the contribution from gluon fusion is around 80 % in pp and around 70 % in p collisions.
In Fig. 6 we show the dependence of the relative contribution of gluon fusion to the total cross-section. The higher values obtained with the CTEQ6M and GRV98 HO PDFs, at the lowest energies, result from the harder gluon distributions of these sets. Comparing Figs. 6 and 6 we see that in the energy range of the fixed target experiments the production of the two heavy flavours is dominated by different mechanisms: while annihilation is responsible for only 20 % of the total production cross-section, it is the dominant process in production. At higher energies, both charm and beauty production are dominated by gluon fusion.
2.2 Nuclear effects in p-A and A-A collisions
The parton distribution functions in the proton, , are essentially extracted from the structure functions (, and ) measured in deep inelastic scattering experiments. These experiments are performed with various nuclear targets, and indicate that the distributions of partons inside bound protons are different from those in hydrogen. These nuclear effects are expressed as the ratio of the PDFs observed in a nucleus with respect to those of a “free” proton,
| (3) |
with representing the valence quarks, the sea quarks, or the gluons.
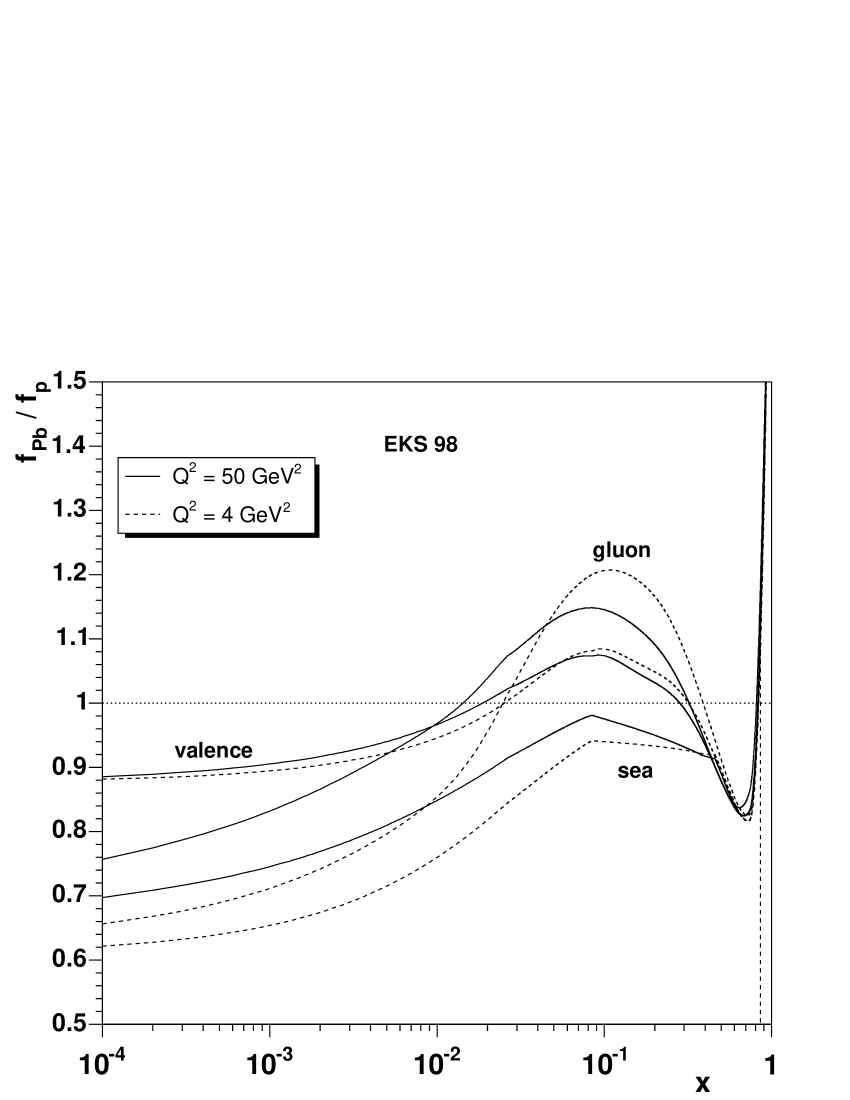
Figure 7 shows this “nuclear weight function”, for the Pb nucleus, as a function of , according to the EKS 98 [12] parameterisation. The curves are shown for two values of . A detailed discussion of the dependence of the nuclear effects on , among many other related issues, can be found in Refs. [12, 13]. The interested reader will find in Ref. [14] a recent and detailed review of nuclear parton distribution functions.
In different regions of , the nuclear effects are traditionally referred to by the following expressions:
-
•
shadowing: at low x, where
-
•
anti-shadowing: at medium x, where
-
•
EMC effect: at relatively high x, where
-
•
Fermi motion: at the highest x, where
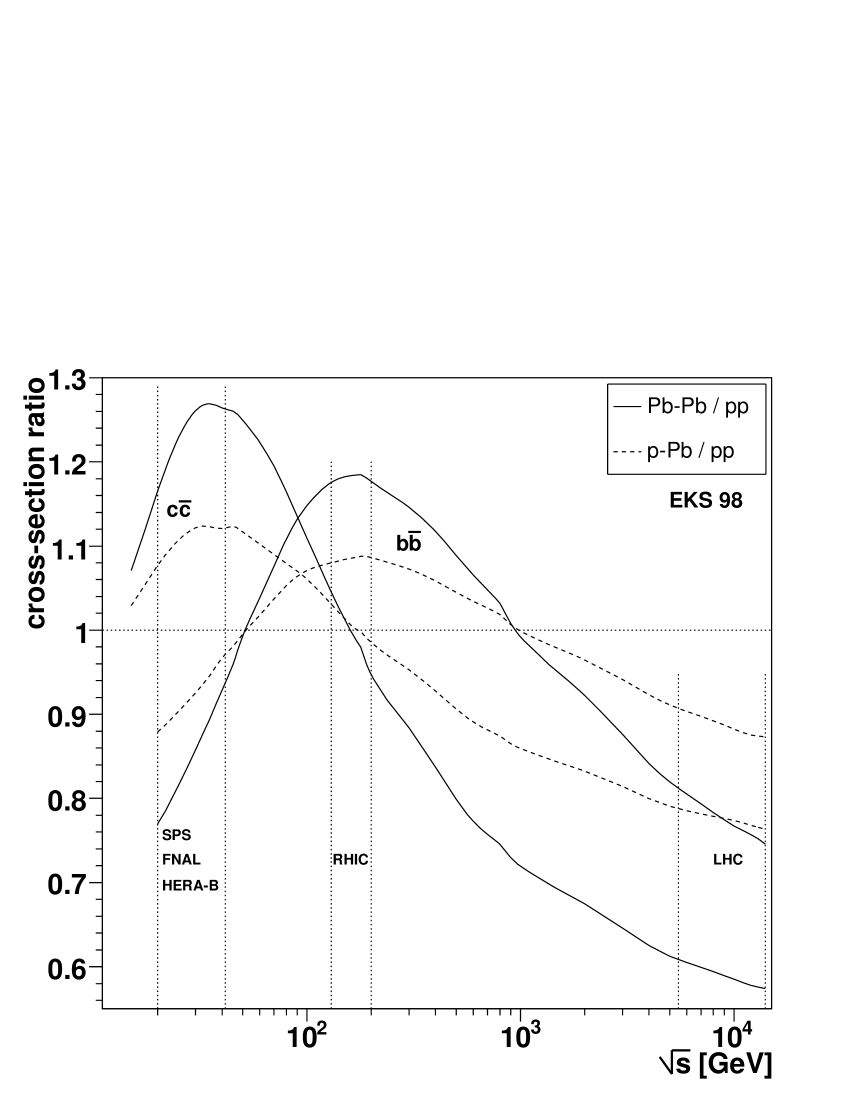
The impact of these nuclear effects on heavy flavour production can be seen in Fig. 8, which shows the ratio between the heavy flavour ( and ) production cross-sections calculated for pp collisions taking into account that those protons are inside Pb nuclei (p-Pb, Pb-Pb) and the same cross-sections calculated for pp collisions in the vacuum. According to the EKS 98 parameterisation, and in what concerns charm production, the experiments carried out at the SPS and FNAL energies are in the anti-shadowing regime. Therefore, inside a heavy nucleus the parton distributions are expected to be harder than in a “free” proton, leading to higher production cross-sections in p-A and A-A collisions with respect to the linear scaling from pp collisions. For instance, at 30–40 GeV, the production cross-sections in p-Pb collisions should be 10 % higher than in the absence of gluon anti-shadowing. The RHIC experiments, at mid-rapidity, are just in the range where the nuclear effects on charm production change from the anti-shadowing to the shadowing region. Therefore, measurements in the central detectors should not be very sensitive to nuclear effects on the parton distribution functions. However, this is no longer the case for the detectors placed away from mid-rapidity. At GeV, and for charm production, we have the same gluon anti-shadowing ( 15 %) at as we have at the SPS ( GeV) at mid-rapidity. In the case of d-Au collisions, there is a significant difference between the expected nuclear effects on the PDFs in the “North” and “South” muon arms of Phenix, for instance. In the “forward hemisphere” (with respect to the d beam), at , there is 20 % shadowing effects on charm production, instead of the 15 % anti-shadowing expected on the “backward” side. It is crucial, hence, to keep the PHENIX charm and charmonia d-Au analyses independent for each of the three covered rapidity ranges. In what concerns beauty, the nuclear effects are expected to influence the production cross-sections in opposite ways when going from measurements done in the energy range of fixed-target experiments (EMC region) to those done at RHIC (anti-shadowing region), with the nuclear cross-sections changing from suppressed to enhanced, with respect to the linear extrapolation from pp collisions. At the LHC energies, we will certainly be in the shadowing region, both for charm and for beauty. Charm production in the Pb-Pb collision system, for instance, is expected to be suppressed by around 40 % with respect to a linear extrapolation of nucleon-nucleon collisions.
It should be noted, however, that there are no measurements today which can constrain the nuclear gluon distribution function. The nuclear gluon densities provided by the EKS98 parameterisation are only indirectly constrained, through the scale evolution of and through momentum conservation. Accurate measurements of open charm production in proton-nucleus collisions, using several nuclear targets and over a broad range of energies, would be crucial to significantly reduce the present uncertainties on the nuclear gluon densities [13].
2.3 Fragmentation
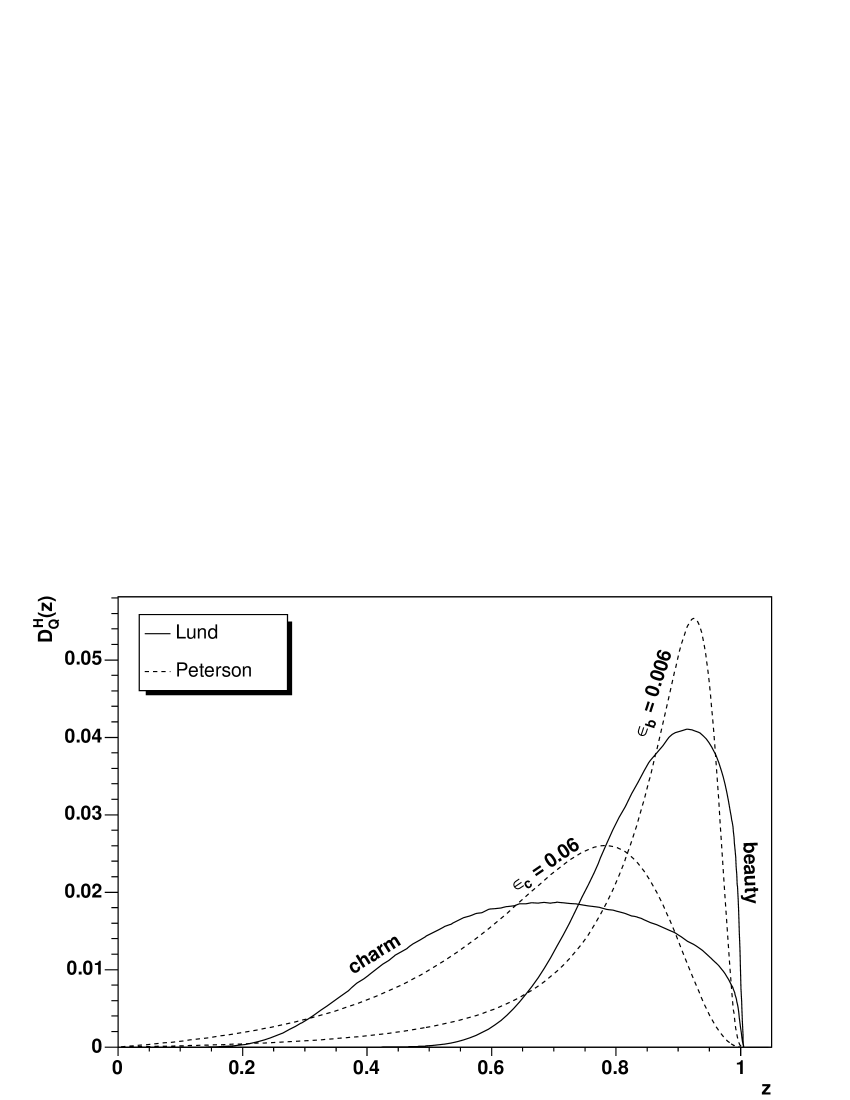
In the hadronisation step, the outgoing heavy quarks fragment into hadrons. The energy carried by the formed hadron with respect to the quark’s energy, , is distributed according to the fragmentation function, , measured in reactions and assumed to be the same in hadronic collisions. We should note that this definition of is not unique; in theoretical studies it is more common to use the lightcone fraction, where is replaced by , with the longitudinal momentum defined by the quark’s direction. Light quark (u,d,s) fragmentation is usually parameterised as while heavy quarks only experience a relatively small deceleration when combining with a (slow) light quark. In 1983, Peterson et al. [15] proposed the following heavy quark fragmentation function
| (4) |
which peaks at . In principle, is fixed by the light and heavy quark masses, , but in practice it is a free parameter, usually taken to be 0.06 for charm and 0.006 for beauty.
Alternatively, the Lund string fragmentation scheme [16] leads to the expression
| (5) |
which is sensitive to the of the produced hadron, through the transverse mass. It implies a harder fragmentation function for heavier quarks, through the explicit mass dependence. The term was introduced by Bowler [17] in 1981, to improve the agreement with the B meson data available at that time.
3 Heavy flavour experiments
Most of the experiments considered in this report were designed to study the properties of charm and/or beauty hadrons. To select events with charm or beauty particles, the experiments used high-resolution detectors in the target region, to observe primary and secondary vertices, signaling the decay of the heavy flavoured hadrons. Three types of vertex detectors have been commonly used: bubble chambers, emulsions and silicon tracking telescopes. The spacial resolution of the silicon detectors is not as good as that of the other systems, but they can be operated at much higher interaction rates, a crucial feature when looking for rare processes. Most of the experiments had particle tracking devices and a muon spectrometer. In addition, the experiments which measured the charm (or beauty) hadrons in hadronic decay channels also had electromagnetic and/or hadronic calorimeters, and particle identification detectors, such as Čerenkov counters, to distinguish pions, kaons and protons. Furthermore, many of them, in particular those which studied beauty production, implemented triggers to enrich their collected event sample with charm and/or beauty events. With only one exception (E789), the fixed target experiments could detect the charm or beauty hadrons in the full forward hemisphere. Some experiments had active targets, where the vertex detector itself was used as target.
The heavy-flavour hadro-production experiments we consider in this report are summarised in Table 1, and described in some detail in the next pages, roughly in chronological order.
| Flavour | Experiment |
|---|---|
| charm | NA11, NA16, NA27, E743, NA32, WA75, WA82, E769, E791, E706 |
| beauty | NA10, WA78, UA1, E706/E672, E771 |
| both | E653, E789, WA92, CDF, HERA-B |
3.1 NA16, NA27 and E743: the LEBC Experiments
The purpose of NA16 was the “study of hadronic production and properties of new particles with a lifetime s, using LEBC-EHS”. It used the high-resolution hydrogen bubble chamber “LEBC” (Lexan bubble chamber) and a prototype version of the European Hybrid Spectrometer, “EHS” [18]. LEBC was a rapid cycling liquid hydrogen bubble chamber, with a fiducial volume of cm3 photographed by two cameras. It served both as a liquid-hydrogen target and as a high-resolution vertex detector. The direct observation of the production and decay vertices is one of the key features of this apparatus. The decay products were analysed downstream in the EHS spectrometer, which could detect photons but had very limited particle identification capabilities. The acceptance for D mesons covered the positive range and was independent of the observed decay mode. The data samples were collected in the late seventies, at the CERN SPS, with 360 GeV proton and beams [19].
NA27 was built “to measure accurately the lifetime of the , , , charm particles and to study their hadronic production and decay properties” (note that the is now named ). It used the final version of the EHS spectrometer [20], composed of three parts and extending over more than 40 metres. Immediately downstream of LEBC were placed two wire chambers, complemented by two small drift chambers, for track reconstruction and triggering purposes. The trigger simply required more than two hits in each of the wire chambers. Each of the two other parts had a magnet and three large drift chambers, leading to a momentum measurement with a relative resolution better than 1 % up to 250 GeV/. Electron and photon detection were provided by two lead-glass electromagnetic calorimeters. A hadron calorimeter was also available. Charged particle tracking and identification were essentially performed by a 40 m3 drift chamber, ISIS, through up to 320 measurements, complemented by two Čerenkov detector systems and a transition radiation detector. In the 400 GeV proton run, a total of 98 neutral and 119 charged D mesons were found [21]. Previously, NA27 had a run at 360 GeV, with lower statistics [22]. The data samples were taken in the early eighties, at the CERN SPS.
Some of the CERN ISR experiments studied charm production indirectly, by triggering on single electrons. The deduced cross-sections were between ten and hundred times higher than those observed in the LEBC experiments. Since the 800 GeV proton beam of Fermilab provided collisions with an energy half way between the SPS and the ISR data, an experiment was proposed, E743, to investigate the discrepancy between the previous measurements. The bubble chamber LEBC was transported to Fermilab and complemented with a multi-particle magnetic spectrometer, MPS, that had Čerenkov and transition radiation detectors for particle identification, besides proportional wire chambers for tracking. The interaction trigger was provided by two proportional wire chambers placed just downstream of LEBC. The experiment collected data in 1985. Like NA16 and NA27, also E743 identified the charm mesons in topological decays, by observing the charge of the decaying particle and a given number of charged final state particles [23]. The new measurement (10 neutral and 46 charged D mesons) agreed with the results of the previous SPS LEBC experiments.
3.2 NA10
NA10 was designed to perform a “high resolution study of the inclusive production of massive muon pairs by intense pion beams” and took data in the early eighties, at the SPS [24]. The muon spectrometer, separated from the target region by a 5 m long carbon muon filter, was composed of eight multi-wire proportional chambers with three tracking planes each, and four trigger hodoscopes made of plastic scintillator slabs, separated in two telescopes by an air core toroidal magnet. The last trigger hodoscope was protected by a 1.2 m iron wall, placed after the tracking chambers, to ensure a clean dimuon trigger without deteriorating the reconstruction of the muon trajectories. The highly selective dimuon trigger, optimised for masses above 3 GeV/, allowed to run at a beam intensity of pions/burst. The study of production in -W interactions was based on the selection of events with three high muons in the final state, coming from the semi-muonic decays of both B mesons and from the semi-muonic decay of one of the D mesons. Beauty production cross-sections were given [25] for incident beam energies of 140, 194 and 286 GeV, the largest statistics ( 14 signal events) corresponding to the highest energy.
3.3 WA78, WA75
WA78 was proposed to “search for the hadroproduction of pairs” and took place in the early eighties, at the SPS [26]. It followed a similar strategy as NA10, looking at three muons in the final state or at like-sign muon pairs. In addition to the muon spectrometer, consisting of drift and multi-wire proportional chambers surrounding a 1.5 T superconducting dipole magnet, WA78 had extensive calorimetry. Because of the large mass difference between beauty and charm mesons, muons produced in the B decay have larger and are accompanied by more energetic neutrinos than those produced by charm decays. The trigger and event selection procedures were, therefore, designed to select events with at least two high- muons and large missing energy. The final event samples, collected with a 320 GeV beam incident on an U target, contained both tri-muon events and like-sign muon pairs [27].
The same muon spectrometer had previously been used by WA75 [28], which collected a few hundred charm events (and one event). The online event selection required at least one high- muon, to enhance the fraction of events with semi-leptonic decays of heavy flavour particles. The primary and secondary vertices were located in the emulsion target, within the volume indicated by the tracks reconstructed with the silicon microstrip planes. A total of 339 events were observed with the identified muon among the tracks of the decay vertices, presumably due to charmed particle semi-leptonic decays.
3.4 NA11 and NA32: the ACCMOR Experiments
The ACCMOR Collaboration started their charm physics program in 1980, as NA11, taking -Be data at 120, 175 and 200 GeV [29], at the SPS. Their large acceptance forward magnetic spectrometer included two magnets, four sets of drift chambers (a total of 48 planes), a complex system of multi-wire proportional chambers, five Čerenkov counters and Pb-scintillator electromagnetic calorimeters. The data samples were collected with a single electron trigger. In a second stage, a vertex telescope of high resolution silicon microstrip detectors was added to the setup, helping to reduce the background levels. The statistics of the charm event sample, however, remained small [30, 31].
In 1984, the NA32 experiment took over, to “investigate charm production in hadron interactions using high-resolution silicon detectors”. The ACCMOR spectrometer [32] was complemented with a finely segmented active silicon target, made of 14 planes of 20 m pitch silicon microstrip detectors, 280 m thick, preceeded by a silicon beam telescope and followed by two silicon multiplicity counters. Forward going particles were tracked in 7 planes of 20 m pitch silicon microstrip detectors, before entering the ACCMOR spectrometer. The data samples were taken with an interaction trigger, defined using signals from the active target. Most of the statistics came from runs with a 200 GeV hadron beam [33] consisting of and K-, separately identified by means of two threshold Čerenkov beam counters. Much fewer events were also collected with a 200 GeV proton beam, allowing the experiment to publish cross-sections for three different beam particles.
The second stage of the NA32 experiment was performed in 1985/86 with a 2.5 mm copper target, placed in vacuum, an improved vertex detector, including CCDs of m2 pixels, and a two-level trigger to select and decays [34]. In these runs, the 230 GeV hadron beam contained 96 % and 4 % K- mesons.
3.5 E653
The E653 experiment [35] was designed to “study charm and beauty using hadronic production in a hybrid emulsion spectrometer”. It was the first experiment designed to measure both charm and beauty hadrons, and took data in 1985 (with protons) and 1987 (with pions), at Fermilab. It used a 1.47 cm long emulsion target with as the average nuclear mass number. This allowed to measure the primary vertex and at least one decay vertex still within the emulsion volume. The trigger, which was optimised to select semi-muonic decays of charm particles, required an interaction in the target and a high muon candidate. Tracking started with a 18-plane silicon microstrip vertex detector and continued with a magnetic spectrometer composed of a dipole magnet and 55 drift chamber planes. After a 5 m long steel absorber was the muon spectrometer, made of 12 drift chamber planes on each side of an iron toroidal magnet. The primary vertex was located visually, and the muon trajectory was compared to the tracks in the emulsion in order to find a good match.
Cross-sections for neutral and charged D meson production were obtained with 800 GeV protons [36] and 600 GeV pions [37], essentially on the basis of semi-muonic decays, with a small contribution from purely hadronic decay channels. For the beauty study [38], the 600 GeV pion data sample was carefully re-analysed to look for additional vertices. As before, the emulsion analysis procedure selected events with muonic secondary vertices of large muon transverse momentum, before proceeding with the search for other decay vertices. 9 events were found where both the B and the decay vertices could be identified and the whole decay chain reconstructed.
3.6 E769, E791
The open geometry TPL (“tagged photon laboratory”) spectrometer, at Fermilab, after being used by E516 and E691 to measure charm photo-production, was “inherited” by the E769 experiment to study “pion and kaon production of charm and charm-strange states”, in 1987/88. The E769 detector included an 11-plane silicon microstrip vertex detector, 2 analysing magnets, 35 drift chambers, 2 multi-wire proportional chambers, and 2 segmented threshold Čerenkov counters to identify kaons, pions and protons. It also included electromagnetic and hadronic calorimeters, a wall of scintillation counters for muon identification, and a high-rate data acquisition system. E769 used a mixed 250 GeV secondary beam of both charges. A much smaller data sample was also collected with a 210 GeV negative beam. The composition of the negative beam was 93 % , 5 % K- and 1.5 % , while the positive beam was 61 % , 4.4 % K+ and 34 % p. The beam-particle identification was provided by a differential Čerenkov counter complemented, in the case of the positive beam, by a transition radiation detector. Eight proportional wire chambers and two silicon microstrip planes were used to track the beam. This allowed the E769 Collaboration to study D meson production in pion, kaon and proton induced collisions [39]. The mixed hadron beam collided on a multifoil target, consisting of 250 m thick Be, Al and Cu foils, as well as 100 m thick W foils, interspaced by 1.6 mm. In total, 26 target foils were used, giving a total target thickness of 2 % of an interaction length. Having different target materials simultaneously in the beam allowed the experiment to measure the nuclear dependence of open charm production in pion induced collisions.
E791 was approved to study “hadroproduction of heavy flavours at the tagged photon laboratory”. With respect to the E769 detector, the E791 experiment increased the number of silicon microstrip planes in the vertex telescope, added a second scintillator wall in the muon identifier, and implemented a faster read-out system. The 2 % interaction length target was made of one 0.52 mm thick platinum and four 1.56 mm thick diamond disks, interspaced by 1.53 cm. This rather large spacing ensured that the decay of a charm hadron would occur between the target foils. It collected 88 990 neutral D mesons in 1991/92, with a pure beam of 500 GeV [40].
3.7 UA1
The UA1 detector was built to find the intermediate vector bosons in collisions, using the SPS in a collider mode. It was basically composed of a cylindrical drift chamber and an electromagnetic calorimeter immersed in a dipole magnetic field, surrounded by a hadron calorimeter and a 8-layer muon detector. “End-cap” electromagnetic and hadronic calorimeters were installed in the forward directions, giving the detector an excellent hermetic coverage. The beauty production cross-section measurement [41] was performed in the 1988 and 1989 runs, at GeV, when the central electromagnetic and forward calorimeters were removed in preparation for the installation of new detectors. The muon detection system was improved by the addition of iron shielding in the forward region. Muon trigger processors selected tracks in the muon chambers pointing back to the interaction region. At high luminosity, the muon trigger rate in the forward region was further reduced by requiring a jet of transverse energy greater than 10 GeV in coincidence with the muon trigger. The search for beauty hadrons was performed in four independent decay channels: , , and . Cross-sections were measured for each of these processes, each channel covering different ranges in , from which B hadron and b quark cross-sections were inferred. The combined cross-section was then extrapolated to full phase space.
3.8 E672 and E706
E706 was designed to perform “a comprehensive study of direct photon production in hadron induced collisions”, at Fermilab. The detector complemented a large acceptance liquid argon calorimeter, containing a finely segmented electromagnetic section and a hadronic section, with a charged particle tracking system composed of silicon microstrip detectors, a large aperture dipole magnet, proportional wire chambers and straw tube drift chambers. The experiment collected events triggered by high transverse momentum showers detected in the electromagnetic calorimeter. This requirement enhanced the fraction of selected events containing charm by nearly an order of magnitude, compared to a minimum bias trigger. The measurements [42], restricted to charged D mesons, were performed in 1990, using a negative 515 GeV beam, primarily composed of pions with a small admixture of kaons (), not separated. Two m thick copper targets were followed by two beryllium cylinders, 3.71 and 1.12 cm long.
Downstream of the E706 apparatus, 20 m away from the target and protected by a steel wall to absorb most of the hadrons, was placed the E672 muon spectrometer, aimed at “studying hadronic final states produced in association with high-mass dimuons”. The E672 muon spectrometer was composed of six proportional wire chambers, a toroidal magnet and two scintillator hodoscopes, besides iron and concrete shielding, to provide a clean dimuon trigger. In 1990, the E706 and E672 Collaborations joined efforts to study beauty production in -Be collisions at 515 GeV [43], using J/ mesons coming from secondary vertices to tag the beauty candidates. The trigger selected dimuons in the proximity of the J/ mass; they had a mass resolution of 68 MeV and an average vertex resolution of 14 and 350 m, in the transverse and longitudinal coordinates, respectively.
3.9 E789
E789 was proposed to “measure the production and decay into two-body modes of b-quark mesons and baryons”, and took data in 1990/91. E789 upgraded the spectrometer previously used by the E605 and E772 experiments by adding a vertex telescope, made of 16 planes of 50 m pitch microstrip silicon detectors and placed between 37 and 94 cm downstream of the target, to identify the decays of neutral D mesons. Data samples were taken with either beryllium or gold targets. A vertex processor selected (on-line) track pairs consistent with decay vertices at least 1.02 mm downstream of the target and impact parameters of at least 51 m relative to the target centre. The spectrometer featured two large magnets. Particles were identified by electromagnetic and hadronic calorimeters, scintillation hodoscopes, proportional-tube muon detectors and a ring-imaging Čerenkov counter. E789 collected a large statistics data sample [44], much bigger than all other charm measurements made with proton beams, but only measured neutral D mesons and their acceptance was limited to the window. It also measured the nuclear dependence of neutral D meson production, comparing data taken on beryllium and gold targets.
E789 was the first experiment to measure the beauty production cross-section in proton-nucleus interactions [45], using a gold target of mm2 area and 3 mm thick. The target was placed in vacuum, to ensure that interactions in air would not be confused with -hadron decays. Within its acceptance, the highly energetic ( GeV) B hadrons had their production and decay vertices separated by an average distance of 1.3 cm. E789 triggered on events with a dimuon coming from the target region, to look for beauty hadrons through their decay into a J/ meson. The spectrometer had excellent dimuon mass resolution: 16 MeV at the J/ mass, dominated by multiple scattering in the target. The longitudinal vertex resolution was 700 m. J/’s from beauty decays were requested to have their origin more than 7 mm downstream of the target centre. The impact parameter of each muon, defined as the vertical distance between the muon track and the target centre, had to be larger than 150 m. events survived these rather strict selection cuts.
3.10 E771
The E771 Collaboration upgraded the Fermilab High Intensity Lab spectrometer, previously used by E537 and E705, with silicon microstrip detectors, pad chambers and resistive plate counters, to “study charm and beauty states as detected by decays into muons” [46]. The beauty production cross-sections [47] were measured from data collected during one month in 1991, using the 800 GeV proton beam. The target consisted of twelve 2 mm thick Si foils interspaced by 4 mm, giving a total effective length of 5.2 % . A silicon microvertex detector was positioned downstream of the target for the measurement of primary and secondary vertices. Multiwire proportional chambers and drift chambers were used, together with a dipole analysis magnet, to determine charged particle trajectories and momenta. The spectrometer finished with a muon detector made of three planes of resistive plate counters, embedded in steel and concrete shielding. E771 used a dimuon trigger to select two possible decay modes: a J/ coming from the decay of a B meson, or a muon pair from the simultaneous semi-muonic decays of two beauty hadrons. Muons from the semi-muonic decay of B mesons could be accepted if within the window.
3.11 WA92, WA82
The Beatrice Collaboration, WA92, used the Omega Spectrometer, at the CERN SPS, to “measure beauty particle lifetimes and hadroproduction cross-sections”, but also published results on charm production [48]. It took data in 1992 and 1993 with a 350 GeV beam (including a 1.2 % K- contamination) incident on Cu and W targets. Charged particle tracking started with a series of high granularity (10 to m pitch) silicon-microstrip detector planes, organised in a Beam Hodoscope, a Decay Detector and a Vertex Detector. Charged particles were then tracked in multi-wire proportional chambers placed inside the superconducting Omega dipole magnet, with a bending power of 7.2 Tm, and in drift chambers placed downstream of the magnet. The setup was completed with an electromagnetic calorimeter, followed by a muon identifier made of resistive plate counters protected by hadron absorbers. A multi-component trigger was developed to identify events with beauty decays, which also slightly enriched the fraction of collected charm events. Due to the high statistics collected with the Cu and W targets, WA92 also measured the nuclear dependence of neutral and charged D meson production [49]. The beauty production cross-section measurement was derived from the -Cu data samples [50].
Part of these detectors had already been used by the WA82 experiment, where the Omega Spectrometer was complemented by 23 silicon-microstrip detector planes, with a pitch ranging from 10 to 50 m, to precisely reconstruct tracks and (secondary) vertices [51]. The fast online treatment of the silicon-microstrip data was used to select events with at least one track missing the primary vertex. To study the nuclear dependence of charm production [52], the experiment took data (with a 340 GeV beam) using a 2 mm thick target made of two materials (either Si/W or Cu/W), placed side by side, transversely with respect to the beam axis. The beam illuminated simultaneously both target materials, reducing the systematic uncertainties.
3.12 CDF
CDF is a “general purpose” experiment, at Fermilab, which studied collisions at TeV between 1992 and 1995 (“Run I”), and at 1.96 TeV from year 2001 onwards (“Run II”). Charged track trajectories are reconstructed in a drift chamber and matched to strip clusters in the silicon vertex detectors. These devices are immersed in a magnetic field of 1.4 T, generated by a superconducting solenoid. The central muon system (outside a hadron calorimeter) consists of eight layers of drift chambers, four before and four after a 60 cm thick steel absorber, and detects muons with GeV/ in the range . The measurements of D and B meson production are based on rather large data samples, but the results from Run I are restricted to a relatively high window, –6.0 GeV/, at mid-rapidity, . In Run I, CDF studied charged B meson production [53] using the B decay channel. Charged B candidates were selected by combining the J/ mesons with each charged particle track of GeV/ (kaons from B meson decays have a harder spectrum than most other particles). The dimuon and kaon tracks were then constrained to come from a common vertex. This study was done using events triggered on two opposite-sign muons in the mass range of the J/, corresponding to an integrated luminosity of pb-1.
Run II provided much better data for heavy flavour studies, largely because of the added ability to trigger on secondary vertices. Results on charm production [54] were obtained from data collected in early 2002. The D mesons were selected by requiring two oppositely charged tracks with GeV/ and GeV/, with a distance of closest approach to the beam axis between m and 1 mm. Results on beauty production have also been published [55], based on data collected in 2002, with pb-1. Beauty hadrons were measured in the inclusive B channel, using the transverse distance between the J/ origin and the collision vertex, within and down to , a rather impressive experimental achievement: close to the signal drops fast but the background does not, the acceptance changes rapidly, etc.
3.13 HERA-B
The HERA-B fixed-target experiment, at DESY, was designed to identify, within a large geometrical coverage, the decays of B and J/ mesons produced on target wires by the halo of the 920 GeV HERA proton beam. Most of the events were collected with C and W targets, with only a small fraction (less than 10 %) taken with Ti. Primary and secondary vertices were reconstructed by the vertex detector system, made of double-sided silicon microstrip detectors integrated in the HERA proton ring. The main tracking system was placed upstream of a 2.3 T dipole magnet. The inner region, near the beam pipe, used microstrip gas chambers, while the outer tracker was made of honeycomb drift cells. Particle identification was performed by a ring imaging Čerenkov detector, a muon spectrometer composed of four tracking stations, and an electromagnetic calorimeter. In the data taking period of 2002/2003, events were collected with a dilepton J/ trigger. Decays of J/, , and mesons were reconstructed, in the and in the decay channels.
A production cross-section measurement was published [56] from data collected in year 2000, with dimuon and dielectron triggers, through the study of decays in the window , on the basis of dimuon events and dielectron events. Improved results from the 2002/2003 run were recently published [57], following the same analysis, yielding and events in the muonic and electronic channels, respectively. Results on open charm production are expected to be published soon. Preliminary values have already been made public [58].
4 Data on open charm production
In this section we collect and discuss the experimentally measured production cross-sections for the charged and neutral D mesons, and . Within the last 30 years various experiments, using different kinds of detectors, have collected data on open charm production. In the late seventies, four experiments at the ISR pp collider, at CERN, reported results on charm production, mostly triggering on single electrons, assumed to come from the semi-electronic decay of a D- or a . We have not included these measurements in our study. In some cases, only upper limits or ranges were given for the cross-sections. Moreover, due to lack of statistics, sometimes data collected at and 62 GeV were merged to obtain a common result on the production cross-section. Besides, the published values differ significantly between the different experiments, as discussed in Ref. [59].
| Experim. | Beam | Target | Phase space window | Events | ||
| [GeV] | (, in GeV/) | D0 | D+ | |||
| NA16 | p | 360 | p | –0.1 | 5 | 10 |
| NA27 | p | 400 | p | –0.1 | 98 | 119 |
| E743 | p | 800 | p | –0.1 | 10 | 46 |
| E653 | p | 800 | emulsion | –0.20.2 | 108 | 18 |
| E789 | p | 800 | Be, Au | 0 | 4000 | — |
| E769 | p | 250 | Be, Al, Cu, W | 136 | 159 | |
| HERA-B | p | 920 | C, Ti, W | 189 | 98 | |
| NA11 | 200 | Be | 0.0 | 29 | 21 | |
| NA16 | 360 | p | 4 | 9 | ||
| NA27 | 360 | p | 49 | 14 | ||
| NA32 | 200 | Si | 75 | 39 | ||
| NA32 | 230 | Cu | 543 | 249 | ||
| E653 | 600 | emulsion | 8 | 325 | 351 | |
| E769 | 210 | Be, Al, Cu, W | –0.1 | 62 | 73 | |
| E769 | 250 | Be, Al, Cu, W | –0.1 | 353 | 414 | |
| WA92 | 350 | Cu, W | 0.0 | 3873 | 3299 | |
| E791 | 500 | C, Pt | –0.1 | 88990 | — | |
| E706 | 515 | Be, Cu | –0.2, 18 | — | 110 | |
| E769 | 250 | Be, Al, Cu, W | 144 | 169 | ||
There are other early experiments [60] which studied open charm production but which we will not consider here, such as NA18, NA25, E515 and E595. They could not separate the different charm hadrons, only giving “associated charm production cross-sections”. Within their rather large uncertainties, their values are consistent with the measurements we have considered. We have also ignored the result obtained at GeV with a modified UA2 detector [61], given its huge uncertainty.
In Table 2 we summarise the data used in the present study, obtained with proton and pion beams, at energies ranging from to 920 GeV. Very significant statistical samples have been collected by WA92 and E791 ( 7000 and 90 000 events, respectively) with pion beams, while the fewer proton beam experiments collected much less data. The 300 events of E769 (adding neutral and charged D mesons and the statistics of four different nuclear targets) constitute the highest statistics proton event sample, among the fixed target experiments covering a reasonably large phase space window.
At the much higher energies of the Tevatron p collider, TeV, CDF collected (within the window) 36 804 D0 mesons, of GeV/, and 28 361 D+ mesons, of GeV/.
| Decay channel | Experiment | BR used | BR (PDG04) | |
| [%] | [%] | |||
| NA11(86) | [30] | |||
| NA32(88), E653(92) | [63] | |||
| NA32(91) | PDG88 | |||
| E789(94) | PDG92 | |||
| E769(96) | PDG94 | |||
| WA92(97) | PDG96 | |||
| E791(99) | PDG98 | |||
| HERA-B(05), CDF(03) | PDG02 | |||
| NA11(86) | [30] | |||
| NA32(88), E653(92) | [63] | |||
| NA32(91) | PDG88 | |||
| WA92(97) | PDG96 | |||
| E791(99) | PDG98 | |||
| E653(91) | PDG90 | |||
| E653(92) | [37] | |||
| E653(92) | [37] | |||
| NA11(86) | [30] | |||
| NA32(88), E653(92) | [63] | |||
| NA32(91) | PDG88 | |||
| E769(96) | PDG94 | |||
| WA92(97), E706(97) | PDG96 | |||
| HERA-B(05), CDF(03) | PDG02 | |||
| NA11(87) | [31] | |||
| E653(91) | PDG90 | |||
| E653(92) | [37] | |||
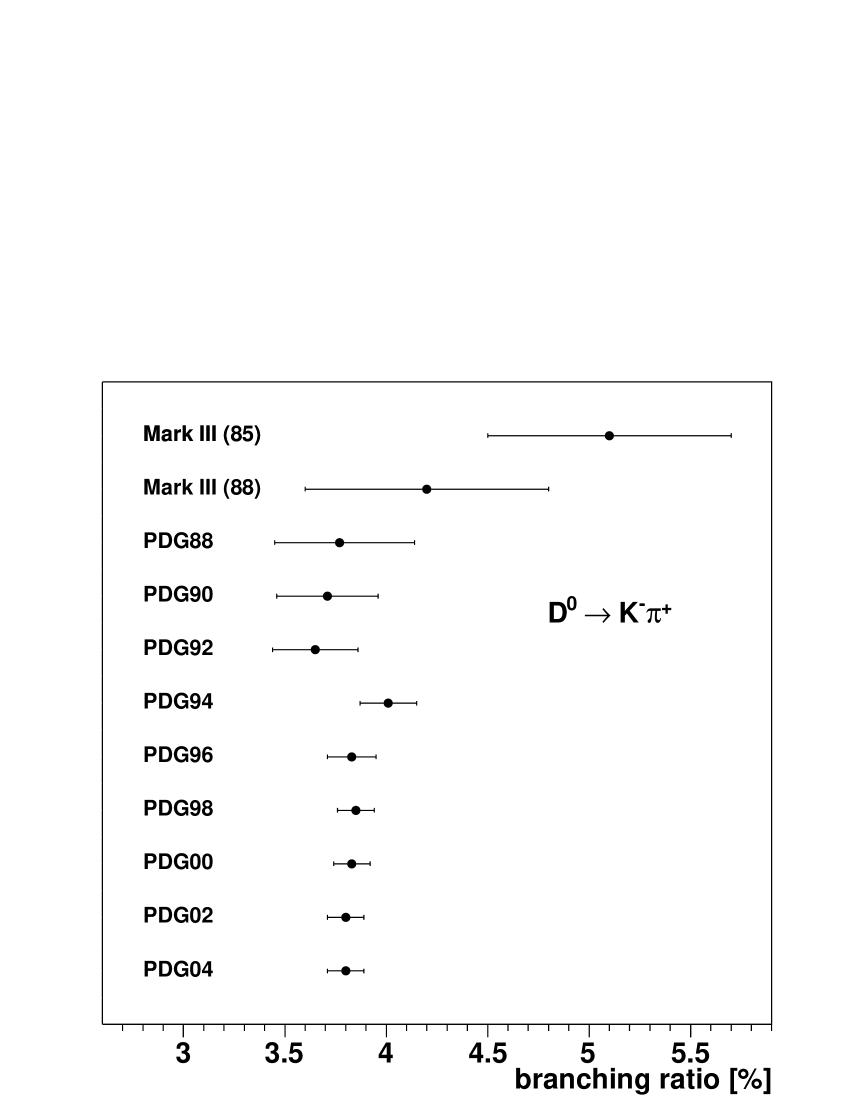
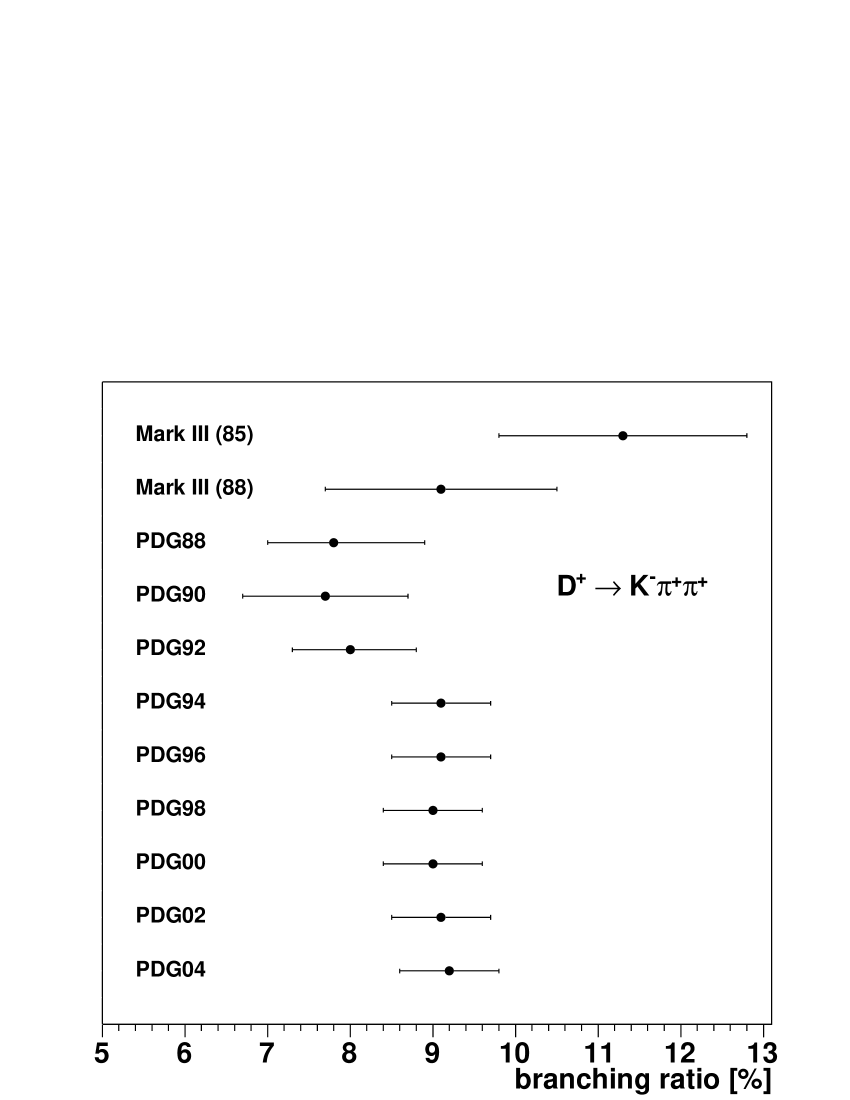
In order to properly compare the different measurements to each other, we applied certain corrections to some of the published values. In particular, whenever possible, we normalised the published cross-sections to the latest branching ratio values, using the Particle Data Group 2004 values [62]. Table 3 summarises the decay channels of D mesons which were investigated in each experiment. It further lists the branching ratio used in the original publication, together with the corresponding latest value. Figure 10 illustrates the “time evolution” of two branching ratios.
| Experiment | given | [b] | ||
|---|---|---|---|---|
| [GeV] | for | published | updated | |
| p beam, | ||||
| NA16 (84) [19] | 360 | |||
| NA27 (88) [21] | 400 | all | ||
| E743 (88) [23] | 800 | all | % | % |
| E653 (91) [36] | 800 | all | ||
| E789 (94) [44] | 800 | all | ||
| E769 (96) [39] | 250 | |||
| HERA-B (05) [58] | 920 | all | ||
| p beam, | ||||
| NA16 (84) [19] | 360 | |||
| NA27 (88) [21] | 400 | all | ||
| E743 (88) [23] | 800 | all | % | % |
| E653 (91) [36] | 800 | all | ||
| E769 (96) [39] | 800 | |||
| HERA-B (05) [58] | 920 | all | ||
We have also updated the systematic errors of the published values to reflect the smaller uncertainties of the most recent branching ratios. Some publications have not included on their systematic errors these uncertainties, something we must do when comparing D meson production measured in different decay channels. If the D mesons were searched for in more than one decay channel, the performed corrections were weighted according to the number of observed events in each of the decay channels. This procedure was not applied to the data of experiments which searched the D mesons in topological decays, where the search is not done in a specific decay channel, but rather by detecting a certain number of charged or neutral final state particles (NA16, NA27, WA75, E743).
| Experiment | given | [b] | ||
|---|---|---|---|---|
| [GeV] | for | published | updated | |
| beam, | ||||
| NA16 (84) [19] | 360 | |||
| NA27 (86) [22] | 360 | |||
| NA11 (86) [30] | 200 | all | ||
| NA32 (88) [33] | 200 | |||
| NA32 (91) [34] | 230 | |||
| E653 (92) [37] | 600 | |||
| E769 (96) [39] | 210 | |||
| E769 (96) [39] | 250 | |||
| WA92 (97) [49] | 350 | |||
| E791 (99) [40] | 500 | |||
| beam, | ||||
| NA16 (84) [19] | 360 | |||
| NA27 (86) [22] | 360 | |||
| NA11 (86) [30] | 200 | all | ||
| NA11 (87) [31] | 200 | all | ||
| NA32 (88) [33] | 200 | |||
| NA32 (91) [34] | 230 | |||
| E653 (92) [37] | 600 | |||
| E769 (96) [39] | 210 | |||
| E769 (96) [39] | 250 | |||
| WA92 (97) [49] | 350 | |||
| E706 (97) [42] | 515 | |||
| beam, | ||||
| E769 (96) [39] | 250 | |||
| beam, | ||||
| E769 (96) [39] | 250 | |||
The neutral D mesons were searched, e.g., in “V2” or “V4” prong decays, corresponding to neutral decays with 2 or 4 prongs, while “C3” is a typical topological decay of a charged D meson with 3 prongs. Since topological decays are composed of different decay channels, with unknown contributing fractions, we cannot correct them for the evolution in our knowledge of the branching ratios. Tables 4 and 5 collect the published and updated values of the production cross-sections for fixed-target experiments using proton and pion induced collisions, respectively.
CDF measured in Run II [54], the single D meson production cross-sections in collisions at TeV, in : b for GeV/ and b for GeV/.
With the exception of WA75, the experiments which used nuclear targets assumed a linear dependence on the mass number of the target nucleus to derive the cross-section in pp (or p) collisions, .
We will now comment on certain specific measurements.
-
•
NA16 (84) The publication does not mention if the quoted errors include systematic uncertainties, due to the branching ratios or to other factors. In any case, the quoted errors are very large (and certainly dominated by statistical uncertainties) and increasing them would not change the overall comparison with the other, more precise, data points. Therefore, we have not updated the NA16 values or error bars. This applies to all NA16 measurements, with proton or pion beams, producing charged or neutral D mesons.
-
•
E789 (94) The acceptance of the E789 detector was limited to the ranges and GeV/. It is clear that the extrapolation of the measurement to full phase space is model dependent, and a significant uncertainty should be added to the published systematic error, before comparing it to other measurements or to calculations.
-
•
NA27 (86) The neutral D mesons were searched in the 2-prong and 4-prong decays. By weighing the contributions from these two modes, we deduced an uncertainty of 15 % in the cross-section measurement, due to the branching ratio. This value was used to estimate the systematic error of the published cross-sections, since no other value was explicitly quoted in the publication.
-
•
NA27 (86) The published systematic error of the D charged cross-section is 0.4 b, a value quoted as being mostly due to uncertainties in the branching ratio. However, the uncertainty due to the branching ratio, on its own, would already give an error of 1.3 b. We presume that there was a misprint in the original publication and updated the systematic error to 1.4 b.
- •
-
•
NA32 (88), NA32 (91) The neutral D mesons are identified in two decay channels. Their relative contribution was estimated according to
where 2body and 4body stand for the 2- and 4-body decay channels, listed in Table 3. is the total number of reconstructed D mesons, the integrated luminosity, the cross-section for D meson production, the acceptances, and the branching ratios. The relative populations of 2-body and 4-body decays are then determined to be 39 %/61 % for NA32 (88) and 23 %/77 % for NA32 (91). The corrections on the branching ratios were then performed according to these weights.
-
•
E653 (92) Several decay channels contributed to the detection of the neutral D mesons, but we only corrected the branching ratios of those contributing the most, listed in Table 3.
While most of the results obtained with proton beams were published for the full range, those obtained with pion beams were published for the positive range, with the exception of NA11, which assumed a symmetric distribution for the extrapolation. This measurement should be taken with care. NA11 was the predecessor of NA32 and used a “prototype version” of the experimental apparatus. NA32 used significantly upgraded detectors and performed a much more accurate measurement, with the same pion beam and at the same collision energy.
| Experiment | ||
|---|---|---|
| [GeV] | [b] | |
| p beam, full | ||
| NA32 (88) | 200 | |
| E769 (96) | 250 | |
| NA16 (84) | 360 | |
| NA27 (88) | 400 | |
| E743 (88) | 800 | |
| E653 (91) | 800 | |
| HERA-B (05) | 920 | |
| beam, | ||
| NA11 (86) | 200 | |
| NA32 (88) | 200 | |
| E769 (96) | 210 | |
| NA32 (91) | 230 | |
| E769 (96) | 250 | |
| WA92 (97) | 350 | |
| WA75 (92) | 350 | |
| NA16 (84) | 360 | |
| NA27 (86) | 360 | |
| E653 (92) | 600 | |
| beam, | ||
| E769 (96) | 250 | |
In Table 6 we summarise the derived values for the total production cross-sections. The p-A values are given for full phase space while the -A results are given for the positive hemisphere. To obtain the total production cross-section, besides adding the measured neutral and charged D meson values, we must take into account the production of other charmed hadrons (Ds, and other charmed baryons and charmonia states). Only NA32 and E769 also measured the Ds and hadro-production cross-sections [34, 39, 64], but with very poor statistics. Assuming that the fragmentation fractions are universal, we can use e+e- or p data. World averages of results obtained by CLEO, ARGUS, H1, ZEUS and the four LEP Collaborations show that neutral and charged D meson production represent % of the total charm production cross-section [65]. This value is well reproduced by the Pythia Monte Carlo event generator. Note that the D meson cross-sections compiled in Tables 4 and 5 refer to the sum of the particle and anti-particle values.
The proton measurement of NA32 was not listed in the previous tables because only the total D meson cross-section was published [33], not separating the charged and neutral states. The quoted number was scaled up by the factor 1.15 mentioned above. The factor 2 explicitly shown in the table converts the published positive value to full , for consistency with the other proton beam measurements. The rather big statistical uncertainty is due to the fact that only 9 events were observed. Also WA75 published [28] a charm production cross-section without separating the neutral and charged contributions, from 339 pion-emulsion events observed in the window . The published p value, b/nucleon, for full , was derived assuming an scaling with . The value included in Table 6 was recalculated assuming . It was also divided by 2 so that it roughly corresponds to the window, for consistency with the other measurements. The published systematic errors of these two measurements, by NA32 and WA75, are underestimated, since they ignore the uncertainty on the branching ratios. Not enough information exists in the original publications to calculate a proper error or to update the values using the most recent branching ratios.
5 Data on open beauty production
The available measurements on beauty production were collected over the last 15 years. Besides the fixed target experiments, with energies within GeV, UA1 and CDF measured the beauty cross-section at the much higher energies of p colliders, GeV and 1.8–1.96 TeV, respectively. Since fixed-target experiments barely have the minimum energy required for beauty production, the cross-sections are very small, only a few nb, and very selective triggers are needed in order to observe even a few beauty events. In most cases this was achieved by triggering on high single muons or dimuons. Looking at inclusive muonic decays, as was done by the older experiments, has the advantage of exploring rather large branching ratios, 10 %. The new experiments explored the beauty decay into J/ by measuring the fraction of J/’s with a minimum offset with respect to the interaction point, which has the advantage of having a well understood reference process for normalisation purposes and is much more robust with respect to backgrounds: B decays are the only source of displaced J/ mesons, while there are several sources of single muons. These experiments, hence, complemented a muon spectrometer with a vertex detector to reconstruct the secondary vertices, profiting from the B mesons’ long lifetimes. All experiments, except one, reported cross-sections for a global mixture of all different beauty hadrons, B+, B-, B0, , , , b-baryons, etc, with a priori unknown relative fractions. The exception is the single B+ meson cross-section obtained by CDF in Run I, from a measurement of charged B mesons.
| Experiment | Beam | Target | Phase space window | events | ||
|---|---|---|---|---|---|---|
| [GeV] | ( in GeV/) | |||||
| NA10 | [25] | 286 | W | ; selection cuts | 14 | |
| WA78 | [27] | 320 | U | ; selection cuts | 73 | |
| E653 | [38] | 600 | emulsion | |||
| E672/E706 | [43] | 515 | Be | |||
| WA92 | [50] | 350 | Cu | 26 | ||
| E789 | [45] | p | 800 | Au | 00.1, 2 | |
| E771 | [47] | p | 800 | Si | 0.50, 6 | 15 |
| HERA-B | [57] | p | 920 | C, Ti, W | ||
| UA1 | [41] | p GeV | , | 2859 | ||
| CDF Run I | [53] | p TeV | , | |||
| CDF Run II | [55] | p TeV | 38078 | |||
Table 7 shows the available measurements of beauty production, the phase space covered and the number of identified events. Rather than updating the older measurements with the most recent knowledge on branching ratios, an issue of minor importance when compared to the other uncertainties involved and the large statistical errors, we prefer to emphasise that many experiments relied on theoretical models to determine the published cross-sections. This is necessary because of the limited phase space coverage of the detectors. Often very different models were used, giving different extrapolation factors to obtain the total (full phase space) cross-sections. Only the E653, WA92, E771 and HERA-B experiments cover around 90 % of full phase space and, thus, are less sensitive to theoretical assumptions.
The first beauty hadro-production cross-section measurement, by NA10, was published in 1988 [25], before QCD calculations were developed in detail, so that they used a rather simple production model. NA10 also provided another cross-section value, lower by 30 %, obtained by using different and distributions for the 4 extrapolation. The second beauty hadro-production measurement, made by WA78, is in good agreement with the NA10 result, if the same production model is used [27]. However, when WA78 uses a LO QCD calculation the two results differ significantly, even though the measurements were performed at almost the same energy.
During the past 20 years, the theoretical understanding of beauty production has significantly evolved and the experiments profited from this progress when analysing their data. Since they were performed over a long time span, each experiment used a different calculation (Pythia Monte Carlo generator, NLO calculations with several settings, etc), and it is highly non-trivial to “normalise” all the available measurements to one common production model. Such an update would require knowing in detail all the kinematical cuts used and having the measured values before extrapolating to full phase space, something not published by all experiments (or we would need to start from the published full phase space cross-sections and undo the extrapolations made in the original analyses, if we could have access to the codes used at that moment). It is always better when the experiments publish their results in a form which closely reflects the measurements made, in terms of phase space window and particles measured. Extrapolations to full phase space, as well as “deconvolutions” of the experimental data to the bare heavy quark level, will be biased by theoretical prejudice [66].
| Decay channel | Experiment | BR used [%] | BR (PDG04) [%] | |
| UA1 | [67] | |||
| , | UA1 | [68] | ||
| E672/706 | [69] | |||
| E789 | [70] | |||
| UA1 | [68] | |||
| E672/E706 | [71] | |||
| E789 | [70] | |||
| CDF I | [72] | |||
| NA10 | [73] | |||
| WA78 | [27] | |||
| NA10 | 11 | [25, 74] | ||
| WA78 | 10.4 | [27] |
| Experiment | Phase space window | |||
| ( in GeV/) | [nb] | [nb] | ||
| NA10 (88) | [25] | — | — | |
| WA78 (89) | [27] | — | — | |
| E653 (93) | [38] | — | — | |
| E672/706 (95) | [43] | |||
| WA92 (98) | [50] | — | — | |
| E789 (95) | [45] | , | — | |
| E771 (99) | [47] | — | — | |
| HERA-B (06) | [57] | |||
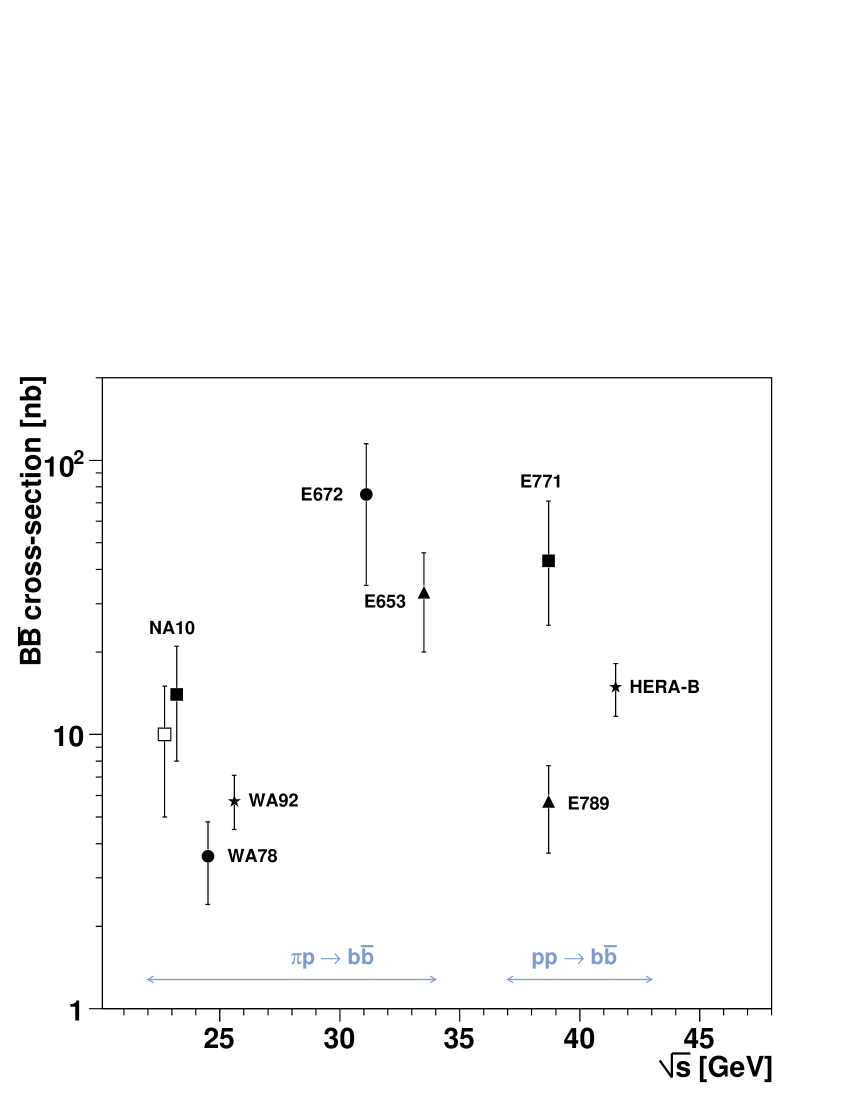
Table 8 collects the various decay modes in which the B mesons were looked for, with the corresponding branching ratios, as used by the different experiments and as given in the PDG 2004 tables. HERA-B and CDF II used the PDG 2004 values, while E771 used the default values of Pythia. E653 is not listed since it reconstructed a different decay channel for each of its 18 B mesons… Also WA92 explored several different event topologies, taking the branching ratios from the PDG 1996 tables [75].
In Table 9 and Fig. 11 we summarise the pair production cross-sections measured in fixed-target experiments, as taken from the original publications. Like in the charm sector, all experiments assumed a linear scaling of the beauty production cross-section with the mass number of the target nucleus to extract the elementary hadron-nucleon production cross-section, irrespective of the phase space window where the measurement was made.
We will now describe the models used to evaluate detector acceptances and efficiencies, and to extrapolate the measured cross-sections to the full phase space values compiled in Table 9 and Fig. 11. We also mention some selection cuts applied on the kinematics of the detected decay products, often not easy to relate with the B mesons’ kinematical distributions.
-
•
NA10 (88) The NA10 Collaboration measured the cross-section by triggering on dimuons and looking for a third muon in the offline analysis. This decay pattern is obtained when both B mesons decay through the semi-muonic channel, , and one of the D mesons also decays into a muon. An offline cut of GeV/ was required for two out of the three muons. At the times of NA10 (the article was submitted in 1987) the theory of beauty production was not yet developed in detail and a simple model was used with the following characteristics: the pair is assumed to be the only decay product of an intermediate state with the mass of the . This state is produced at mid-rapidity with a gaussian distribution in mass, with a width depending on the centre-of-mass energy [76]. The kinematical distributions were taken to be . The general features concerning the B and D meson decays were taken from Ref. [77]. In order to compute the cross-section, beauty branching ratios were taken from the PDG 1986 tables [73]; the value BR() = 11.0 % was deduced from Ref. [74], assuming that D mesons are 75 % neutral and 25 % charged. With these assumptions, a cross-section of nb/nucleon at GeV was obtained. Alternatively, when NA10 used the and distributions of Ref. [78], a cross-section of nb/nucleon is derived. In both cases only the statistical error is given.
-
•
WA78 (89) The WA78 Collaboration explored the same decay modes as NA10, with and , triggering on two or more muons. 68 candidates (including an expected background of 5.2 events) were found in the “like-sign” dimuon events passing the following requirements: GeV, GeV/, GeV, where is the total energy deposited in the calorimeter. Another 11 candidates (including 1.1 estimated background events) were found in the “three muon sample”, with GeV and GeV/. Two theoretical models were used to extract the production cross-section. The first one was a “LO QCD model”, based on the calculations outlined in Ref. [79], with , where and are the Feynman of the b and quarks and their transverse momentum, with (GeV/)2. From the 2-dimensional distribution given by the model, the single b quark distribution could be represented by , with . In order to evaluate the sensitivity of the results to the mean value of , its value was changed from to 0.05, increasing the cross-section value by 25 %. In order to compare the WA78 results to those of NA10, also the “NA10 model”, described above, was used to extract the cross-section, yielding a value higher by a factor of 3.8, due to the very different distributions assumed in the two models. The B meson decays were simulated with the Lund Monte Carlo program. If WA78 uses the “NA10 model”, the two measurements are in good agreement, but when the QCD-based production model is used, which seems to provide a better description of the observed distributions, the agreement suffers significantly. The B0’s in the observed event sample were an unknown mixture of B and B. Apart from using different production models, also three different values for the mixing parameter were explored, , 0.1, 0.2. In the PDG 2004 edition [62] the value for the mixing parameter for an unknown mixture of B meson species is . Therefore, out of the 8 different values given in the publication for the production cross-section, we retained the one corresponding to and the LO QCD model, nb/nucleon. The systematic error, which is higher than the statistical one, includes uncertainties on the acceptance and track reconstruction efficiency calculations, on the absolute normalisation and on the branching ratios.
-
•
E653 (93) The E653 Collaboration searched for beauty candidates by looking at topological events with muonic secondary vertices and an associated high muon ( GeV/). The and distributions of the reconstructed 18 beauty mesons were compared to LO [79, 80] and NLO [81, 82, 83] QCD calculations, and to Pythia [84]. Within statistical errors, all models gave a satisfactory description of the experimental data and their differences resulted in a 10 % systematic uncertainty in the shape of the differential cross-section. Other sources of systematic uncertainties include the luminosity calculation (5 %), the semi-muonic branching ratio (8 %), the detection efficiency model (7 %), and others (10 %).
-
•
E672/E706 (95) The E672/E706 Collaboration studied the decay. The evaluation of acceptances and detection efficiencies of beauty hadron pairs was done using the MNR NLO calculations [83, 85], with hadron momenta equal to that of the parent quark, i.e. without smearing of the momenta due to fragmentation. In their phase space window, , they measured a cross-section of nb/nucleon, based on signal events and a background of . The systematic error includes uncertainties in the normalisation (13 %), branching ratios (13 %), b quark production, hadronisation and decay properties (16 %), and reconstruction efficiencies (18 %). The extrapolation to full phase space was done using the MNR NLO calculations [85] but the systematic error also reflects the use of alternative distributions [38, 79] in the extrapolation.
-
•
WA92 (98) The WA92 Collaboration classified the beauty candidates in three samples, according to the event topologies. The first class, composed of semi-muonic decays, had 12 candidates. The second class collected 12 multi-vertex events, given the large decay multiplicity of beauty events. In the third class, the decay channel was investigated, giving 5 candidates. To evaluate the acceptances, Pythia [86] and Jetset [87] were used with the EHLQ [88] parton distributions for the nucleons in the target and the Owens [89] PDFs for the incoming pions. The b quark fragmentation was simulated by Jetset, using the Lund string fragmentation model [16]. The PDG 1996 [75] branching ratios were used. The cross-section was then obtained from the three event samples individually, yielding compatible results: , and nb/nucleon. Combining these values gave an overall full phase space beauty cross-section of nb/nucleon. The systematic error includes a 6 % uncertainty from the luminosity calculation and uncertainties due to the acceptance and efficiency calculations, which were 9 %, 12 % and 17 % for the first, second and third event samples, respectively. The uncertainties in the branching ratios were not taken into account.
-
•
E789 (95) For the evaluation of acceptances and efficiencies, E789 took the and distributions of the b quarks from the MNR NLO model [90, 83]; the intrinsic transverse momentum was simulated with a Gaussian of sigma 0.5 GeV/. The b quark fragmentation was modeled with the Peterson fragmentation function [15], with [91], and the average lifetime of B hadrons was set to ps, as given in the PDG 1994 tables [70], which also provided the values of the branching ratios. The J/’s coming from decays were simulated with the momentum and decay angle distributions measured by the CLEO Collaboration. The measurement was carried out in the , GeV/ kinematical region, representing 15 % of the full phase space (value quoted in the original publication and reproduced by Pythia). Within this phase space domain, a cross-section of pb/(GeV/)2/nucleon was measured. The extrapolation to full phase space yielded a total cross-section of nb/nucleon. The systematic error is dominated by the evaluation of the luminosity (11 %), efficiencies (10 %), b quark production, hadronisation and decay models (8 %), fit of the mass spectrum (5 %), and J/ branching ratio (4 %).
-
•
E771 (99) The E771 Collaboration measured the production cross-section mainly from the semi-muonic decay of both B mesons, . Events in which one beauty hadron decayed through a J/, , also contributed to the evaluation of the beauty cross-section. The muons were detected in the range , and in order to pass the muon filter they needed to have GeV/ (or GeV/, in the angular region near the beam). We estimated, using Pythia 6.208, that this phase space window covers 88 % of full phase space. E771 evaluated acceptances and efficiencies using Pythia 5.6 and Jetset 7.3 [92]. For the semi-muonic decays, , the default Pythia branching ratios were taken. The main sources of systematic uncertainties concern the production model (10 %), the luminosity evaluation (5 %), the efficiencies (9 %), and the semi-muonic branching ratio (7 %).
-
•
HERA-B (06) To minimise the systematic uncertainties due to luminosity and efficiencies, HERA-B measured the production cross-section relative to the prompt J/ production cross-section. The J/ mesons due to decays of beauty hadrons were distinguished from those directly produced at the target thanks to the good vertex resolution, as done by other experiments. The b-content of the selected sample was confirmed by a lifetime measurement, based on the observed decay length. The beauty events were generated with Pythia 5.7 [93] and weighted with probability distributions obtained from NLO calculations [85, 81], using NNLL MRST PDFs [10], a b quark mass GeV/, and a QCD renormalisation scale . The colliding partons were assigned an intrinsic transverse momentum distributed according to a Gaussian with sigma 0.5 GeV/. The fragmentation was described by the Peterson function, with . The subsequent B hadron production and decay were controlled by Pythia’s default settings. The “prompt” J/ events were generated taking into account the differential cross-sections, and , measured by E771 in p-Si collisions, to properly consider nuclear effects (such as the “Cronin effect”). The reference J/ production cross-section, at the energy of HERA-B, was derived from a global analysis of all published J/ cross-section measurements, including the value measured by HERA-B, with the help of non-relativistic QCD calculations. A total beauty production cross-section of nb/nucleon was obtained by combining the analyses in the muonic and electronic channels of all collected data, and by extrapolating to full phase space the measurement made in the window (covering % of ). The overall systematic uncertainty is 14 %, mainly due to the branching ratio (8.6 %), the trigger and reconstruction efficiencies (5 %), the b production and decay model (5 %), and the prompt J/ production model (3.1 %).
At collider energies, two experiments, UA1 and CDF, measured beauty production cross-sections in p collisions. Before we mention specific numerical values, we should clarify that the experiments are not consistent in the way they quote their measurements, referring to the production cross-sections of beauty mesons, beauty hadrons or beauty quarks, sometimes meaning the single flavour cross-section (only beauty, not anti-beauty), etc. Each paper accurately describes what was measured, but it is not trivial to get a consistent picture of all the measurements.
The UA1 Collaboration measured the beauty production cross-section at GeV, by combining four independent analyses [41] . For each of these analyses the systematic error was evaluated including uncertainties from the luminosity evaluation, acceptance and efficiency calculations, background estimation, and additional analysis-specific uncertainties. In order to relate the measured cross-sections to the production cross-sections of beauty hadrons, the Monte Carlo model ISAJET [94] was used, as described in detail in Ref. [95]. The Peterson fragmentation function was used, with (softer than the standard 0.006 value). Systematic errors due to this deconvolution include uncertainties on the fragmentation function (6 %), on the branching ratios and on the assumed shape of the b quark’s transverse momentum (20 %). The inclusive b quark and B hadron cross-sections for and , obtained in this way for each individual analysis, are summarised in Table 2 of Ref. [41]. The combined cross-section value, extracted for GeV/ and , was then extrapolated to full phase space using a NLO QCD calculation [90, 81], with factorisation scale and GeV/. The beauty cross-section extrapolated to was dominated by the “low-mass dimuon” and “J/” analyses, which used , , and GeV/. It gave a b quark (beauty only, not anti-beauty) production cross-section in the central rapidity range, , of b. Using the rapidity dependence predicted by the model, UA1 derived a total beauty production cross-section of b. The first error is due to the normalisation of the theoretical QCD shape to the data; the second error is due to the extrapolation to full rapidity, from uncertainties on the shape of the QCD curve.
In Run I, CDF obtained the beauty production cross-section at TeV by reconstructing the exclusive decay , selecting kaons of GeV/. For the evaluation of the acceptances, a Monte Carlo simulation based on a NLO QCD calculations [81, 82] was performed, using the MRST PDFs [96] and GeV/. The renormalisation and fragmentation scales were both set to . The hadronisation into B mesons was modeled with the Peterson fragmentation function, with . The decays were simulated using a modified version of the CLEO Monte Carlo program [97]. The B+ meson production cross-section was measured in the phase space domain GeV/ and , and was not extrapolated to full phase space. The value measured was b, the first error being the quadratic sum of the statistical and -dependent systematic errors, while the second is the same for all bins. The main contribution to the systematic error is the uncertainty on the (combined) branching ratio (10.2 %). Other sources of systematic uncertainties include the luminosity evaluation, the influence of in-flight kaon decays, and -dependent trigger efficiencies. From the theoretical side, dependent uncertainties were estimated due to the QCD renormalisation scale and to the Peterson parameter, . Meanwhile, the uncertainty on the combined branching ratio decreased from 10.2 % to 4.3 %, so that in this case an update would decrease the overall systematic error (see Table 8). Note that the published value is the B+ production cross-section, obtained dividing by 2 the sum of the B+ and B- measurements. The production cross-section of beauty hadrons, of a single flavour (only beauty or only anti-beauty) would be a factor 2.5 higher, according to the PDG 2004 tables [62], where the B+ appears as being 39.7 % of all beauty hadrons produced, the rest being B0 (39.7 %), B (10.7 %), and b-baryons (9.9 %).
In Run II, at TeV, CDF searched for beauty decay topologies in 299 800 events with a reconstructed J/, leading to 38 078 beauty hadrons. For the acceptance evaluations, the simulated distributions (, , -vertex, offset, …) were compared to the reconstructed data and the input distributions tuned until there was perfect agreement between data and MC. For cases where the quality of the data is good enough, such an iterative procedure is the best possible method to evaluate acceptances, since it does not rely on theoretical inputs. Furthermore, since CDF did not extrapolate the measured cross-section to full phase space, no theoretical model was used at all. The systematic errors are, hence, entirely of experimental origin. Very detailed descriptions of the J/ and beauty analyses are given in Ref. [55]. The inclusive single B hadron cross-section is b. To be precise, this is the cross-section for one B hadron to be within the window, irrespective of where the second B is. We emphasise that this is the cross-section for the production of any beauty hadron (mesons and baryons; charged or neutral), but only beauty or only anti-beauty, not both flavours. Hence, this is the same numerical value as the pair cross-section, . It is also the same as the b quark pair cross-section, , since bottomonium production is negligible.
CDF observed [53] that the Run I measurement of the B+ production cross-section, for GeV/, was higher than the NLO calculations [81, 82], by a factor . However, Cacciari and Nason [98] pointed out that the discrepancy is not really due to the perturbative calculations of the cross-section but rather to the use of the Peterson fragmentation function with . Using smaller values of in the framework of a NLL (next-to-leading-log) calculation reduced the discrepancy to (including a better treatment of the theoretical error bars). For more information on this topic, see Refs. [98, 99]. It is worth mentioning that the Run II and Run I measurements agree with each other, when compared for GeV/.
To clarify the source of the disagreement between the CDF data and the NLO QCD calculation, the Tevatron ran for nine days at GeV [100], so that CDF could measure the ratio between the beauty quark production cross-sections at 630 and 1800 GeV. The UA1 measurement, at 630 GeV, had not shown a significant departure from expectations, but was affected by a larger uncertainty. It is obvious that, both experimentally and theoretically, it is much more accurate to obtain a ratio of cross-sections at two different energies than each of the absolute values, since many uncertainties cancel out. Given the very short beam time available, a highly efficient beauty finding algorithm had to be developed, using single moderate- muon triggers, combining the muon with a high- track and selecting the high-mass muon-track combinations with positive lifetime. The two data sets (630 and 1800 GeV) were as similar as possible, with all data collected between December 1995 and February 1996, and with identical online and offline event selections. The cross-section ratio was reported for of the beauty quark above 10.75 GeV/, because Monte Carlo simulations showed that 90 % of the reconstructed and identified beauty events have a above this threshold. The measured ratio, between the beauty quark production cross-sections for above 10.75 GeV/ at 630 and 1800 GeV, is , in very good agreement with the theoretical NLO QCD prediction [81, 90], as shown in Figs. 3 and 4 of Ref. [100]. The conclusion is that the disagreement between the CDF data and the NLO QCD calculation is essentially the same at 630 GeV and at 1800 GeV. It can also be seen that the CDF beauty cross-section at 630 GeV, derived by combining the ratio with the absolute value measured at 1800 GeV, and extrapolated from to , is about a factor 2 higher than the value of UA1, for roughly the same range, as shown in Fig. 5 of Ref. [100].
6 Pythia calculations versus data
After having collected and revised the open charm and open beauty production cross-sections measured by many experiments, we will now compare them with theoretical calculations made using the Pythia Monte Carlo event generator [11].
Our first motivation is to describe the energy dependence of the measured production cross-sections, so as to calculate the values expected for energies relevant to recent or on-going experiments at the CERN SPS (NA60) and at RHIC (PHENIX and STAR). However, the yield of D or B mesons to be expected in a given detector depends not only on the production cross-section but also on the kinematical distributions of the single mesons, on the pair correlations, etc. Therefore, we will also see in this section how the results of Pythia compare to the available differential data, and how sensitive they are to changes in certain settings.
Pythia is an easily accessible tool which has been and continues to be extensively used by many experiments interested in heavy flavour production (to evaluate acceptances, efficiencies and other important elements of the data analyses procedures). It may very well be, however, that better calculations of heavy flavour production, in one or another aspect, are provided by other computer codes, such as Herwig [101], ISAJET [94], MC@NLO [102], or MNR NLO [85, 81]. Surely, a work similar to the one we present in this section could and should be made using those other theoretical models.
In some of our calculations, we varied the set of PDFs, the mass of the charm quark and the definition of the scale, as will be explained below. The intrinsic transverse momentum of the colliding partons, , was generated according to a Gaussian distribution with a width determined by the parameter PARP(91): . This expression is often written as , defining PARP(91) as . We used the Lund string fragmentation scheme [16], modified for heavy flavoured quarks by Bowler [17], which provides a good description of the high-precision data obtained by the SLD, ALEPH, DELPHI and OPAL Collaborations [103].
We generated charm and beauty events setting and 5, respectively, to ensure that every generated event has a (or ) pair. This is particularly important when simulating collisions at relatively low energies, where heavy flavour production is a rare process. Besides the LO diagrams (quark-antiquark annihilation and gluon fusion, see Section 2), the calculations also include initial and final state radiation. However, they do not include “flavour excitation” and “gluon splitting” diagrams. These can also be generated by Pythia, but only in the context of a full minimum bias generation (), a very inefficient operation mode at low collision energies (see Refs. [104, 105] for details). The absence of higher-order diagrams is (partially) compensated with scaling up the calculations by empirical K-factors, under the hypothesis that the kinematical distributions do not change significantly between leading and higher-order diagrams.
6.1 Absolute production cross-sections
As a first step, we used Pythia’s default values for the mass of the c quark ( GeV) and for the definition of the scale, while varying the set of parton distribution functions. For the proton PDFs we used the CTEQ6L (2002) [9], MRST LO (2001) [10] and GRV LO (1998) [106] sets. Since NLO PDFs have also been used with Pythia in the past, despite the inconsistency resulting from the fact that Pythia does not include higher-order diagrams, we have also used the CTEQ6M (2002) and MRST c-g (2001) sets for the extraction of the K-factors. To describe the parton densities in pions we used the following sets: GRV-P LO (1992), SMRS-P2 (1992), GRV-P HO (1992) and ABFKW-P Set 1 (1989). As indicated by the year, the available pion PDFs are considerably older than the proton PDFs. Furthermore, there is only one set of LO pion PDFs. For the simulations with beams we have used MRST LO (2001) to describe the target nucleons, since they were fit with a value, 220 MeV, similar to the values used in the PDFs, –231 MeV.
To easily compare the results obtained, we parameterised the dependence of the production cross-section with the expression
| (6) |
inspired by a formula commonly used to describe the energy dependence of J/ production [107]. The parameter was fixed to 0.35 in pp collisions and to 0.3 in p collisions, while the other parameters were adjusted to each specific set of PDFs. The calculated curves for neutral and charged D meson production in pp and p collisions are presented in Fig. 12, where they are compared to the corresponding experimental measurements, Tables 4 and 5, normalised to .
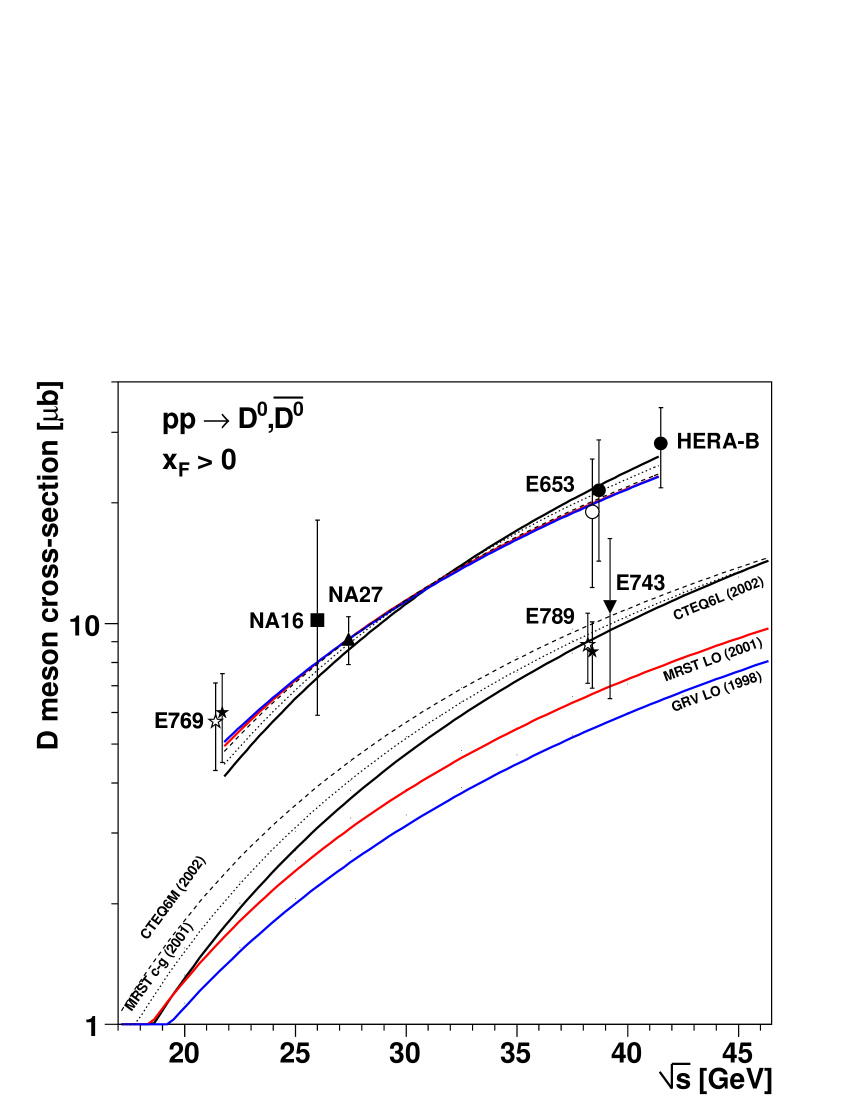
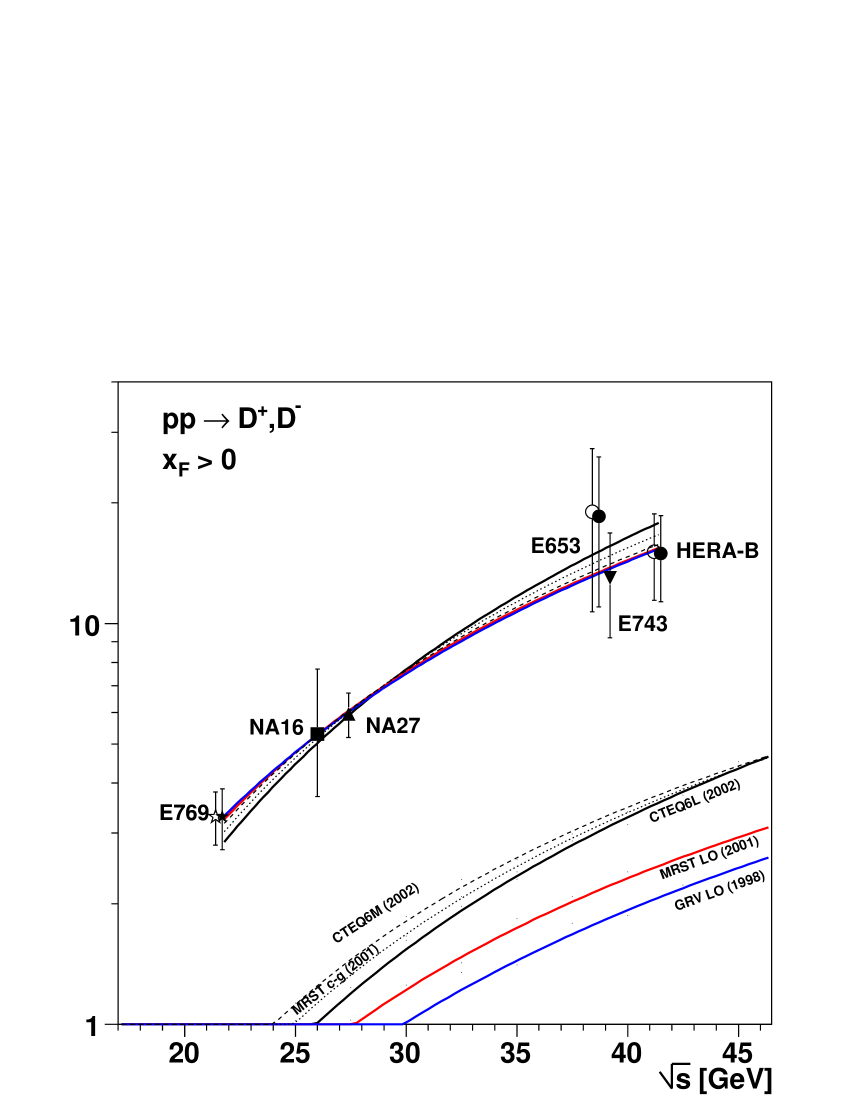
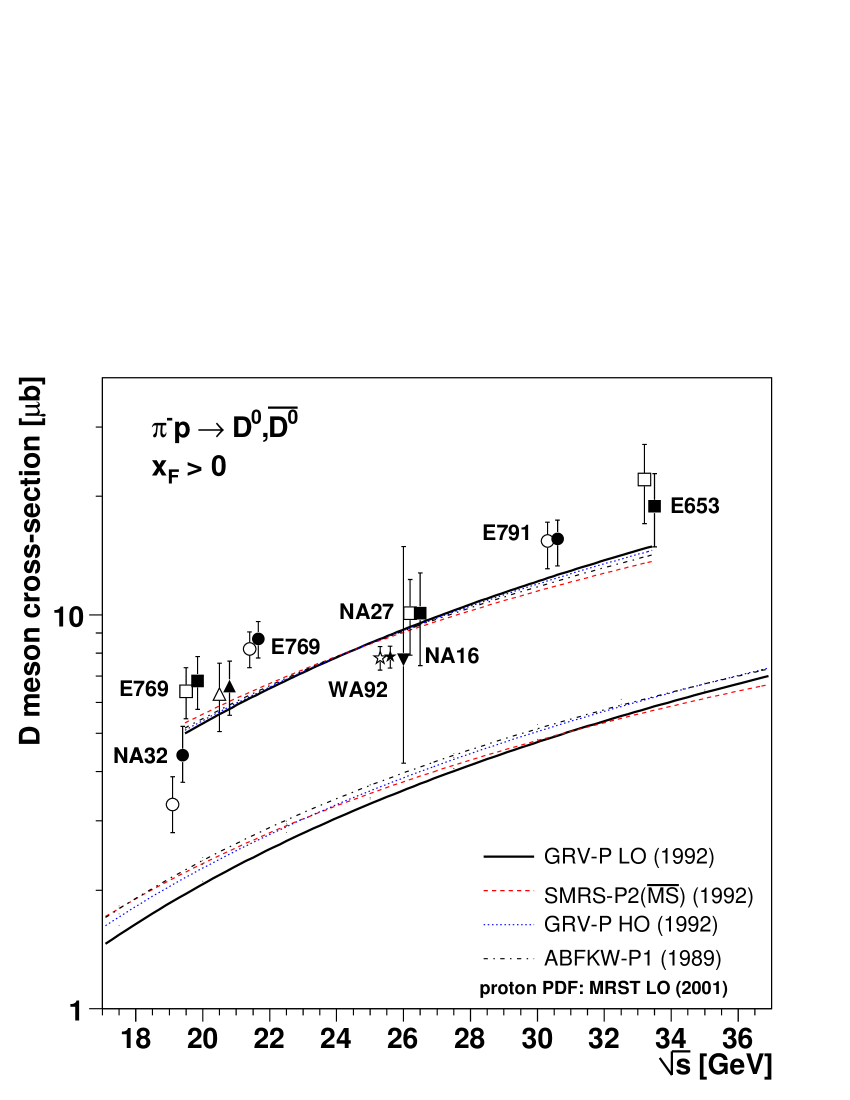
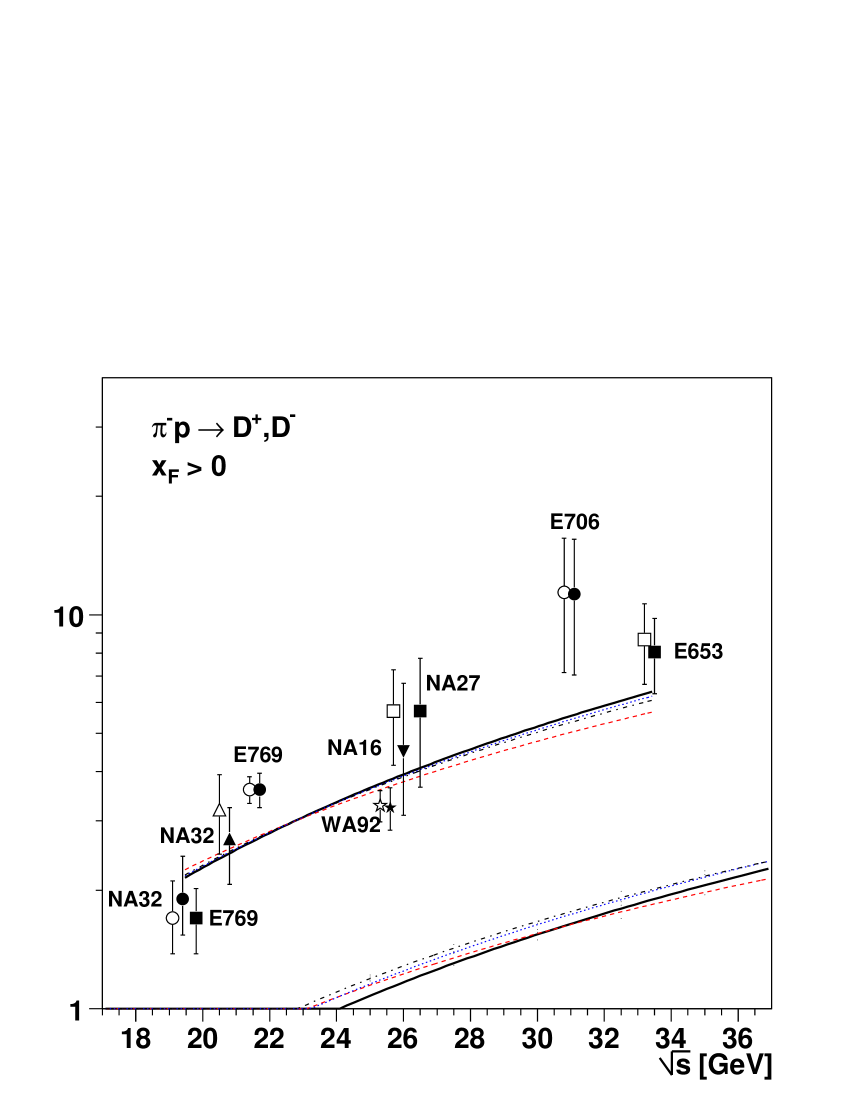
In several cases, the same measurement is represented twice, before (open marker) and after (solid marker) the corrections explained in Section 4. Note that the measurements of E743, E653 and E789 were all performed at GeV; to improve their visibility, they were slightly displaced in Fig. 12 (without affecting any calculations). The same is valid for the NA16 and NA27 p measurements, both performed at 360 GeV. Each curve appears twice in the figures, as directly calculated by Pythia and after being scaled up by a K-factor fitted to the data. The solid lines correspond to the LO PDF sets. The E789 p-Au measurement of the neutral D meson cross-section was not considered in the fitting of the K-factors, since it would have significantly deteriorated the quality of the fits, maybe because this measurement was made in an exceptionally small phase space window (, GeV/). We remind that the HERA-B measurement is still preliminary.
| p beam | ||
|---|---|---|
| CTEQ6L (2002) | 2.4 | 5.0 |
| MRST LO (2001) | 3.0 | 6.2 |
| GRV LO (1998) | 3.6 | 7.4 |
| CTEQ6M (2002) | 2.0 | 4.2 |
| MRST c-g (2001) | 2.2 | 4.6 |
| beam | ||
| GRV-P LO (1992) | 2.6 | 3.4 |
| SMRS-P2 () (1992) | 2.4 | 3.1 |
| GRV-P HO (1992) | 2.4 | 3.1 |
| ABFKW-P1 (1989) | 2.3 | 3.0 |
Using the appropriate K-factor for each curve, we can see from Fig. 12 that all of them describe the dependence of the data points within the experimental error bars. The reduced values of the fits are around 1 or lower for the proton data and around 2 for the pion data.
Table 10 shows the K-factors which best describe the four sets of data. To reproduce the measured data points, the K-factor required by the charged D mesons is significantly higher than the one needed by the neutral mesons. For instance, in pp collisions the CTEQ6L and MRST LO sets require K-factors around 5 and 2.5 for the charged and neutral D mesons, respectively. The significant difference between the charged and neutral D meson K-factors, required by the experimental data, indicates a problem in the probabilities used by Pythia when fragmenting the charm quarks into D hadrons: in 63 % of the cases, Pythia fragments the charm quarks into D0 or mesons, while the probability of producing D+ or D- mesons is only 20 % (the remaining charm quarks hadronise essentially into Ds or ). This is due to the larger feed-down contribution from D∗ decays to neutral D mesons. It is easy to derive the ratio between the charged and neutral D meson yields as given by Pythia; it follows directly from the assumption that the c quark has equal probabilities of fragmenting into the neutral and charged D (singlet) or D∗ (triplet) states, and from the numerical values of the branching ratios of the D∗ to D decays [62]:
| (7) |
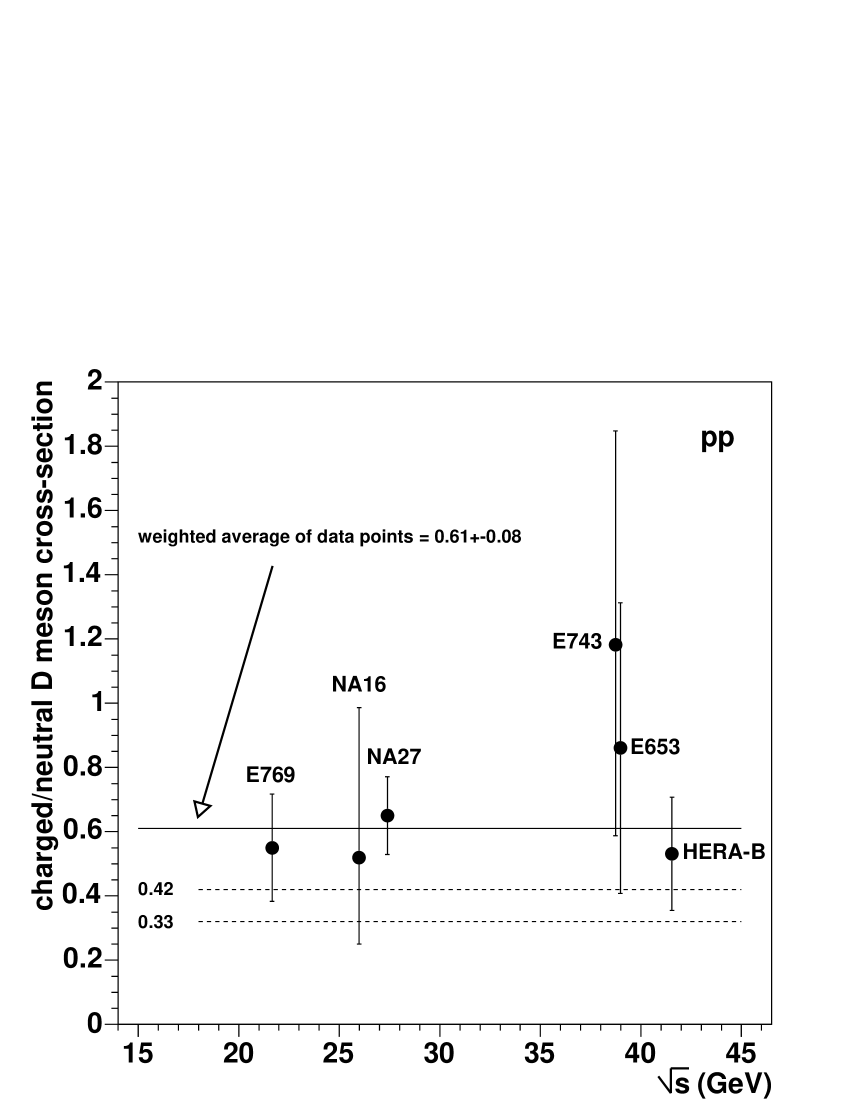
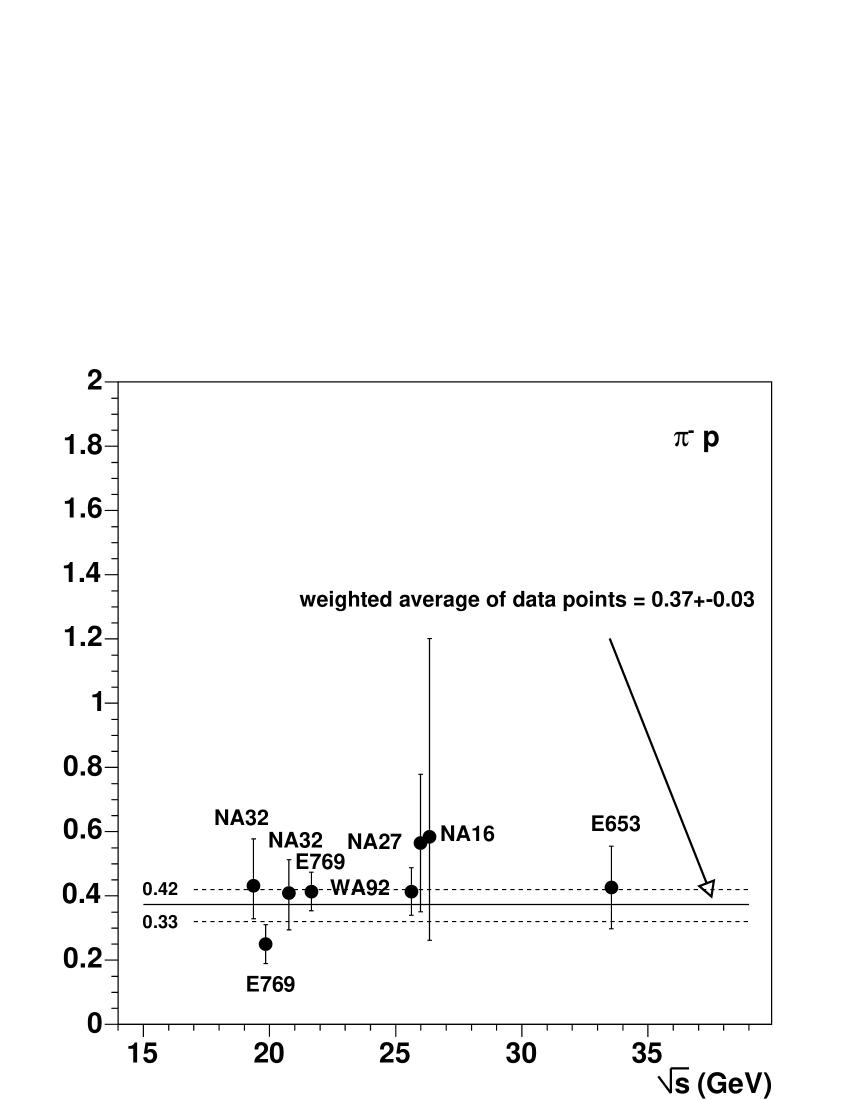
Figure 13 shows that this “expected value” is considerably lower than the ratios given by the hadro-production experiments which measured both charged and neutral D mesons. The average values of the measured ratios are in p-A, in p collisions, and if we merge both data sets. This discrepancy is due, at least in part, to the fact that (naïve) spin counting is not applicable to charm production: it would imply that the charm quark fragments into a vector state with a probability , while all available measurements (in hadro-production, photo-production, at LEP, etc) give a combined value of [108], as illustrated in Fig. 14. This is presumably because the mass difference between the D and D∗ mesons cannot be neglected, making the lighter D mesons more probable to be produced.
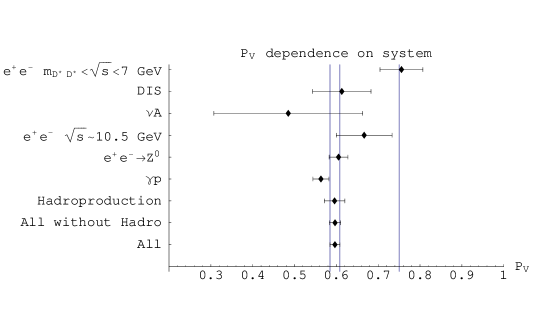
In Pythia, the value of is given by the parameter PARJ(13), which is 0.75 by default. Setting it to 0.6 provides a much better agreement with all the presently available measurements, as just mentioned, and increases the ratio between the charged and neutral D meson production cross-sections from 0.33 to 0.42.
We will now assume that the ratio between charged and neutral D meson production cross-sections is the same in proton and pion induced collisions, as suggested by the universality seen in Fig. 14 (and consistent with the left panel of Fig. 13, given the large error bars of the proton data). This means that we can use a common K-factor for charged and neutral D mesons, as long as we set . Table 11 gives the K-factors extracted in this way, for several sets of PDFs.
| PDF set | K-factor |
|---|---|
| CTEQ6L (2002) | 3.0 |
| MRST LO (2001) | 3.8 |
| GRV LO (1998) | 4.6 |
| CTEQ6M (2002) | 2.6 |
| MRST c-g (2001) | 2.8 |
It is unfortunate that, until now, Pythia uses the same parameter, PARJ(13), to also define the value for beauty production, where the value 0.75 seems to be appropriate. Indeed, measurements made by ALEPH, DELPHI, OPAL and L3 give an average value of [108]. It would be more useful to have different parameters for charm and for beauty, so that they could be given different values (as done for the u/d and s quarks, through the PARJ(11) and PARJ(12) parameters). This is not so crucial if the charm and beauty events are independently generated (with or 5, respectively) but becomes mandatory if we generate both heavy flavours simultaneously, as frequently done.
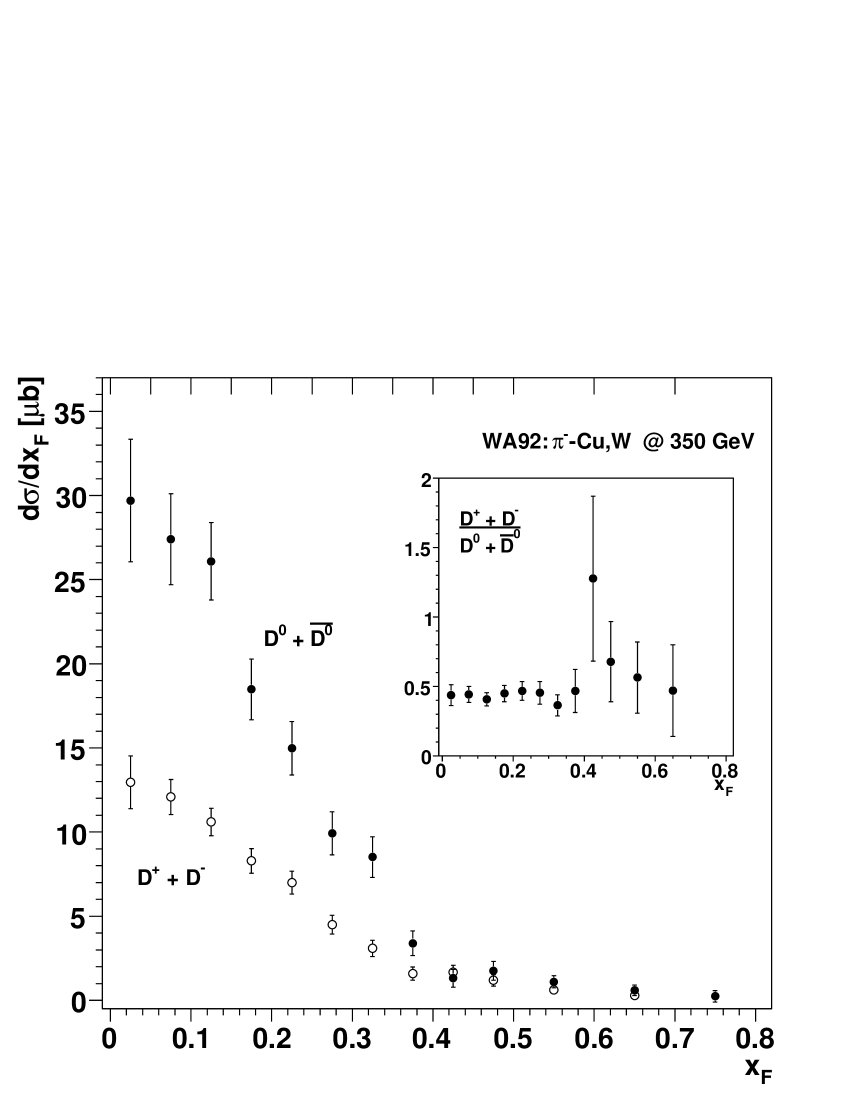
Figure 15 shows that the ratio between charged and neutral D meson cross-sections does not seem to depend on , according to the WA92 measurements [49]. This ratio also seems to be independent of the collision energy, when comparing measurements made by many experiments (see Fig. 13).
We will now concentrate on the total production cross-sections for pp collisions, in our evaluation of the influence of certain parameters on Pythia’s results.
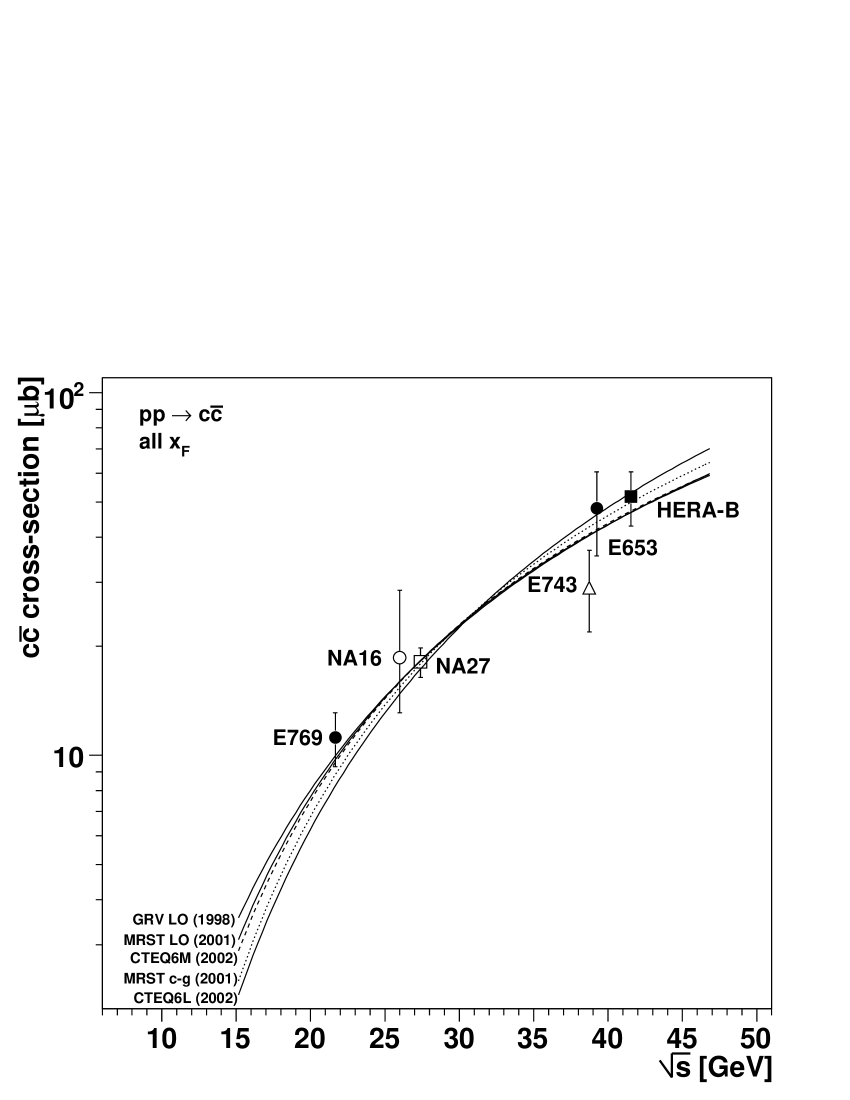
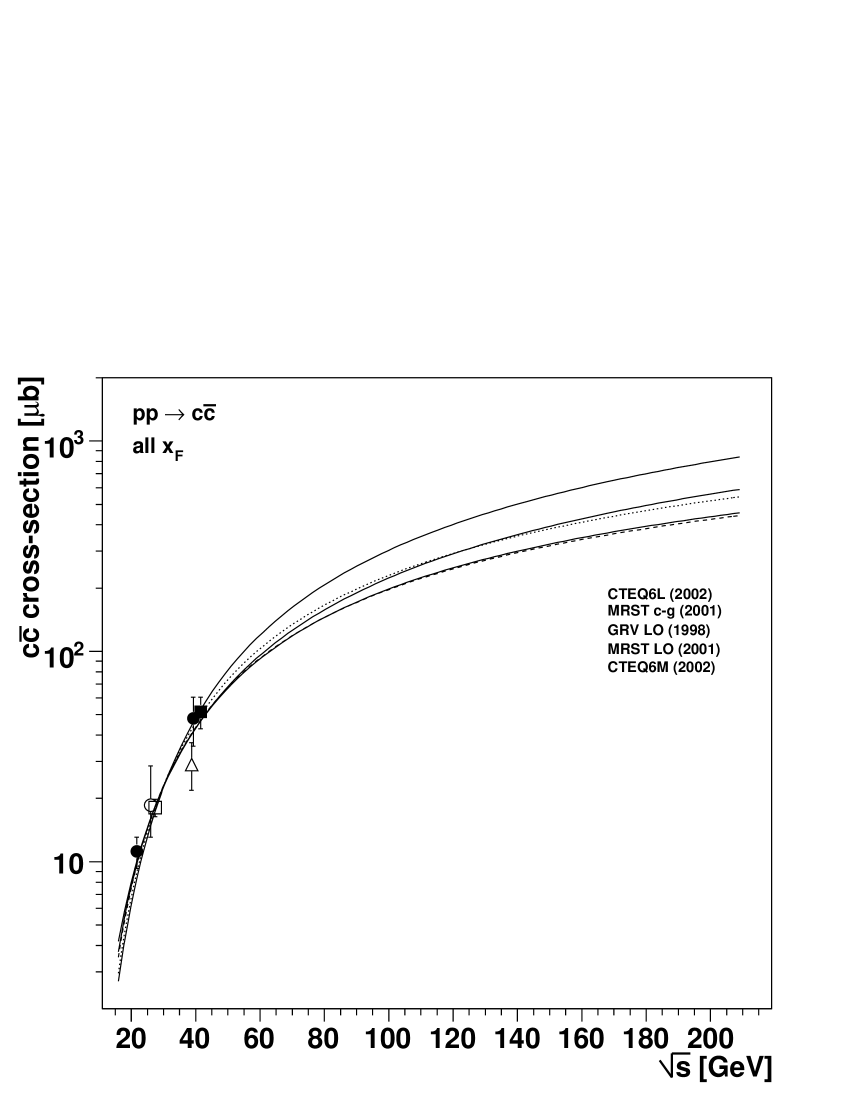
| b] | |||||
| PDF set | K-factor | /ndf | |||
| CTEQ6L (2002) | 3.0 | 1.4 | 3.6 | 17.5 | 803 |
| MRST LO (2001) | 3.8 | 0.7 | 4.8 | 18.4 | 439 |
| GRV LO (1998) | 4.5 | 0.7 | 5.2 | 18.3 | 563 |
| CTEQ6M (2002) | 2.5 | 0.7 | 4.6 | 18.4 | 427 |
| MRST c-g (2001) | 2.7 | 1.0 | 4.0 | 18.0 | 524 |
Figure 16 compares the measured production cross-sections with Pythia’s curves, obtained with five different PDF sets. The curves are labelled in the order, from top to bottom, in which they occur at and 200 GeV, in the left and right panels, respectively. The extracted K-factors for each PDF set are summarised in Table 12, together with the corresponding pp cross-sections for typical SPS and RHIC energies. At GeV, the calculated pp cross-sections vary between 440 and 800 b, if we only consider LO PDFs.
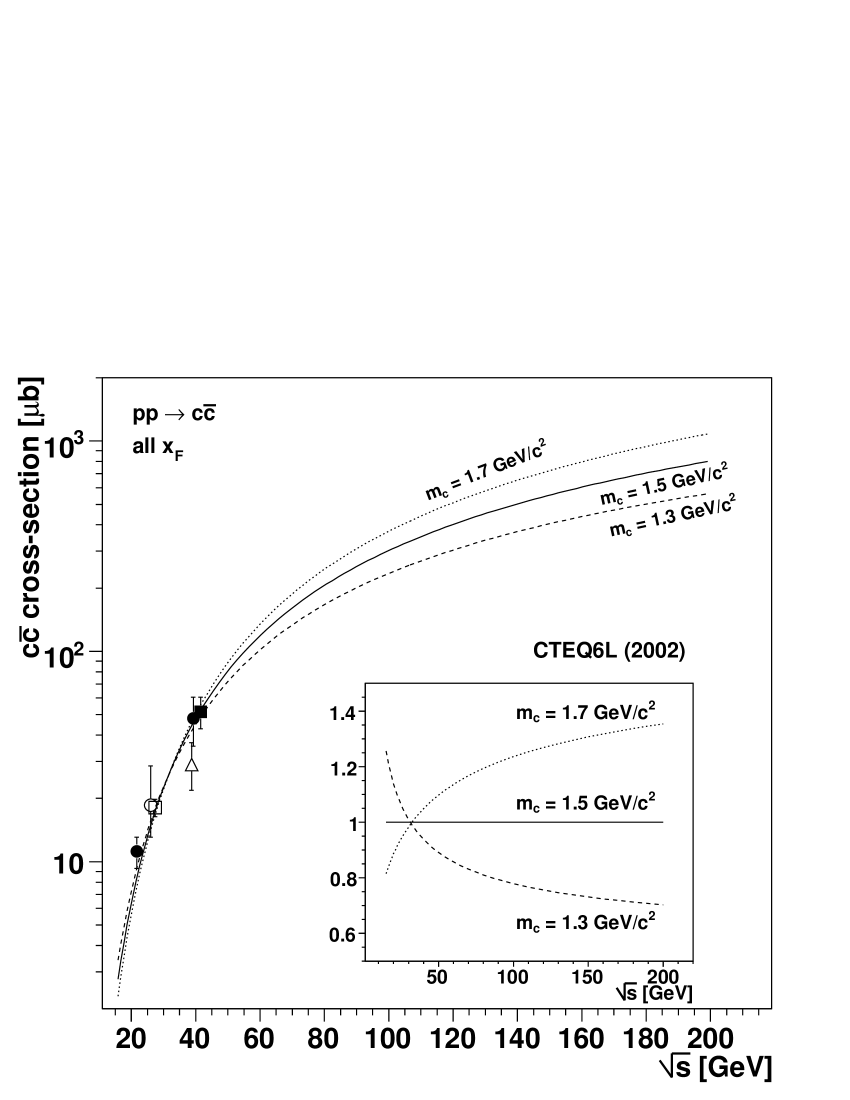
In a second step we studied the influence of varying the mass of the c quark by 15 % with respect to Pythia’s default. We used the CTEQ6L PDFs for these calculations, but other proton PDFs give similar results. Figure 17 shows the calculated production cross-section in pp collisions, using , 1.5 and 1.7 GeV, scaled up by the appropriate K-factor. While smaller values lead to higher calculated cross-sections, in particular at energies close to threshold, after the curves are normalised using the available fixed target data, and given the somewhat different shapes of the calculated curves, it turns out that at GeV the estimated cross-section is 35 % higher with GeV and 30 % lower with GeV, with respect to the default value. The results are summarised in Table 13.
| b] | |||||
|---|---|---|---|---|---|
| [GeV] | K-factor | /ndf | |||
| 1.3 | 1.2 | 0.9 | 4.5 | 18.1 | 569 |
| 1.5 | 3.0 | 1.4 | 3.7 | 17.5 | 811 |
| 1.7 | 6.6 | 2.0 | 3.2 | 16.9 | 1100 |
Different definitions of the squared energy-momentum transfer, , can be used. To evaluate the influence of this setting on our results, we replaced Pythia’s default, equivalent to in the processes we are studying, by , the choice of Refs. [109, 110]. Figure 18 shows the effect of using these two different definitions on the cross-section, keeping GeV and using the CTEQ6L PDFs.
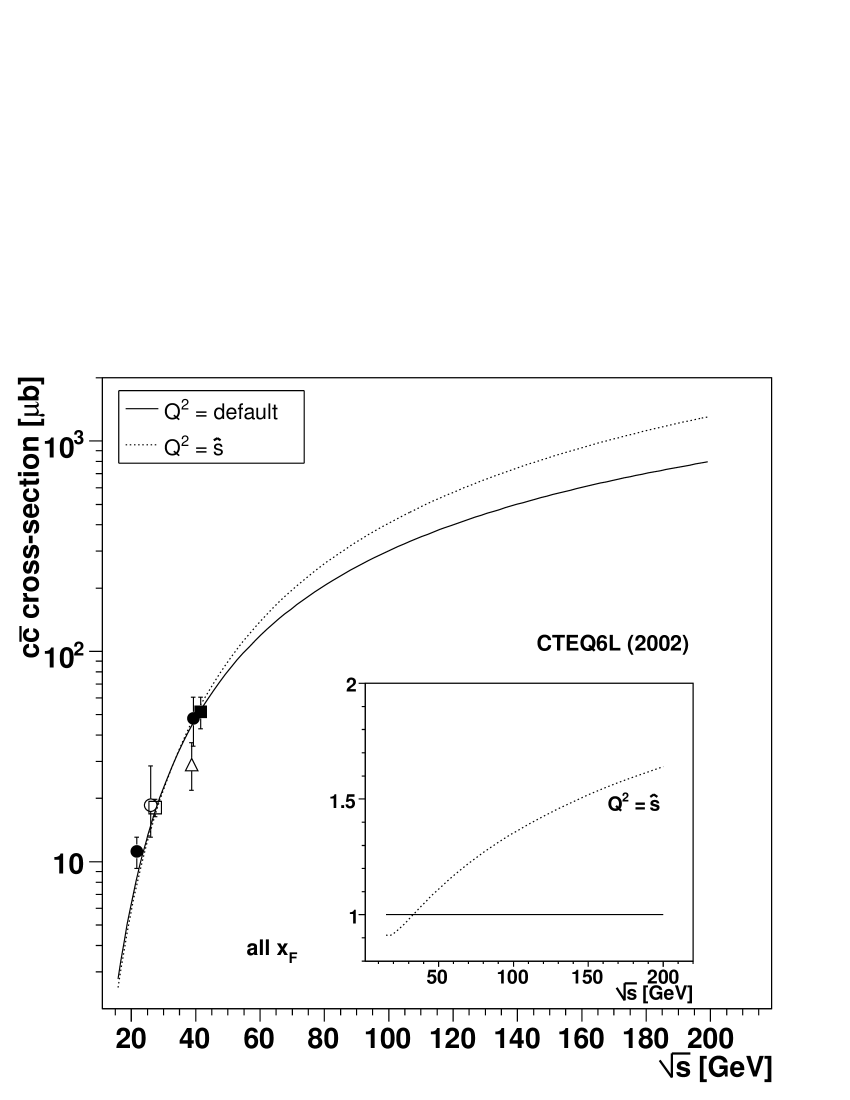
We see that using as the definition leads to significantly lower cross-sections with respect to the values obtained when using Pythia’s default setting. The difference is energy dependent: at low energies the cross-sections obtained with the definition are around 3 times lower, while at GeV the difference reduces to a factor of 2. Once the curves are scaled up to describe the data, the steeper rise with of the curve leads to 60 % higher cross-sections at GeV, with respect to the values obtained with the default setting. The results are summarised in Table 14. Calculations with other PDF sets give comparable results.
| b] | |||||
|---|---|---|---|---|---|
| definition | K-factor | /ndf | |||
| default | 3.0 | 1.4 | 3.8 | 17.5 | 808 |
| 8.8 | 1.9 | 3.4 | 16.9 | 1327 | |
These calculations show that the production cross-section at GeV, as derived from Pythia’s calculations normalised by the existing SPS, FNAL and HERA-B measurements, can vary by % due to the use of different sets of PDFs and by around % if the c quark mass is changed by %. Furthermore, using , as done by some experiments, leads to a 60 % higher cross-section at GeV. From Table 12, where we used the default c quark mass and definition, and only considering the values corresponding to the LO PDF sets, we obtain b as our best estimate for the cross-section at GeV. The uncertainties of the calculations for SPS energies are smaller. At and 400 GeV, we expect total cross-sections of b and b, respectively.
6.2 Single D meson kinematical distributions
In this section we compare measured D meson kinematical distributions to calculations done with Pythia. These distributions are sensitive to non-perturbative effects, such as the intrinsic transverse momentum which the partons carry before they collide and the fragmentation of the heavy quarks into hadrons.
Table 15 gives an overview of the experiments which measured and distributions of D mesons produced in p-A and -A collisions.
| Experiment | Beam | Target | particle | events | |
| [GeV] | |||||
| NA27 [21] | p | 400 | p | D0, | 29, 22 |
| D+, D- | 24, 27 | ||||
| D (non-leading) | 53 | ||||
| D (leading) | 49 | ||||
| NA32 [33] | p | 200 | Si | D | 9 |
| E743 [23] | p | 800 | p | D | 31 |
| E653 [36] | p | 800 | emulsion | D | 146 |
| WA82 [111] | p | 370 | Si, W | D | |
| E789 [44] | p | 800 | Au | D | |
| E769 [112] | p | 250 | Be, Al, Cu, W | ||
| CDF [54] | 1960 | p | D | ||
| D± | |||||
| D∗± | |||||
| D | |||||
| NA27 [113] | 360 | p | D | 57 | |
| NA11 [30] | 200 | Be | D | 29 | |
| NA11 [31] | 200 | Be | D- (leading) | 44 | |
| D+ (non-leading) | 30 | ||||
| NA32 [33] | 200 | Si | D (leading) | 54 | |
| D (non-leading) | 60 | ||||
| D∗± | 46 | ||||
| NA32 [34] | 230 | Cu | D0+, D± | 543, 249 | |
| D, D∗± | 60, 147 | ||||
| D (leading) | 427 | ||||
| D (non-l.) | 425 | ||||
| E653 [37] | 600 | emulsion | D | 676 | |
| WA75 [28] | 350 | emulsion | D | 459 | |
| WA82 [111] | 340 | Si, Cu, W | D | ||
| WA82 [114] | 340 | Si, Cu, W | D+ | ||
| D- | |||||
| E769 [112] | 250 | Be, Al, Cu, W | D | ||
| WA92 [49] | 350 | Cu, W | D | ||
| E706 [42] | 515 | Be, Cu | D± | 110 | |
| E791 [40] | 500 | C | D | ||
Some experiments separately give the distributions of “leading” and “non-leading” particles. A D meson is called “leading” if its c or quark combines with one of the non-interacting beam or target valence quarks. These quarks have in general a much higher momentum than a light quark from the sea, so that the formed D meson will have a visible (forward or backward) boost. In pp and p-A reactions the D- and are the leading particles. In induced reactions, for , the D- and D0 are leading. This purely non-perturbative (hadronisation) effect is properly described by the Lund string fragmentation model, as shown in Refs. [104, 105]. See end of next section for further information.
We will now focus on the and distributions of single D mesons. The E791 Collaboration measured the and distributions of neutral D mesons, produced in 500 GeV -C collisions [40]. This measurement represents by far the largest D meson data sample at fixed-target energies, with fully reconstructed neutral D mesons. Figures 5 and 6 of Ref. [40] show comparisons between the measured distributions and curves calculated with Pythia 5.7 and Jetset 7.4 [93]. With these code versions, of 1994, the calculations were unable to reproduce the measured distributions. On the contrary, the most recent version of Pythia, 6.326, describes quite well 111When we made calculations with version 6.325 we noticed that the resulting distributions were abnormally hard. T. Sjöstrand, main author of Pythia, immediately identified the problem, introduced in version 6.319, and sent us the solution, later on implemented in Pythia 6.326. the and distributions of E791, with PARP(91) between 1 and 1.5 GeV/, as can be seen in Fig. 19.
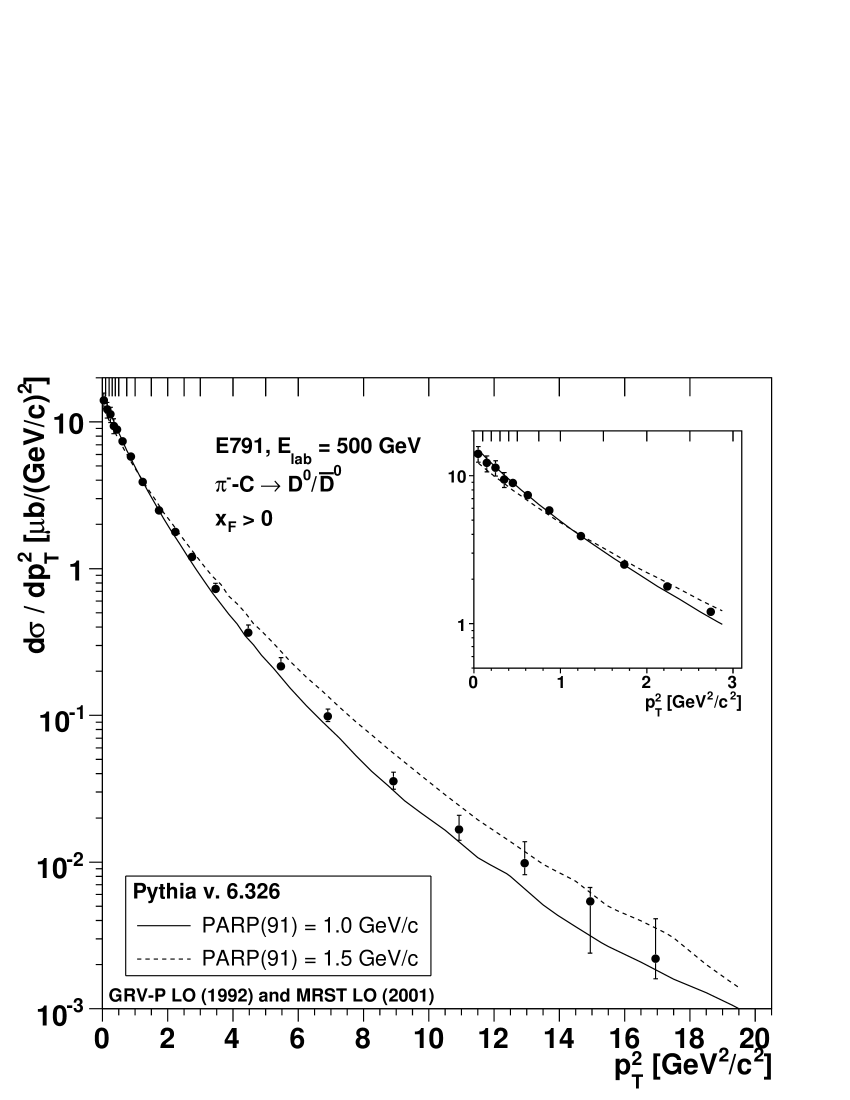
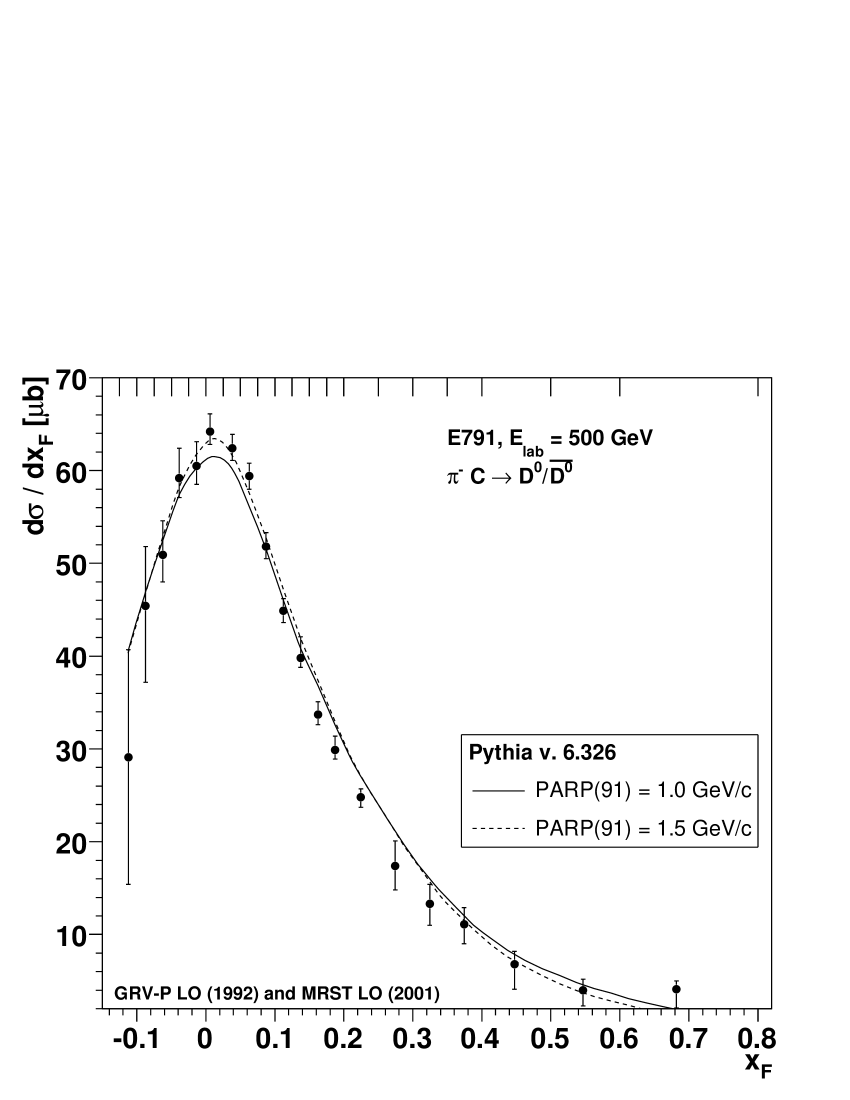
Note that from version 6.314 (Oct. 2004) onwards the default value of PARP(91) changed from 1.0 to 2.0 GeV/. The E791 calculations, made with version 5.7, used an even lower PARP(91) value, 0.44 GeV/. Also the default value of the c quark mass has changed, from 1.35 GeV/ in version 5.7 to 1.5 GeV/ in the latest versions. The data points in Fig. 19 were placed at values weighted by the function given in the original publication [40], rather than at the bin centre, following the procedure explained in Ref. [115]. The vertical lines at the top of the figures indicate the bin edges. The Pythia curves were scaled up by 2.6, the K-factor extracted from the fit to the neutral D meson measurements (see Table 10).
The highest statistics and distributions available for proton induced collisions were collected by the E769 Collaboration [112], at GeV. The event samples are rather small, nevertheless, and the distributions shown in Fig. 20 add together all measured D mesons (D0, D+, D and corresponding anti-particles), in data sets taken with Be, Al, Cu and W targets. The measured distributions are compared with calculations done with Pythia, version 6.326, using the default settings, except for PARP(91), which was set to 0.5, 1.0 and 1.5 GeV/ (and ). The K-factor was set to 3.8 (see Table 11).
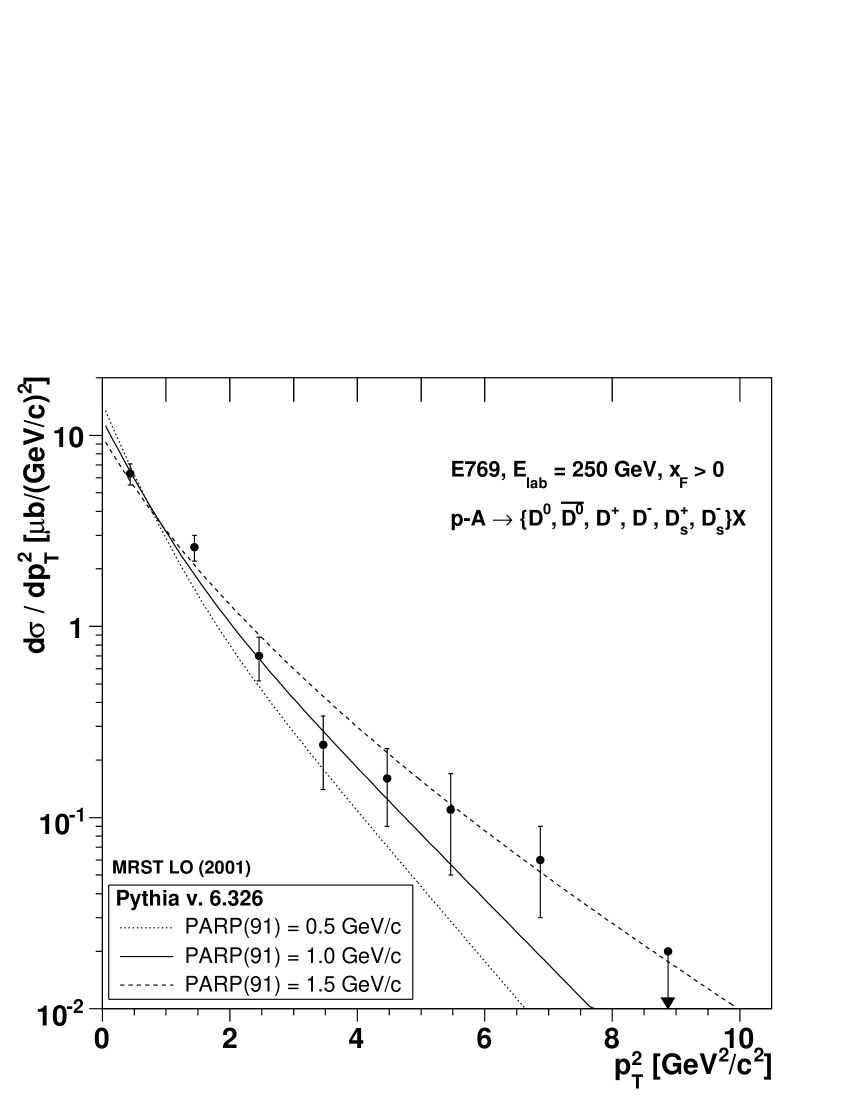
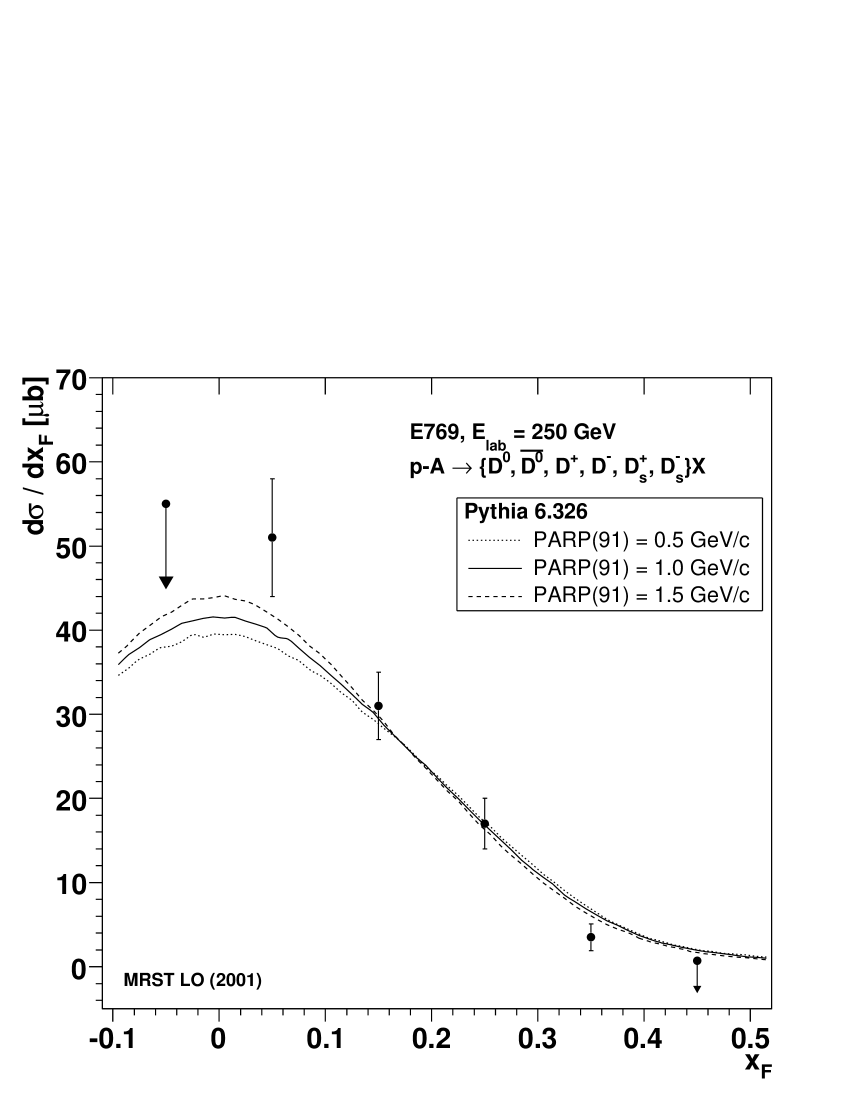
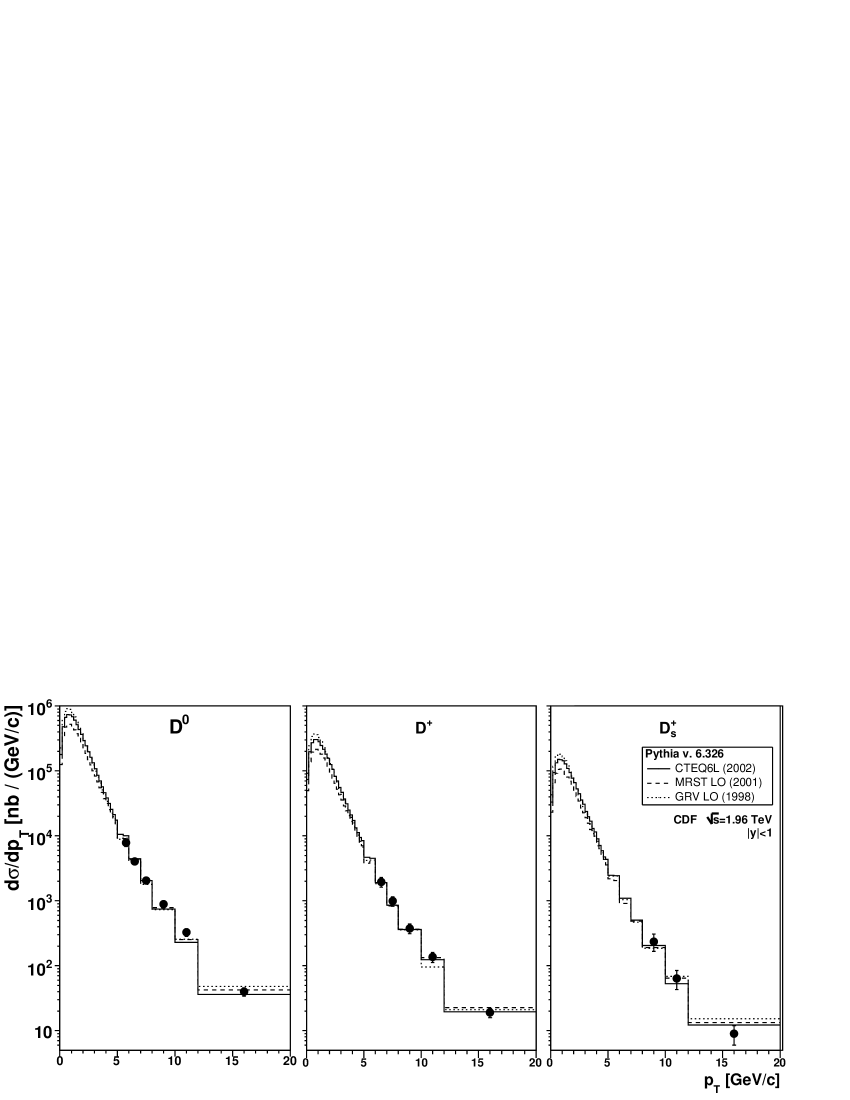
Figure 21 shows the D0, D+ and D differential cross-sections measured by CDF in collisions at TeV. Both D and mesons contribute to these single D meson differential cross-sections. The measurements are compared with Pythia curves, calculated with three different sets of PDFs, GeV/ and . The K-factors globally fitted to the three data sets are 3.3 (CTEQ6L), 5.8 (MRST LO) and 5.5 (GRV LO). In the case of the MRST LO PDFs, this represents a 50 % increase of the K-factor with respect to the value fitted from the fixed-target measurements, 3.8. This observation might indicate that at Tevatron energies the higher-order diagrams missing in our calculation are relatively more important than at the lower energies of the fixed-target data. However, the increase is only 10–20 % when we use the CTEQ6L and GRV LO PDF sets, which give production cross-sections with a steeper energy dependence. This exercise shows that the K-factors of Table 11 can be used in the estimates of charm production at the intermediate energies of the RHIC experiments, GeV, where such higher order effects, if any, must be even smaller than at the Tevatron energies.
In summary, we can say that the existing data on kinematical distributions of D mesons can be reasonably well reproduced by calculations made with the latest version of Pythia (6.326).
6.3 D meson pair correlations
LO diagrams lead to back-to-back pairs, with 180∘ as the difference of azimuthal angles of the quarks, , and zero pair transverse momentum, [116]. However, higher order diagrams, intrinsic and fragmentation lead to smeared and distributions.
In hadro-production, D meson correlations have been measured in the experiments NA27 [21, 117], WA75 [28, 118], NA32 [119], E653 [120], WA92 [49, 121] and E791 [122]. The correlation variables , , and are defined as the difference between the D and values: , etc. Also the pair variables , and have been studied. Out of the quoted experiments, E791 is the only one which fully reconstructed both D mesons in one of the channels (=1,2,3). In order to increase the statistical significance of their measurements, the other experiments looked for events with secondary vertices, characteristic of long-lived particles, irrespective of the reconstruction of the decay products. In our comparisons with calculations, we have only used data sets with reasonable statistics, as provided by NA32, WA92 and E791.
The WA92 Collaboration provided , , , , and distributions [49, 121], for 475 events collected in -Cu interactions at 350 GeV. One of the D mesons, with , was fully reconstructed in one of the channels (=1,2,3). The second one, which could have any , was often only partially reconstructed either due to undetected neutral decay products or to the limited detector acceptance. To calculate the correlation variables which require the momenta of the D mesons, the influence of the neutral decay products was estimated by imposing the D meson mass in the reconstruction step and by connecting the secondary and primary vertices. A Monte Carlo simulation showed that this estimation of the missing information gave a correct calculation of the correlation variables.
In NA32 both D mesons were only partially reconstructed. A purely topological analysis method selected 500 events with two reconstructed secondary vertices well displaced with respect to the primary vertex, resulting in , , , , and distributions, for , from data collected in 230 GeV -Cu interactions [119]. When there were neutral decays products, an algorithm similar to the one used by WA92 estimated the momenta of the D mesons, needed to calculate the correlation variables, except for and . The error on the estimated momentum was evaluated by a Monte Carlo simulation to be 15 %, having little impact on the reconstructed correlation variables of the D meson pairs.
The E791 experiment measured D meson correlations from data collected in 500 GeV -C and (a smaller fraction) in -Pt collisions [122], reconstructing both D mesons in one of the channels (=1,2,3). The published , , , , and distributions are based on events.
We will now compare the three experimental data sets with each other, for each of the measured correlation variables. We prepared Pythia curves for each data set, simulating -p collisions at the appropriate energy and properly applying the phase space cuts specific of each experiment. The WA92 results were given for full phase space, NA32 required that both D mesons were produced at , and E791 required that both D mesons were produced within , where is the rapidity in the centre-of-mass reference frame.
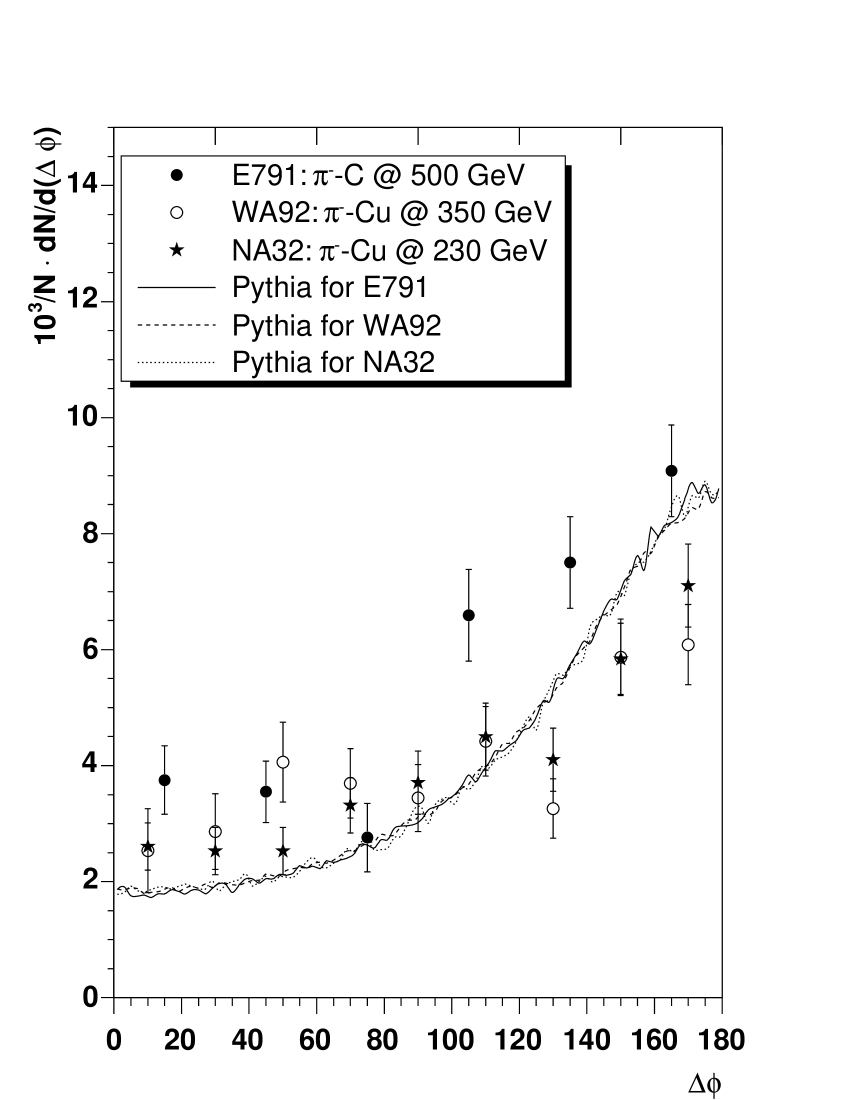
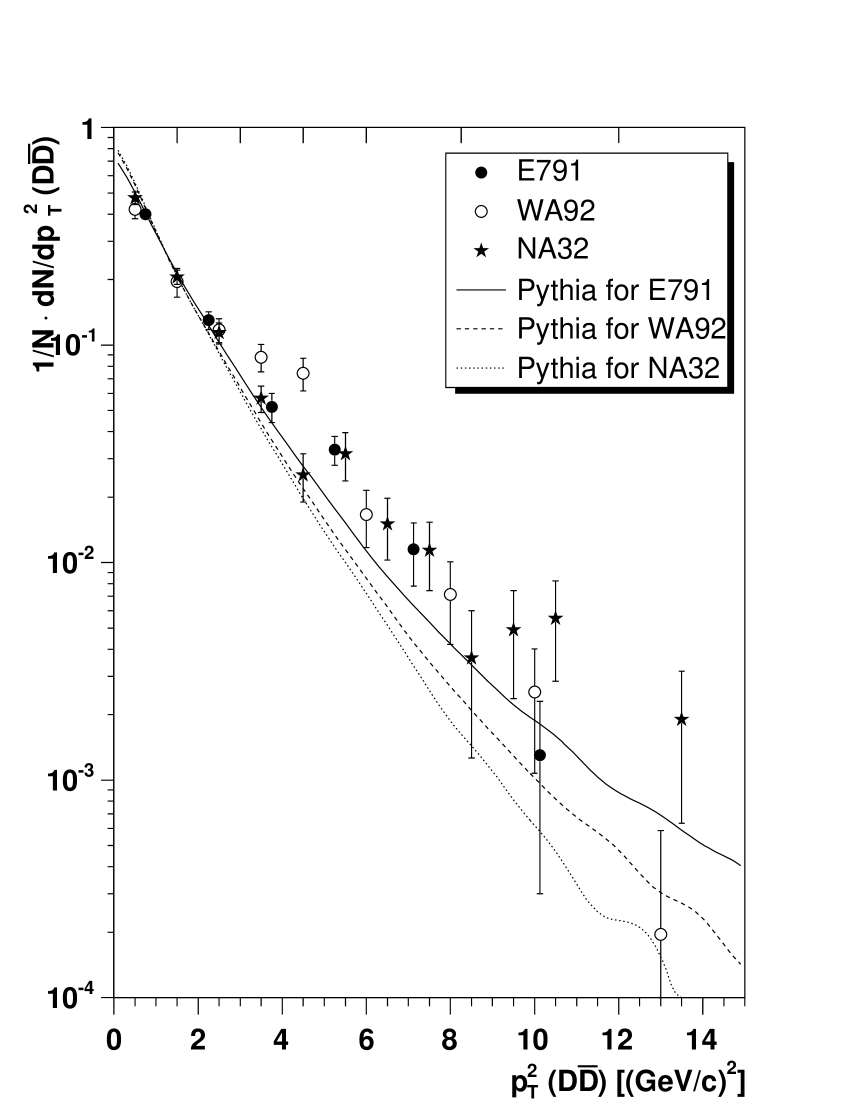
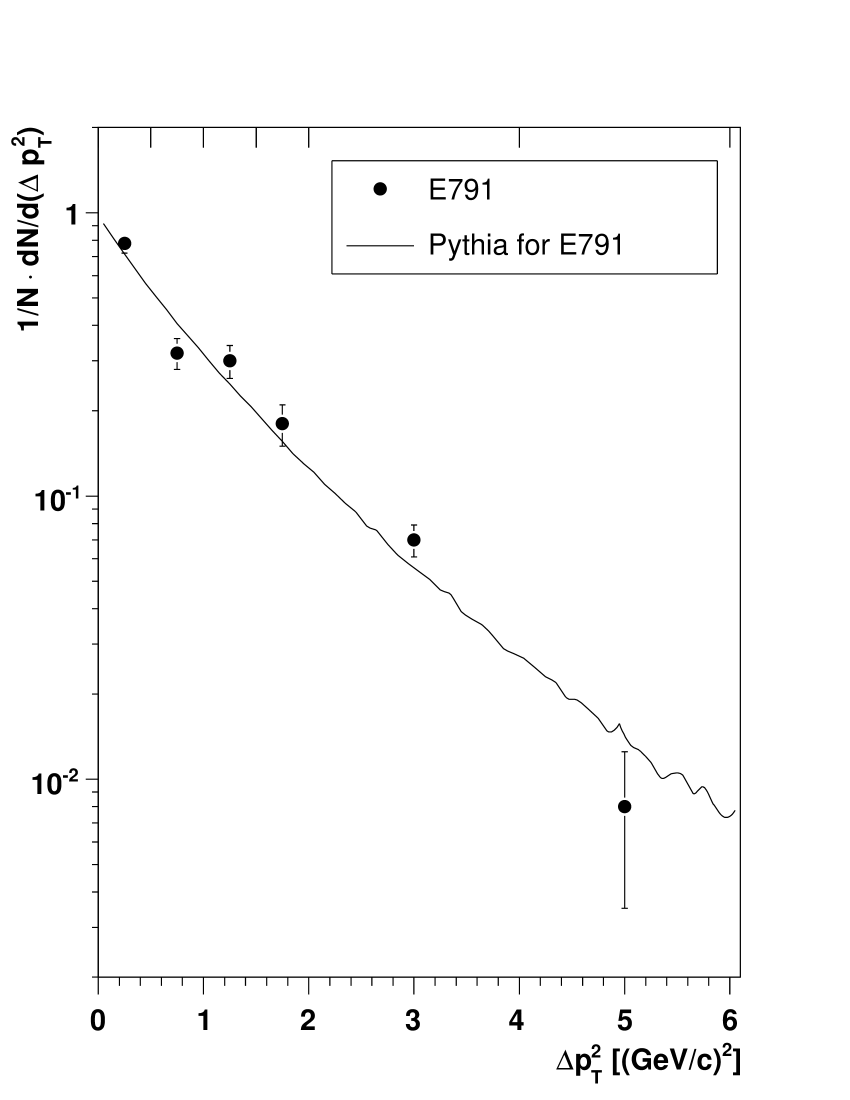
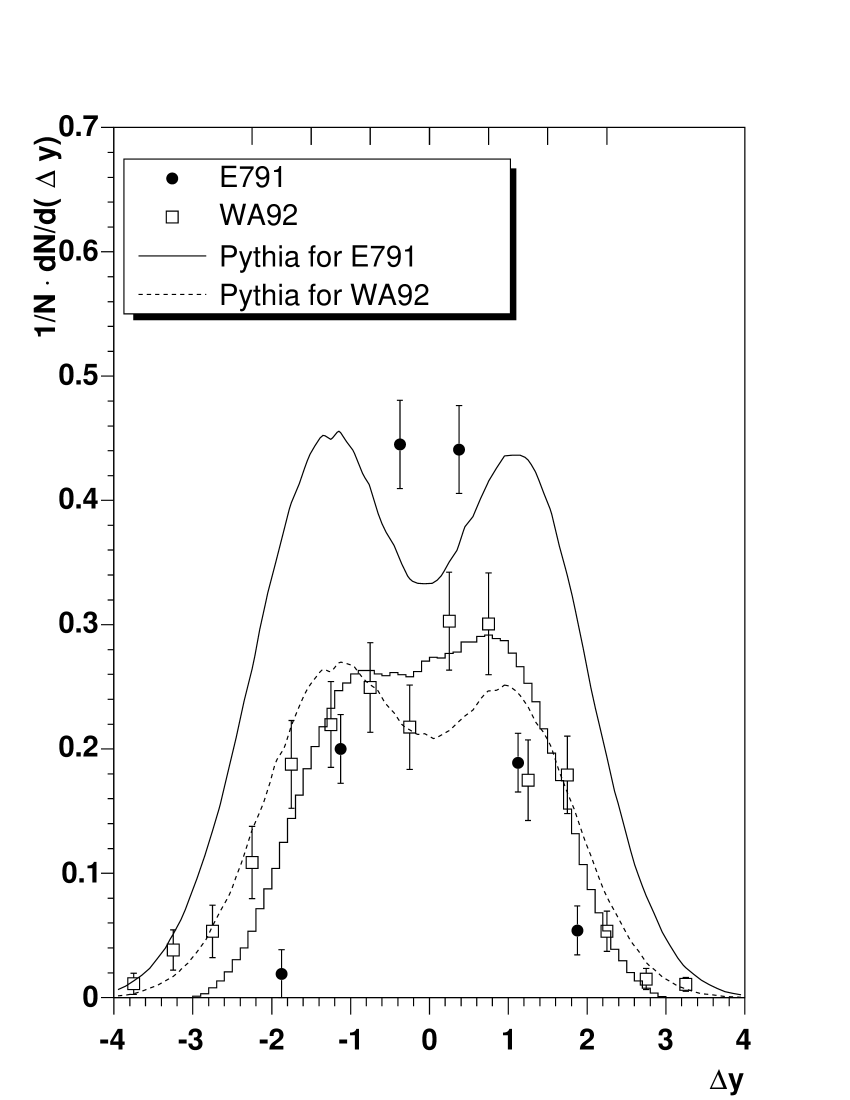
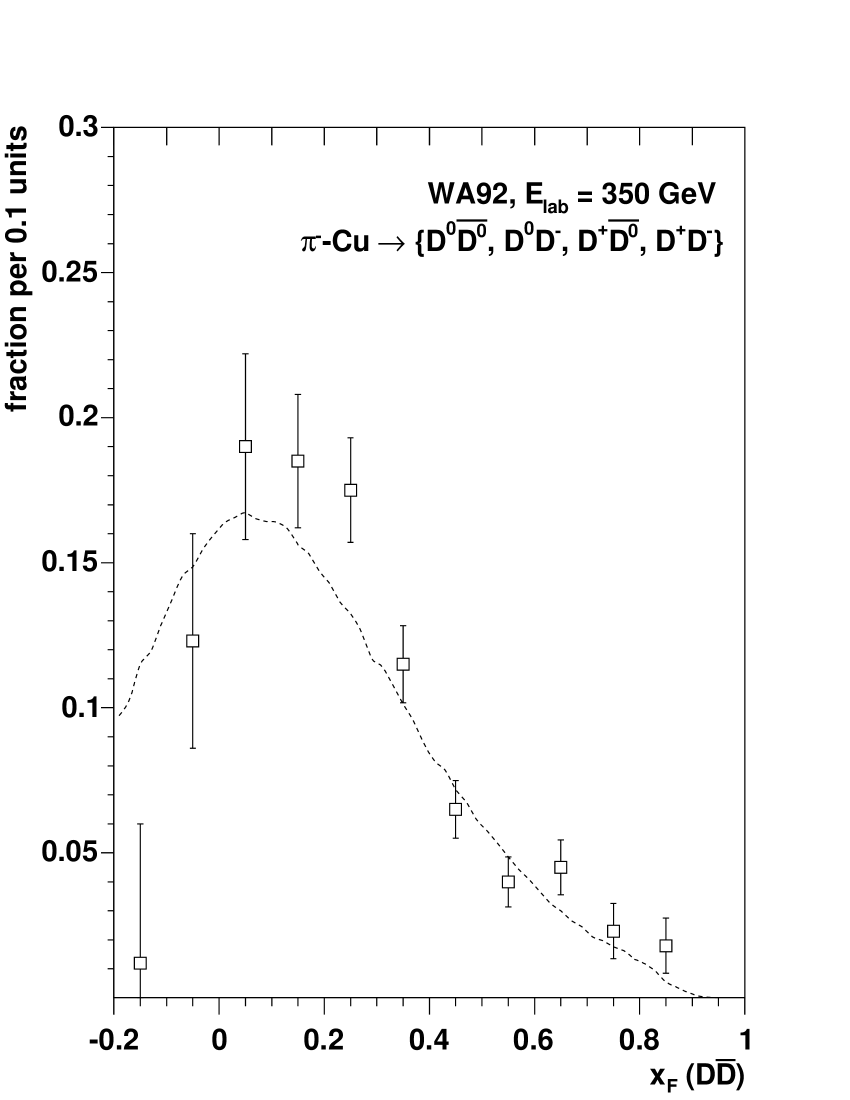
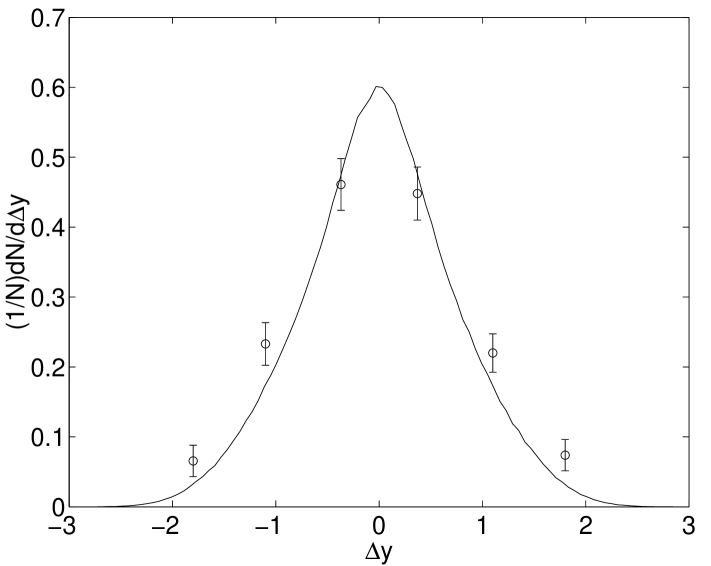
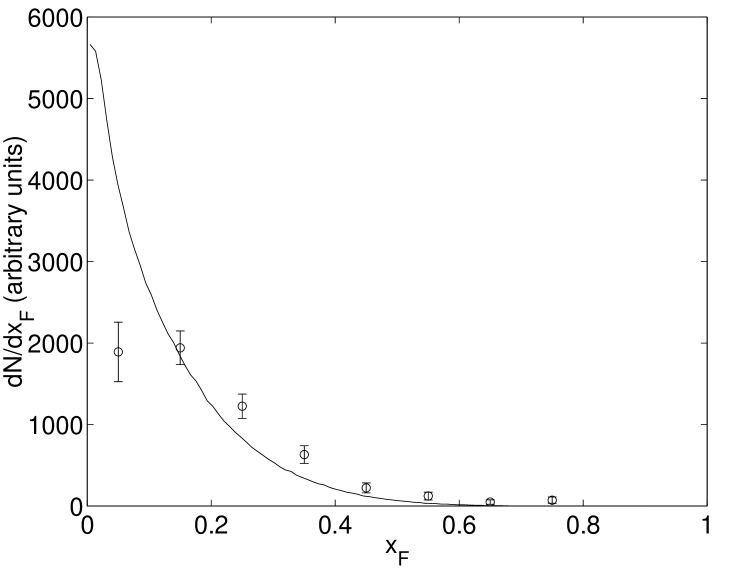
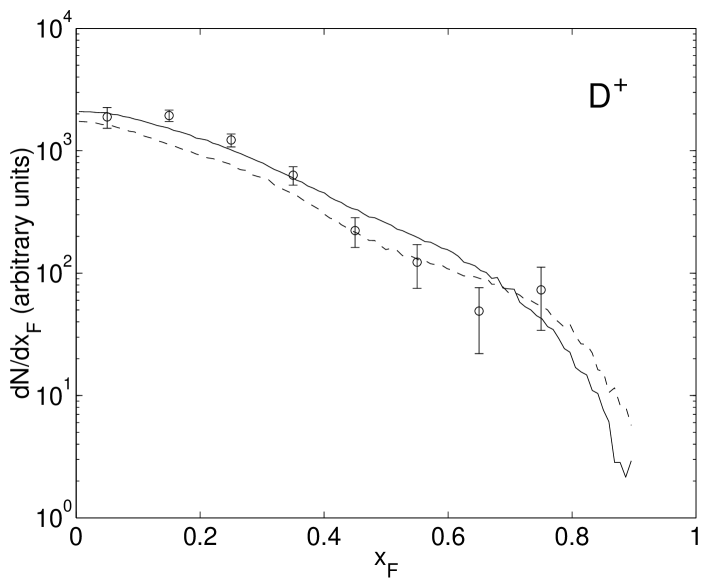
Figure 22 shows the transverse correlation variables, , and , measured in the three experiments. Since we are only interested in a shape comparison, all data sets and respective curves were normalised to each other, taking the E791 measurement as reference. All measurements are compatible with each other, in terms of shape, and can be described reasonably well by the Pythia curves.
In Fig. 23 we compare the measured longitudinal correlation variables, and , with the corresponding calculated curves. These variables are significantly affected by the hadronisation step and, therefore, test the modelling of this non-perturbative effect. The curves for WA92 (full phase space), depicted as dashed lines, are in fair agreement with the measurements. For the E791 case, we show the Pythia calculation before (solid line) and after (histogram) applying the phase space cuts; the histogram fails to describe the data points. Clearly, the phase space window of E791 limits the range to , but the measured distribution seems to be too narrow, with respect to Pythia’s curve.
It has been observed by one of the authors of Pythia [123] that the and distributions measured by E791 could be described quite well (see Fig. 24-left) if Pythia’s default hadronisation scheme would be replaced by the Peterson fragmentation function (with ), so that the non-interacting valence quarks would not influence the kinematics of the produced charm quark. However, this modified model would fail to reproduce the single D meson kinematical distributions measured by WA82 [114], as shown in Fig. 24-centre, which are well described by the standard scheme (Fig. 24-right).
In the context of D meson correlations it is worth mentioning the photo-production Fermilab experiment “FOCUS” (E831). On the basis of 7000 fully reconstructed D meson pairs, they showed [124] that Pythia 6.203 describes very well the correlation variables, , , and . Contrary to all other experiments, FOCUS compared the measured data with Pythia events propagated through the simulation, reconstruction and analysis algorithms, so that the calculated curves become affected by acceptance and efficiencies. This method also takes into account smearing effects, and should lead to a more robust comparison between data and theory. In Fig. 25 (taken from the FOCUS publication) we can see a remarkable narrowing of the distribution, due to the detector acceptance.


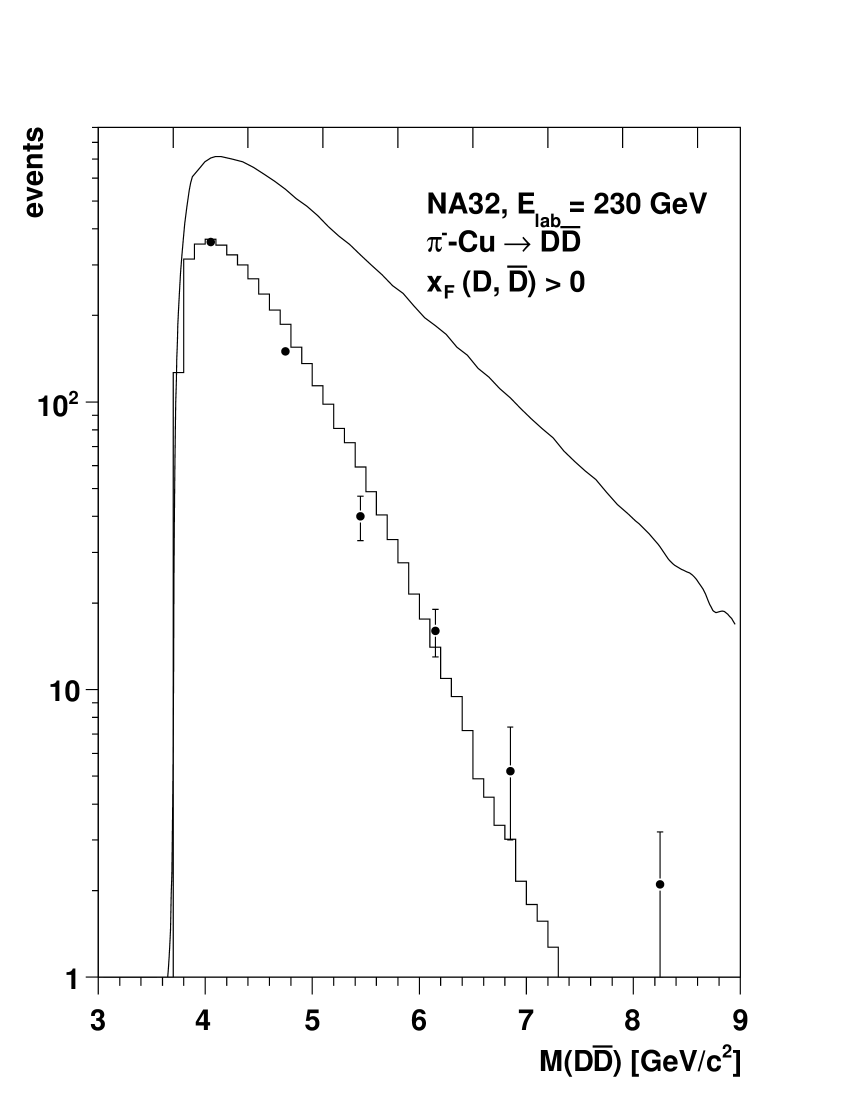
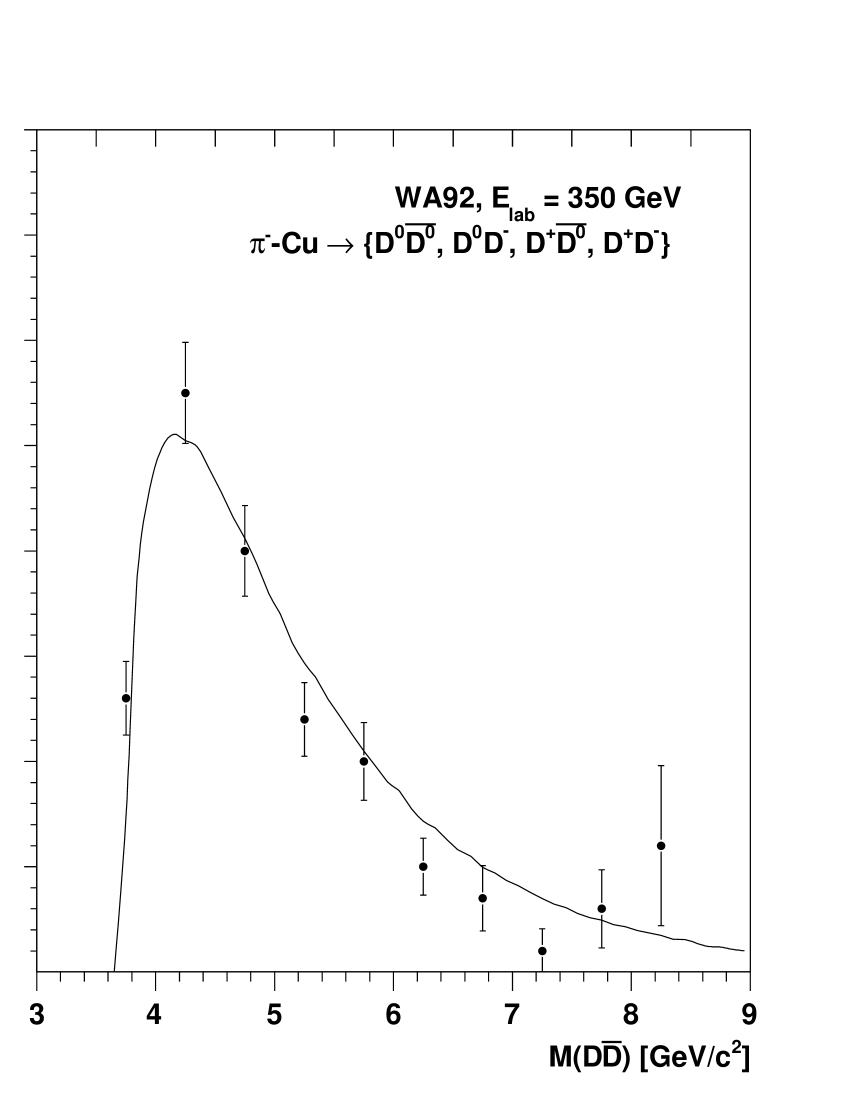
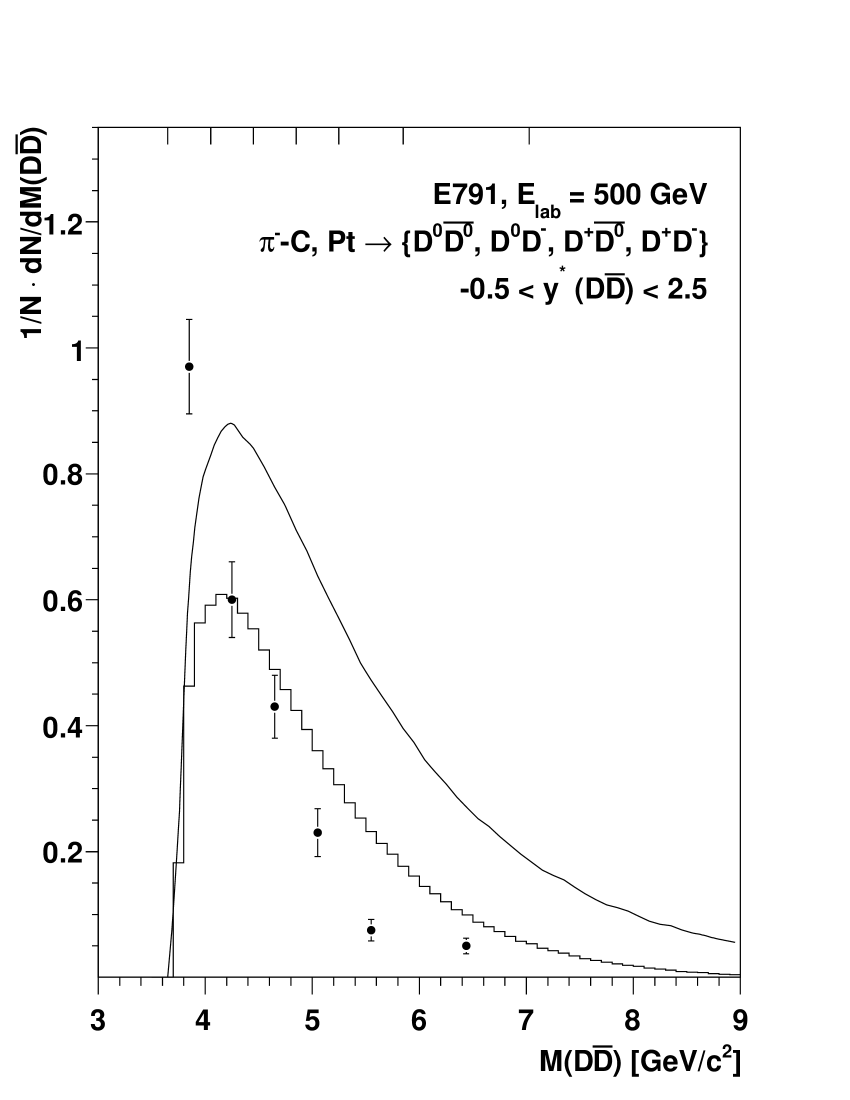
NA32, WA92 and E791 also measured the invariant mass distributions, as reported in Fig. 26. While the NA32 and WA92 distributions are nicely reproduced by Pythia’s curves, the E791 points show a spectral shape quite different from the calculation, with a very unexpected rise when approaching the production threshold, in apparent conflict with phase space considerations.
To summarise, the latest version of Pythia (6.326), with default settings (except for PARP(91), which should be kept between 1 and 1.5 GeV/), is able to reproduce reasonably well the available D meson pair correlation measurements, at least as provided by the NA32, WA92 and FOCUS Collaborations. However, there is a significant disagreement in what concerns the , and distributions measured by E791, which might be due to a problem in the 8-dimensional acceptance correction procedure. The highest statistics data set available for D meson correlations, collected by FOCUS, is in good agreement with Pythia events propagated through the simulation of the apparatus.
We finish this section by mentioning a different kind of pair correlation, the relative abundance of with respect to , evaluated through the asymmetry
| (8) |
has been measured in induced collisions by the WA82 [114], WA92 [49, 121], E769 [39] and E791 [125] Collaborations. In Fig. 27 we show a comparison (made by the authors of Pythia [105]) between the available data and a Pythia calculation specifically made for 340 GeV p collisions. The solid line, labelled “pair production”, corresponds to a calculation only including the standard LO processes of charm production, plus initial and final state radiation, while the dashed line labelled “all channels” also includes “flavour excitation” and “gluon splitting” diagrams.

These measurements, and the calculations, clearly indicate that the mesons are produced at more forward rapidities than the mesons, confirming that the is the leading particle in induced collisions.
6.4 Nuclear dependence of charm production
Most experiments used nuclear targets and published the D meson cross-sections for p-N and -N collisions, assuming a linear dependence with the mass number of the target nucleus, . However, as explained in Section 2.2, we expect that anti-shadowing in the parton distribution functions will affect charm production at energies below GeV. Therefore, the p-N and -N values obtained by extrapolating the p-A and -A measurements using the linear scaling should be somewhat higher than the values directly measured in pp and -p collisions. From Fig. 8 we can see that the nuclear anti-shadowing given by the EKS98 model increases with energy between and 40 GeV, the energy range where the data have been collected. But even at GeV, and for the Pb nucleus, the expected increase in the charm production cross-section due to the nuclear anti-shadowing effect, with respect to the linear extrapolation of pp collisions, is only around 10 %, a value too small to be visible in the presently available measurements, given their rather large uncertainties.
| Exp. | [GeV] Target | Observed | |
| Phase space | D mesons | ||
| p-A collisions | |||
| E789 | 800 Be, Au | Be: | |
| [44] | 00.08, 1.1 | Au: | |
| -A collisions | |||
| WA82 | 340 Si, Cu, W | Si: | + |
| [52] | Cu: | ||
| W: | |||
| E769 | 250 Be, Al, Cu, W | all targets: | + |
| [126] | |||
| WA92 | 350 Cu, W | Cu: W: | + |
| [49] | , | ||
| , | |||
| E706 | 515 Be, Cu | Be+Cu: | |
| [42] | , 18 | ||
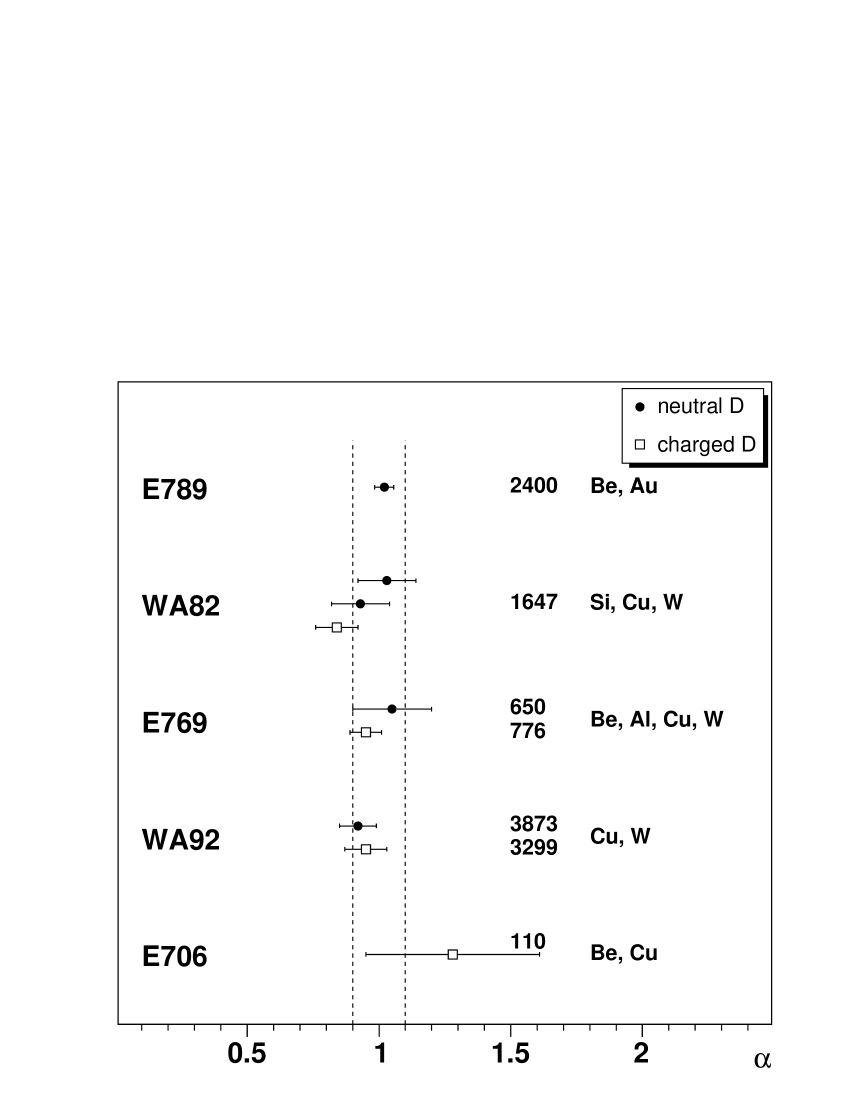
Some experiments made measurements with two or more targets and fitted their data to the form, extracting the values compiled in Table 16 and Fig. 28. In the third column we give the number of observed D mesons for each target, except if only the total number was provided. The errors of the WA82 measurements include systematic uncertainties, which are small with respect to the statistical error. All the published values are consistent with , within their large errors.
In a dedicated study [126], using the relative cross-sections of four nuclear targets (Be, Al, Cu and W), E769 extracted as the best description of the measurements, made with a pion beam. Within the statistical accuracy of the data, they saw no change between the values obtained with the and beams, or any dependence of on the D meson’s and . Also WA82 and WA92 have not seen any dependence of on or , but with even larger uncertainties. The existence of such a dependence (seen for many other particles, including the J/) cannot be excluded from the present measurements and, if observed by a future high statistics experiment, could imply a revised extrapolation of the E706 and E789 measurements to elementary -N/p-N cross-sections, given their limited coverages.
The WA78 Collaboration also studied the nuclear dependence of the charm production cross-section, by measuring the yield of prompt single muons in a beam-dump experiment, both with 320 GeV and with 300 GeV proton beams, interacting on Al, Fe and U targets. The resulting values (for above 0.1) were and for the p-A data [127], and and for the -A data [128]. These results are significantly lower than 1, raising doubts on whether the prompt single muons can be cleanly ascribed to semi-leptonic decays of charmed particles.
We close this discussion with a final remark concerning the parameterisation. Figure 12 collects the D meson production cross-sections measured in proton and pion induced collisions. Three measurements were made with hydrogen targets (NA16, NA27 and E743) while the other values were measured with nuclear targets and divided by . Considering the error bars of the data points, we do not see any significant difference between the values and the values. In Ref. [129] (from 1987) it was argued that the elementary charm production cross-sections derived from p-A measurements (performed with nuclear targets of ) should be parameterised as , following observations made with light flavour data [130] (where is around 1.5–2.0). Is was noted, in particular, that would result in at when comparing NA11 (-Be) and NA27 (-p) data [129]. Hence, the values should be higher than the pp values, or , as recently recalled in Ref. [131]. However, looking at the error bars in Fig. 1 b of Ref. [129] we see that implies , a very poor statistical significance. In fact, setting would lead to , perfectly compatible with 1.0, within errors… The claim of Ref. [129] is, thus, unsubstantiated (especially when we note that systematic uncertainties were neglected in the comparison between the data of the two experiments).
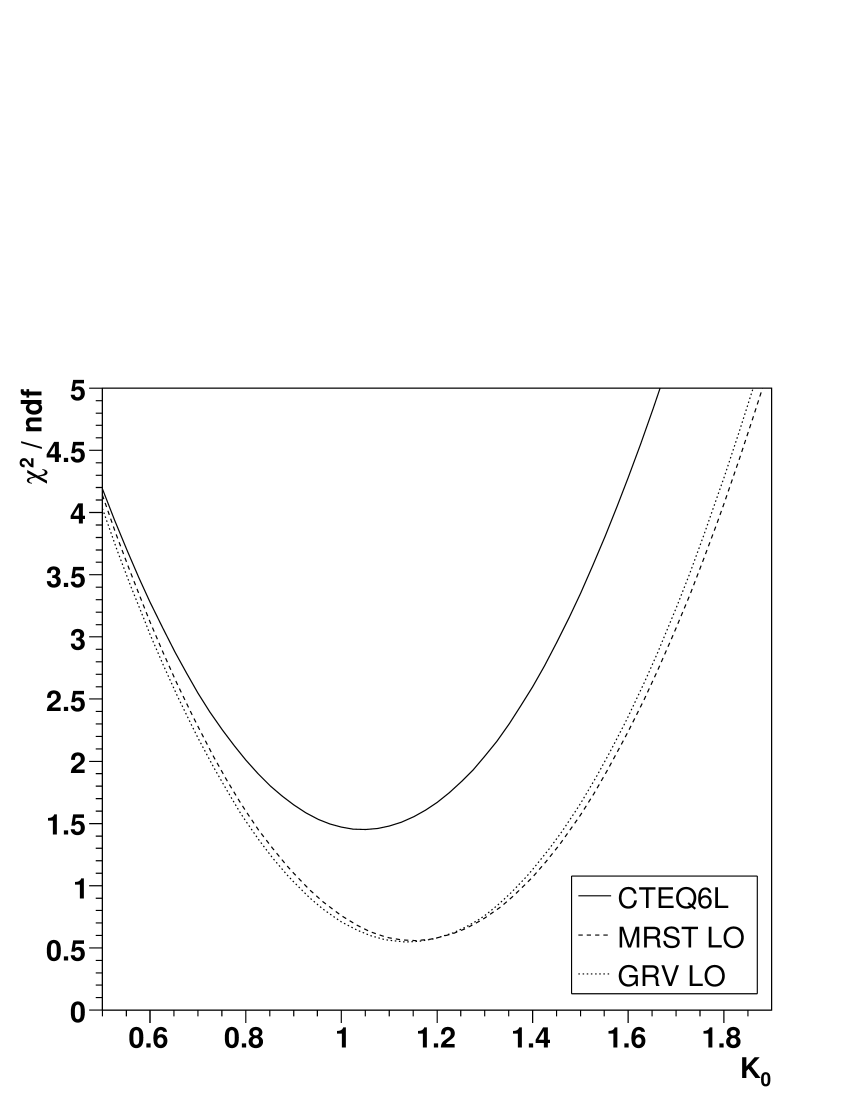
We have revisited this issue using the charm production data currently available, almost 20 years later. Would the new measurements prefer a value significantly higher than 1? We fitted the charm production cross-sections shown in Fig. 16 after scaling the pp values by a factor. Figure 29 shows how the fit quality, expressed in terms of per degrees of freedom, changes when varying . We see that the best fit is obtained with , and that the fit quality significantly degrades when using .
6.5 Beauty production cross-sections
As we have seen in Section 5, not many experiments have measured beauty production cross-sections, in pion or proton induced collisions, and most of those measurements are derived under model-dependent assumptions. This might partially explain why some data points, collected at essentially the same energy, differ by factors of 5 (NA10 and WA78; E771 and E789). The available measurements are shown in Fig. 30, as a function of , separated between pion (left) and proton (right) data. Two points are shown for NA10, using open and closed squares, corresponding to different theoretical assumptions for the kinematical distributions used to derive the full phase space value.
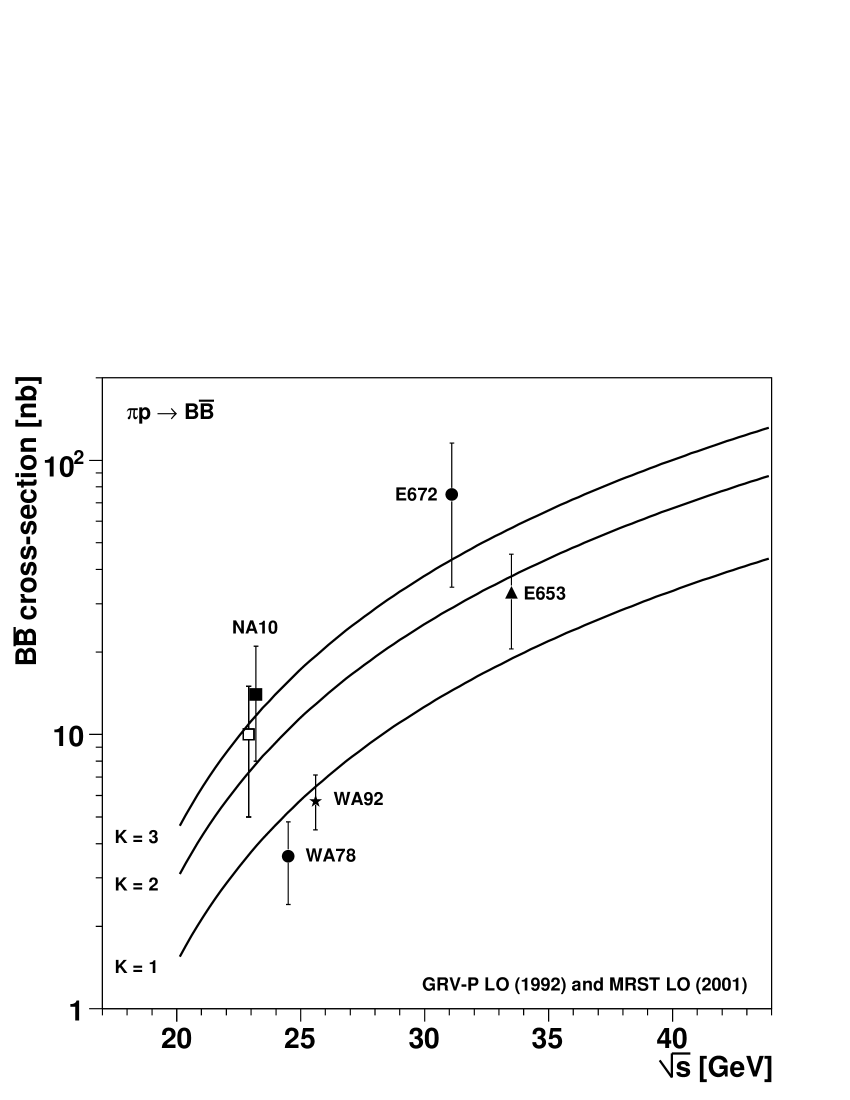
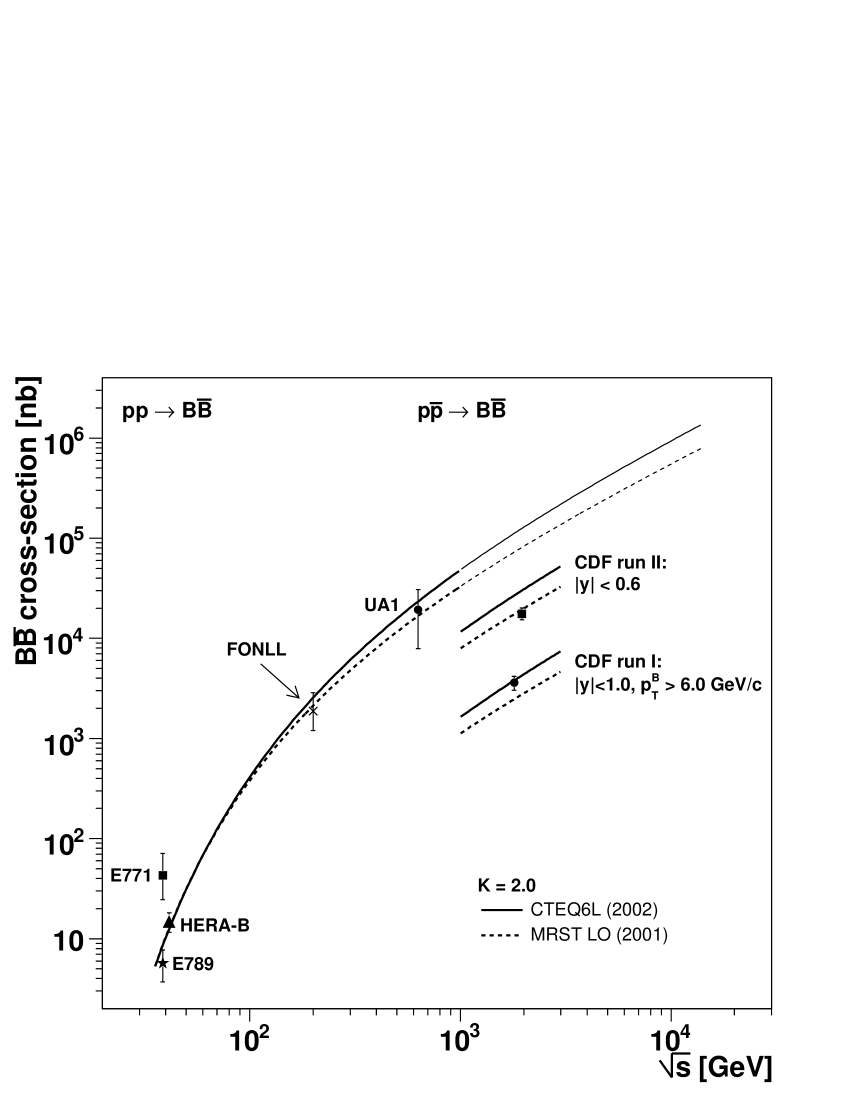
These measurements are compared to the results of the calculations we have made with Pythia. On the left panel we show the curves calculated with GRV-P LO (pion) and MRST LO (proton) PDFs, scaled with K-factors of 1, 2 and 3. Given their significant spread, it is not meaningful to use the data points to fit a specific K-factor value. On the right panel we show the fixed-target proton data points, together with data from UA1 and CDF. The two curves were calculated with CTEQ6L and MRST LO PDFs, and were (arbitrarily) scaled up with a K-factor of 2. We remark that the beauty production cross-section at such high energies is dominated by gluon fusion and, therefore, is identical for pp and collisions.
It is clear that the fixed-target points, on their own, are not able to give a meaningful normalisation of the calculations, and we must profit as much as possible from the three measurements provided by the collider experiments: UA1 quotes the full phase space cross-section at GeV, extrapolated from GeV/ and , while CDF gives cross-sections at and 1.96 TeV, within their specific phase space window.
In Run I, CDF measured a single B+ meson cross-section of b (dividing the sum of reconstructed B+ and B- mesons by 2), in the kinematical window and GeV/. According to Pythia (version 6.326), this window covers 7.8 % of the full phase space. The corresponding calculated cross-section is 1.9 b if evaluated with the CTEQ6L PDF set, and 1.2 b if evaluated with the MRST LO or GRV LO PDF sets. In Run II, CDF determined the single B hadron (beauty only; not anti-beauty) production cross-section in , b, using displaced J/’s tagged to come from beauty hadron decays. In this kinematical window ( 22 % of the full phase space), Pythia gives 16, 9 and 10 b (corresponding to K-factors of 1.1, 1.9 and 1.7), with the CTEQ6L, MRST LO and GRV LO PDF sets, respectively. These two measurements are also shown in Fig. 30, and should be compared to the Pythia curves calculated for the corresponding phase space windows.
Taking into account that the E771 and E789 data points (at the same energy) differ by a significant amount, and that the collider values have been measured in kinematical windows covering only a relatively small fraction of full phase space, it is remarkable that the Pythia curves, with a K-factor of 2, go through essentially all the data points within around a factor 2, over four orders of magnitude in beauty production cross-section, between the fixed-target and the CDF energies. It is particularly remarkable that the comparison between the two most reliable measurements, HERA-B and CDF, does not indicate any increase of the K-factor with energy.
Using the Pythia curves we derive a beauty production cross-section in pp collisions at RHIC energies, GeV, of around 2.5 b. This value is in good agreement with the prediction of a QCD FONLL calculation, which goes beyond the (“fixed-order”) NLO result by including the resummation of next-to-leading logarithms (“NLL”). See Ref. [66] and references therein for further details on the calculation and on its “parameters”: the heavy quark mass, the strong coupling, , the PDF set, the factorisation and renormalisation scales, the fragmentation functions, etc. The result of this calculation, b, has been included in Fig. 30, for comparison purposes. The error bar represents the uncertainty of the calculation, estimated by varying certain input parameters within reasonable ranges.
6.6 Beauty kinematical distributions
Measurements of kinematical distributions of beauty mesons are rare. UA1 published a distribution on the basis of around 3000 events (merging four independent analyses), for GeV/ and [41]. From Run I, CDF published a distribution for B+ mesons with GeV/ and , based on 387 events [53]. Using around 40 pb-1 of Run II data, CDF tagged 40 000 J/ mesons, within , as being produced away from the interaction vertex, presumably by beauty decays [55]. The corresponding distribution is shown in Fig. 31, where it is compared with Pythia calculations made with three PDF sets and with GeV/, on the left panel, and with a QCD FONLL calculation [133], on the right panel.
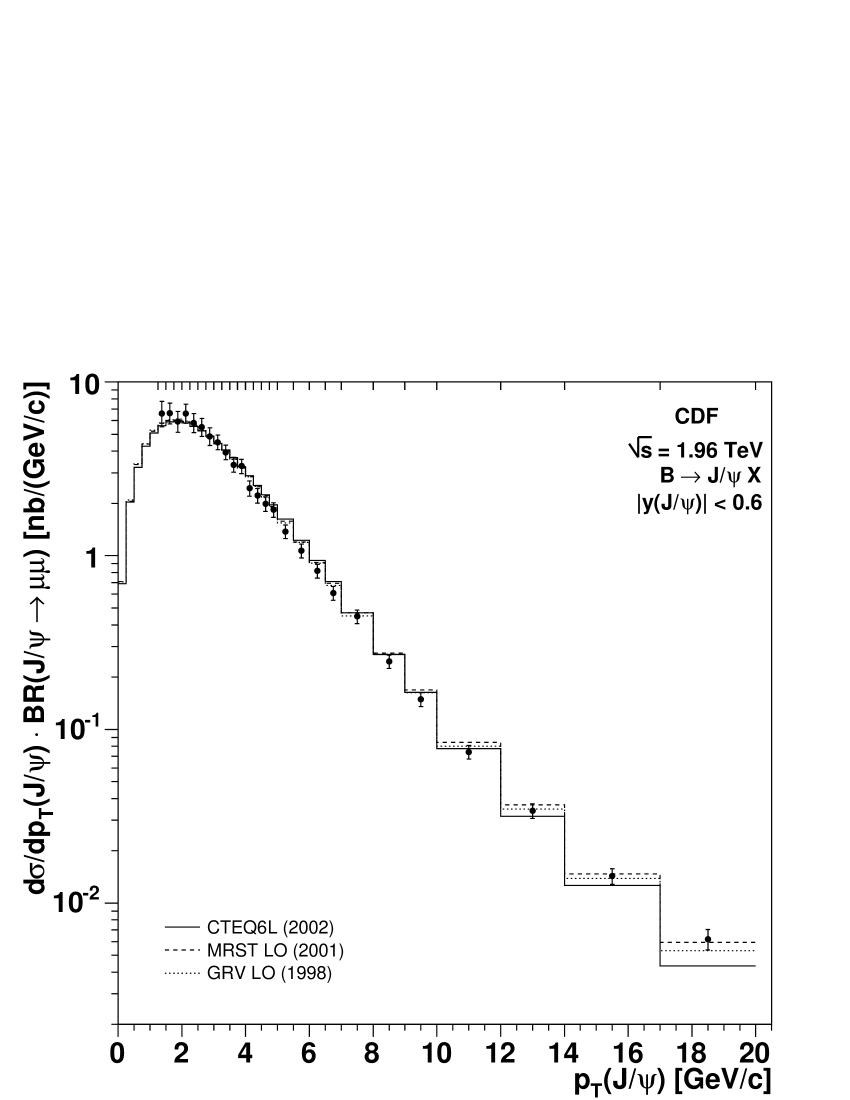
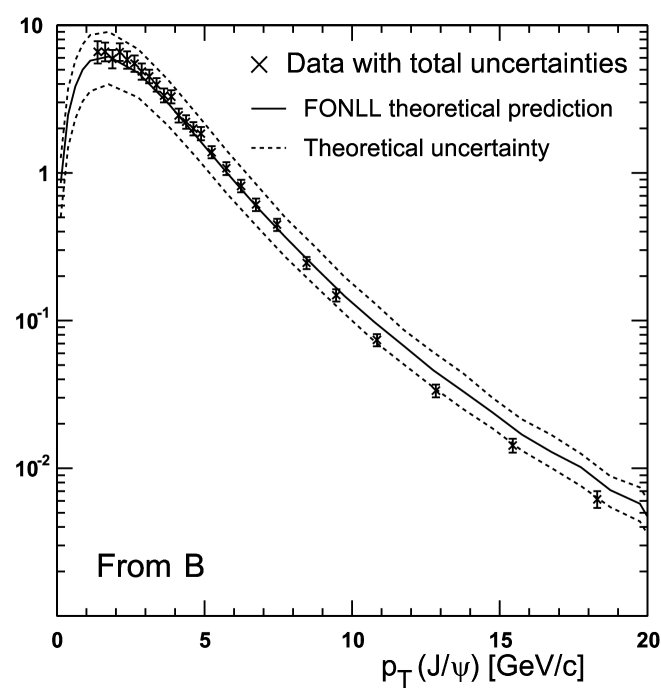
The agreement between the calculations and the measured data is quite good, over three orders of magnitude and down to very low values, where theoretical uncertainties are particularly important. The curves calculated with Pythia were normalised using the K-factors derived in the previous section.
6.7 Beauty feed-down to J/
The study of the decay mode allowed several experiments to determine the beauty production cross-section. On the other hand, for studies of J/ production this decay channel constitutes a source of background which should be carefully evaluated. This feed-down source of J/ mesons is particularly important in the context of the study of J/ suppression (or enhancement) in heavy-ion collisions at sufficiently high energies, as those at the RHIC and LHC colliders. Since beauty mesons should not be affected by the medium formed in heavy-ion collisions, the fraction of J/’s which come from beauty decays will not be suppressed. Therefore, the pattern of J/ suppression measured at RHIC or LHC energies cannot be directly compared with predictions based on J/ melting by QGP formation, for instance, without considering the beauty “contamination”. This observation emphasises the importance of measuring the beauty yield in the RHIC and LHC heavy-ion experiments.
We will now make a rough evaluation of the level of this problem. Figure 32 shows the fraction of J/’s coming from the decay of beauty hadrons, as a function of the J/’s transverse momentum, as measured by CDF in Run II, within . We see that the fraction of J/’s from beauty decays rises steeply with increasing , from 10 % at GeV/ to 50 % at GeV/. At GeV, UA1 observed that % of all J/’s produced within GeV/ and come from beauty decays [68]. This fraction becomes negligible (less than 0.1 %) at the much lower energy of HERA-B [57].
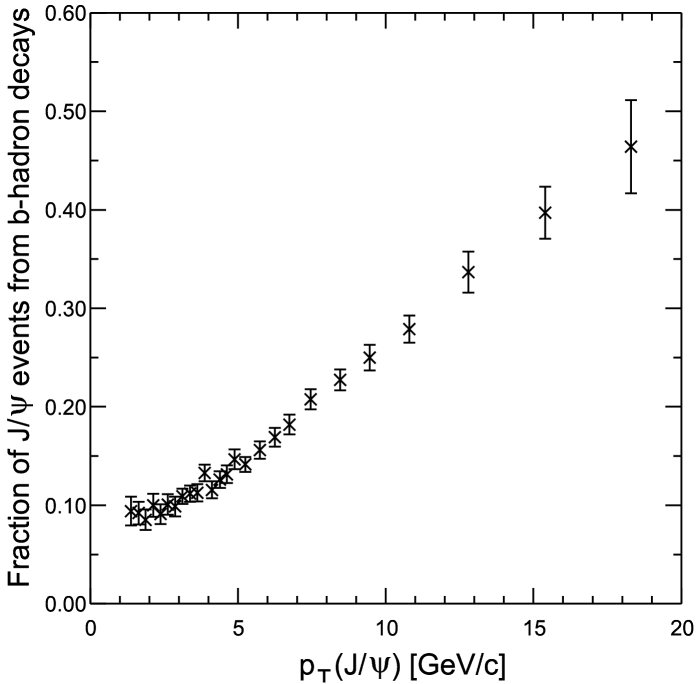
Since beauty production is expected to scale linearly with the mass number of the colliding nuclei, while J/ production scales less than linearly (as at SPS energies [134]), in Au-Au or Pb-Pb collisions the relative fraction of J/ mesons resulting from beauty decays will be higher than in pp collisions. If direct J/ production is further suppressed in heavy-ion collisions (NA50 measured a factor 2 of extra suppression in central Pb-Pb collisions at the SPS [135]), beauty production could account for a significant fraction of the observed J/ yield, especially at LHC energies and at high values. Studies of J/ suppression as a function of are particularly sensitive to this feed-down source, given its strong dependence.
6.8 Charm cross-section measurements without vertexing
Besides the charm production cross-section measurements mentioned in Section 4, mostly performed with especially designed detectors and affected by relatively low background levels, there are a few measurements made by other experiments, in more difficult conditions. We will consider in this section three of these “indirect measurements”, recently made by experiments working on the field of “quark matter physics”: NA50 at the SPS; PHENIX and STAR at RHIC. While these experiments are mostly devoted to the study of high-energy nuclear collisions, they have also taken pp, p-A or d-Au data. We will only consider results from these more elementary collisions.
The NA38 and NA50 Collaborations studied dimuon production, of mass above 1.5 GeV/, in p-A, S-U and Pb-Pb collisions, at SPS energies [136], to look for evidence of thermal dimuon production from a quark-gluon plasma, presumably formed in heavy-ion collisions. The measured mass distribution, in the continuum surrounding the J/ and resonances, was compared to the superposition of two expected sources: dimuons from the Drell-Yan mechanism and muon pairs from simultaneous semi-muonic decays of pairs of D mesons. The proton-nucleus data, collected with a 450 GeV proton beam and several nuclear targets (Al, Cu, Ag, W), could be rather well described, both in terms of mass and distributions, as the sum of these two contributions, simulated with Pythia 5.7, with MRS A PDFs and GeV/. Pythia was also used to calculate the “extrapolation factor” needed to go from the elementary (nucleon-nucleon) charm production cross-section used in the event generation to the yield of muon pairs from D meson pair decays detected in the phase space window probed by the experiment: and , where is the dimuon rapidity in the laboratory frame and is the Collins-Soper polar angle [137]. Using this calculated factor and a global fit to the four p-A dimuon mass distributions, NA50 derived b as the full phase space charm production cross-section, per nucleon, which best reproduces the dimuon data collected in p-A collisions at 450 GeV. The derivation used a luminosity deduced from the number of J/ events (and a previously measured J/ cross-section), and assumed a linear dependence of with the target mass number.
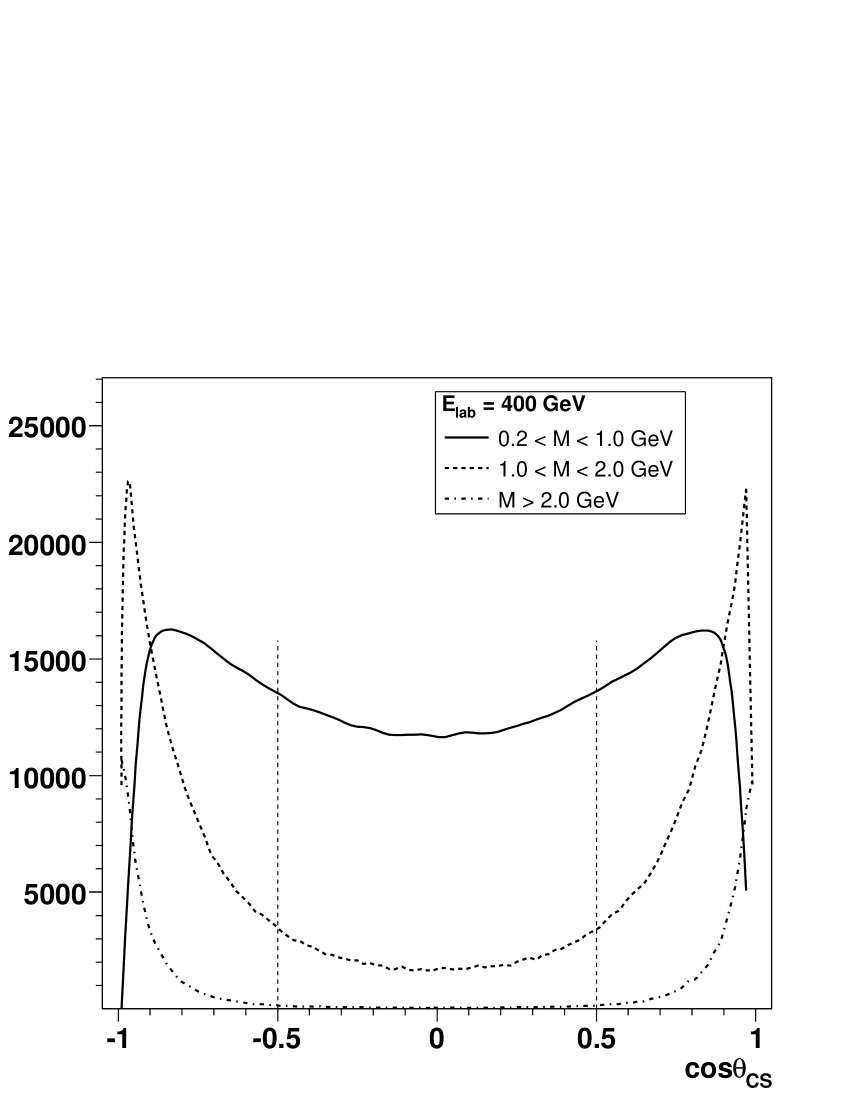
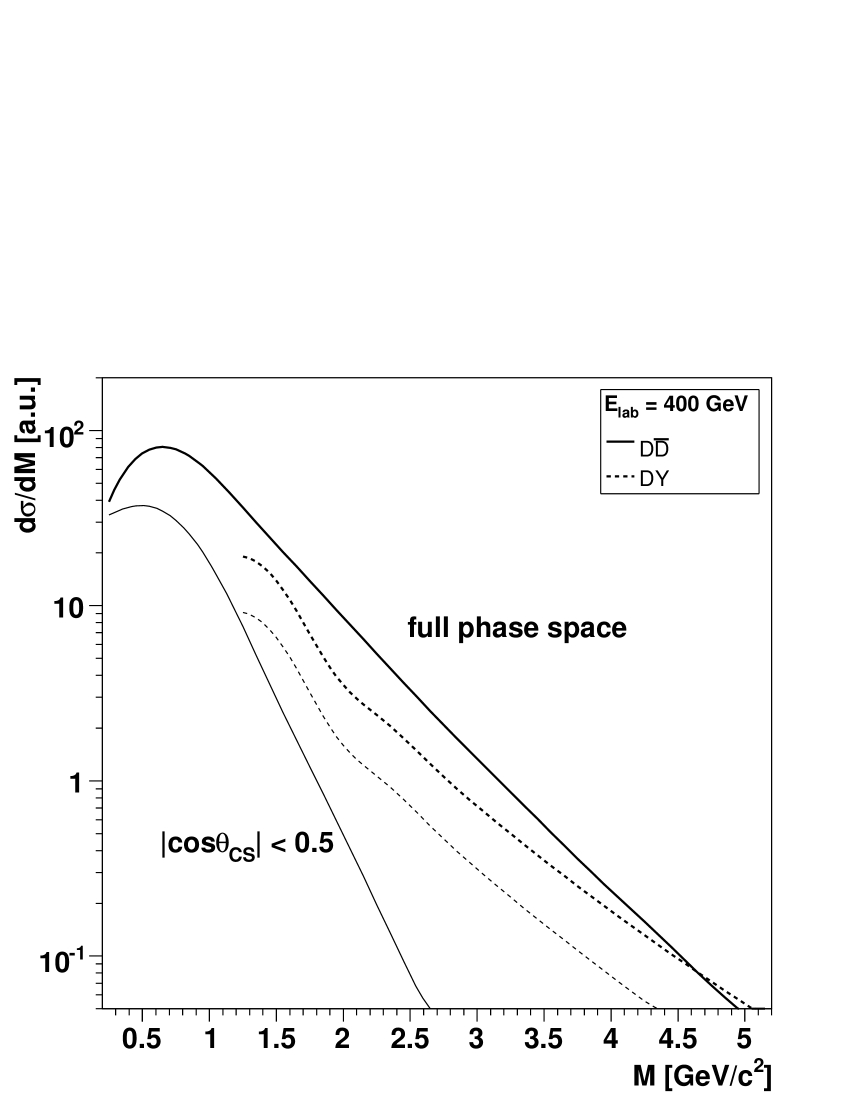
We should be cautious when comparing this value with those directly obtained from the study of hadronic decays of D mesons. The “charm yield” is extracted from the dimuon mass spectra after subtracting a very important “combinatorial background” of muon pairs due to pion and kaon decays, and a Drell-Yan contribution which, at such low dimuon masses (1.5–2.5 GeV/), is rather uncertain. Furthermore, the relative contribution of open charm decays and Drell-Yan dimuons to the mass distribution is quite sensitive to the kinematical cuts imposed on the events, given the strong correlation between the dimuon mass and the kinematical variables. Figure 33-left shows that when we select high mass muon pairs from decays we are forcing them to have close to or . Such events cannot be measured by the NA38/50 spectrometer, which imposes the kinematical cut . The influence of this cut on the mass distributions of muon pairs resulting from charm decays and on Drell-Yan dimuons is shown in Fig. 33-right, for the case of pp collisions at GeV. We see that the Drell-Yan dimuon mass distribution is simply scaled down while the reduction of the charm spectrum is much more pronounced for the higher masses, leading to a significant change of the shape. It is curious to note, in particular, that the Drell-Yan contribution would not dominate the mass range above the J/ peak (a common assumption at these collision energies) if the cut would not be applied.
The PHENIX Collaboration measured inclusive single electron spectra in pp collisions at GeV [138], using data collected in RHIC Run-2 (2001/2002), in the following phase space window: GeV/, , . Charged particles were tracked in a drift chamber and a pad chamber layer. Electrons were selected using the information provided by an electromagnetic calorimeter and a ring imaging Čerenkov detector. The ratio of “non-photonic” electrons, assumed to come from charm and beauty decays, to background (photonic) sources is 0.4 for GeV/ and for higher values. The shape of the spectrum obtained after background subtraction is reasonably well described by a superposition of charm and beauty contributions, as simulated with Pythia, in the range up to 1.5 GeV/. In the higher range the measured distribution exceeds the calculation, made with Pythia 6.205, with GeV, as the definition and the CTEQ5L set of PDFs, as described in Ref. [110]. Since the total production cross-section is dominated by the low region, the high- disagreement can be neglected, and the normalised Pythia charm curve was integrated down to . The resulting mid-rapidity production cross-section is mb and the estimated full phase space value is mb.
The STAR Collaboration extracted the production cross-section in d-Au collisions at GeV from data collected in 2003 [139]. Two independent measurements were made: using inclusive electron data to probe charm semi-leptonic decays and using directly reconstructed neutral D mesons, through the hadronic decay channel. The yield of neutral D mesons with and in the range 0.1–3 GeV/ was extracted from the invariant mass spectrum of kaon-pion pairs, reconstructed in the TPC. The lack of accurate vertexing information imposed the pairing of all oppositely charged kaon and pion tracks of each event, resulting in a signal-to-background ratio around 1/600. After combinatorial background subtraction, by event mixing, the yield was determined with an uncertainty estimated to be around 15 %. Electrons and positrons were identified combining the measured in the TPC with the velocity information provided by a TOF system (covering and ). After subtracting the estimated contribution from photonic sources, the electron distribution in the range 1–4 GeV/ was compared to calculations of the yields expected from charm decays. The yield obtained from a combined fit to the and electron data was converted in a full phase space charm production cross-section, using a pp inelastic cross-section of mb, the average number of binary nucleon-nucleon collisions in d-Au collisions (7.5), a factor of to extrapolate from mid-rapidity to full phase space, and a fraction of mesons with respect to all charmed hadrons of (measured at LEP). The result was mb per nucleon-nucleon interaction. While this value is considerably higher than the PHENIX pp cross-section, obtained at the same energy, the two results are compatible with each other within (systematic) uncertainties.
In Fig. 34-left we compare the three measurements mentioned above, made by NA50, PHENIX and STAR, to the calculations we have made with Pythia and already presented in Fig. 16. The curves were normalised with the K-factors determined from the fixed-target measurements, and reported in Table 12. Taking as reference the calculations made with the CTEQ6L set of PDFs, the value derived from the NA50 p-A dimuon data is a factor too high. The PHENIX and STAR values are closer to the calculations, differing by factors of (PHENIX) and (STAR). With respect to the calculation made with MRST LO PDFs, the NA50 value remains a factor 2 too high while the PHENIX and STAR points become too high by factors (PHENIX) and (STAR).
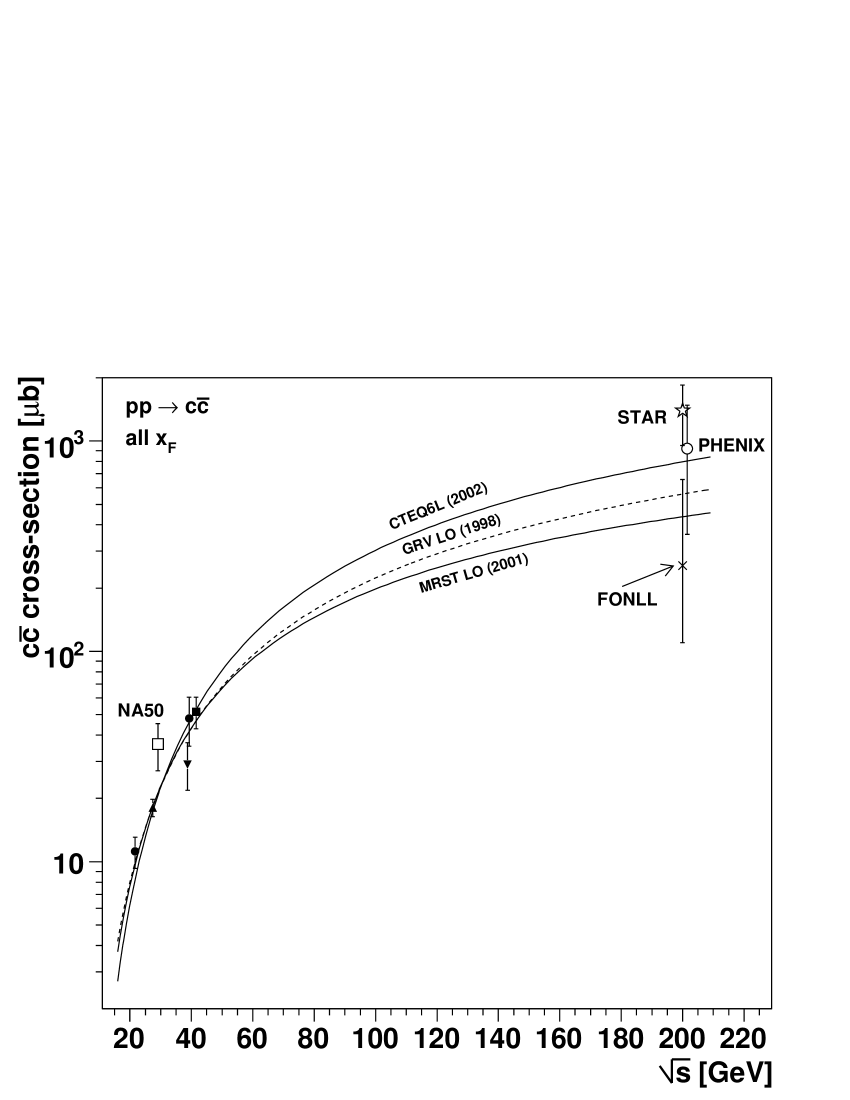
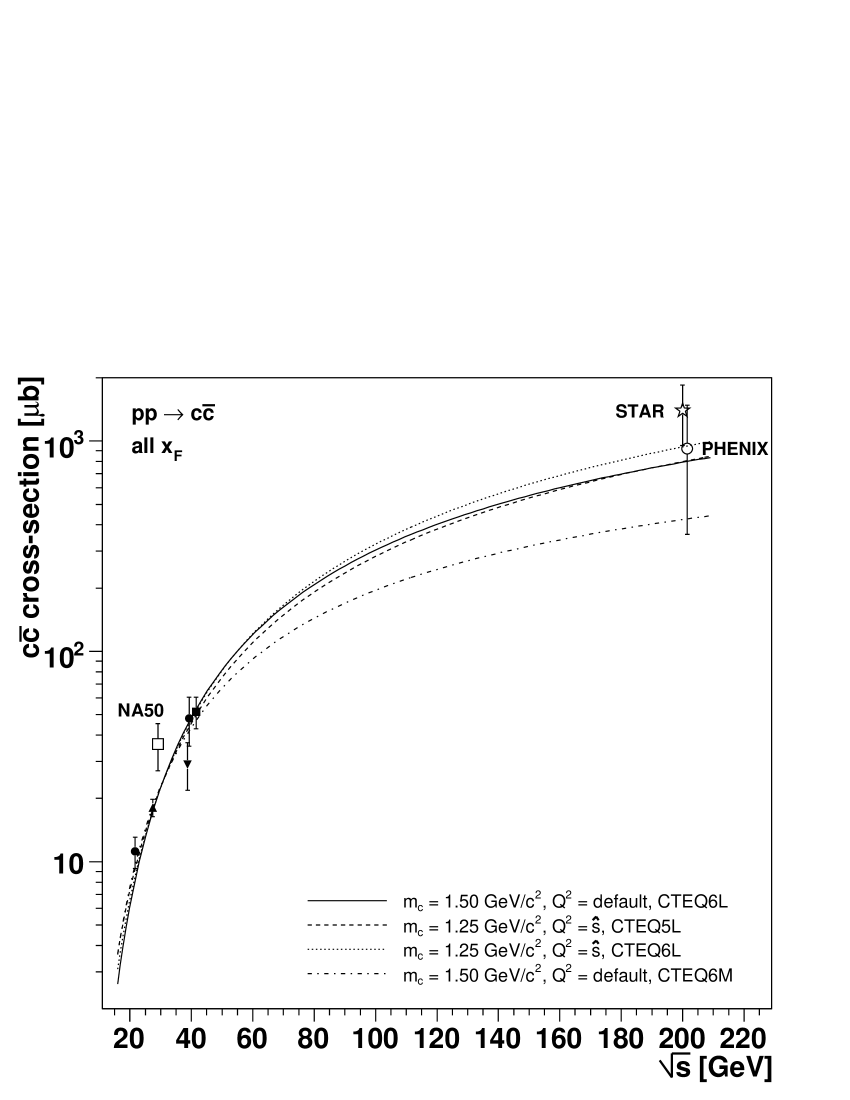
We have also included in this figure, for comparison with the RHIC data points and with Pythia’s curves, the result of the FONLL calculation [66] for charm production at GeV: b. The rather large uncertainty was evaluated by varying the input settings of the calculation (see the text describing the FONLL point of Fig. 30 for further details).
On the right panel of Fig. 34 we show four different curves, all calculated with Pythia 6.326 but with different settings. The solid line is the curve obtained with our standard settings and CTEQ6L PDFs, already presented on the left panel. The dashed line is obtained with the settings used by PHENIX: GeV, as the definition and the CTEQ5L set of PDFs. The dotted line uses “intermediate” settings: the same mass and definition as used by Phenix, but using the more recent CTEQ6L PDFs. This allows us to visualise the differences between the settings in a more gradual way. Finally, the dashed-dotted curve is done with the same “standard” settings as the solid line, except that we used CTEQ6M instead of CTEQ6L PDFs. We recall once more that the use of NLO PDFs, like CTEQ6M, is not appropriate in LO calculations, such as those performed by Pythia.
It is a curious coincidence that the solid and dashed curves cross each other at the energy of the RHIC data points, in spite of the fact that only the fixed-target measurements contribute to their normalisations. The change in c quark mass, in definition and in PDF sets compensate each other, so that both the default settings, with CTEQ6L, and the “Phenix settings” give a cross-section at GeV of 800 b. The difference between the dashed and dotted lines is due to changes between the CTEQ5L and CTEQ6L PDFs, and probably originate in the harder gluon densities of CTEQ6L: less gluons at low (see Fig. 3) results in somewhat lower cross-sections at high energies.
All the calculations give essentially the same values in the SPS energy range, since they are “forced” by the existing measurements to cross each other at around GeV (see Table 12). In the context of the NA50 and NA60 experiments, however, it is worth recalling that at these energies charm production is expected to be sensitive to nuclear effects on the PDFs, according to the EKS 98 model (see Fig. 8). For GeV, the charm production cross-section per nucleon is expected to be enhanced by 4 % in p-Be and by 10 % in p-Pb collisions. In the case of Pb-Pb collisions at GeV per nucleon, the corresponding enhancement factor should be around 12 %.
7 Summary and conclusions
In this report we reviewed some aspects of open charm and beauty hadro-production from data collected in fixed-target and collider experiments. We considered measurements made with proton and pion beams, at the CERN SPS, DESY and Fermilab, or in colliders, at CERN (UA1) and Fermilab (CDF).
We used the Monte Carlo event generator Pythia, version 6.326, as a theoretical model to describe the reviewed data. We have seen that Pythia provides a reasonable description of the available charm data, in terms of energy dependence of production cross-sections, D meson kinematical distributions, and pair correlations, provided the intrinsic transverse momentum of the colliding partons, , is generated with a Gaussian of width PARP(91) 1 GeV. However, we observed that the ratio between charged and neutral D meson production cross-sections, as measured in proton induced collisions, is around a factor of 2 higher than the value expected from Pythia’s calculations, with default settings. The comparison with data collected in other collision systems, and at many different energies, shows that naïve spin counting arguments do not seem to apply in the case of D meson production, presumably because of the significant mass difference between the D and the D∗ states. This indicates that (parameter PARJ(13) in Pythia) should be set to 0.6 (when generating charm events; for beauty the default value of 0.75 should be kept). Except for PARP(91) and PARJ(13), we used Pythia (6.326) with default settings. Besides, the calculations need to be up-scaled by an appropriate K-factor. In particular, using GeV and the CTEQ6L set of PDFs, the best description of the measured charm cross-sections requires a K-factor of 3.
Normalising the calculated charm production cross-sections to the existing (fixed-target) data, we have deduced the values expected for the RHIC energies, and compared them with the values extracted from the measurements of PHENIX and STAR. The issue of nuclear effects in the parton densities was also addressed in some detail. At SPS energies, the EKS 98 parameterisation leads to a 10 % higher cross-section in p-Pb collisions, with respect to a linear extrapolation from proton-proton collisions. Such a small effect cannot be confirmed by looking at existing data, given the very large uncertainties of the measurements. Maybe further insight into these issues will result from the study of the proton-nucleus data collected by the NA60 experiment in 2004, with 400 GeV protons incident on seven different nuclear targets simultaneously placed on the beam line.
There are not many measurements of beauty production cross-sections and most of those obtained with pion beams are significantly “model dependent” (especially the oldest values). In these conditions, it is remarkable (even surprising) that the calculated energy dependence of the beauty cross-section, for pp or collisions, is able to reproduce rather well the HERA-B and CDF measurements, which differ by four orders of magnitude. This results in a relatively accurate prediction for the beauty production cross-section in the “intermediate energies” of the RHIC experiments, 2.5 b. Nevertheless, we must emphasise the relevance of a direct measurement of the beauty production cross-section at RHIC, particularly important to ensure a correct interpretation of the J/ measurements, in heavy-ion collisions, as a function of collision centrality and of .
Acknowledgements
We are particularly grateful to Torbjorn Sjöstrand, for his very efficient help over the last few years and for a careful reading of our manuscript, and to Andre David, for finding that should be 0.6 rather than 0.75 in the case of charm production. Several other colleagues helped us understanding some of the measurements quoted in this report or gave us interesting feedback in some other issues. Among them, we would like to explicitly thank R. Averbeck, M. Cacciari, S. Conetti, A. Devismes, A. Drees, E. Gottschalk, T. LeCompte, M. Leitch, M. Mangano, A. Morsch, M. zur Nedden, L. Ramello, C. Salgado, J. Schukraft, R. Stefanski, T. Ullrich and P. Weilhammer. We are also very grateful to Gerry Brown for his interest in our work; without his request and encouragement, this review paper would not exist.
Note added in proof
After this paper was completed, the HERA-B Collaboration finished their open charm analysis [140]. The resulting production cross-sections, per target nucleon and in the phase space window , are b for the charged D mesons and b for the neutral ones. These values must be extrapolated to full phase space before they can be compared to other measurements. According to Pythia, version 6.326, the HERA-B window covers slightly different fractions of full phase space for the leading and non-leading D mesons, because they have different rapidity distributions: 49 % for the and ; 58 % for the and . These values were calculated with the CTEQ6L set of PDFs and would be somewhat smaller if calculated with the MRST LO (or GRV LO) PDFs: 43 % and 55 %. Averaging the extrapolation factors obtained with these three PDF sets and taking into account the different particle and antiparticle values, the total production cross-sections are b and b for the charged and neutral D mesons, respectively. These values replace the preliminary ones given in Table 4.
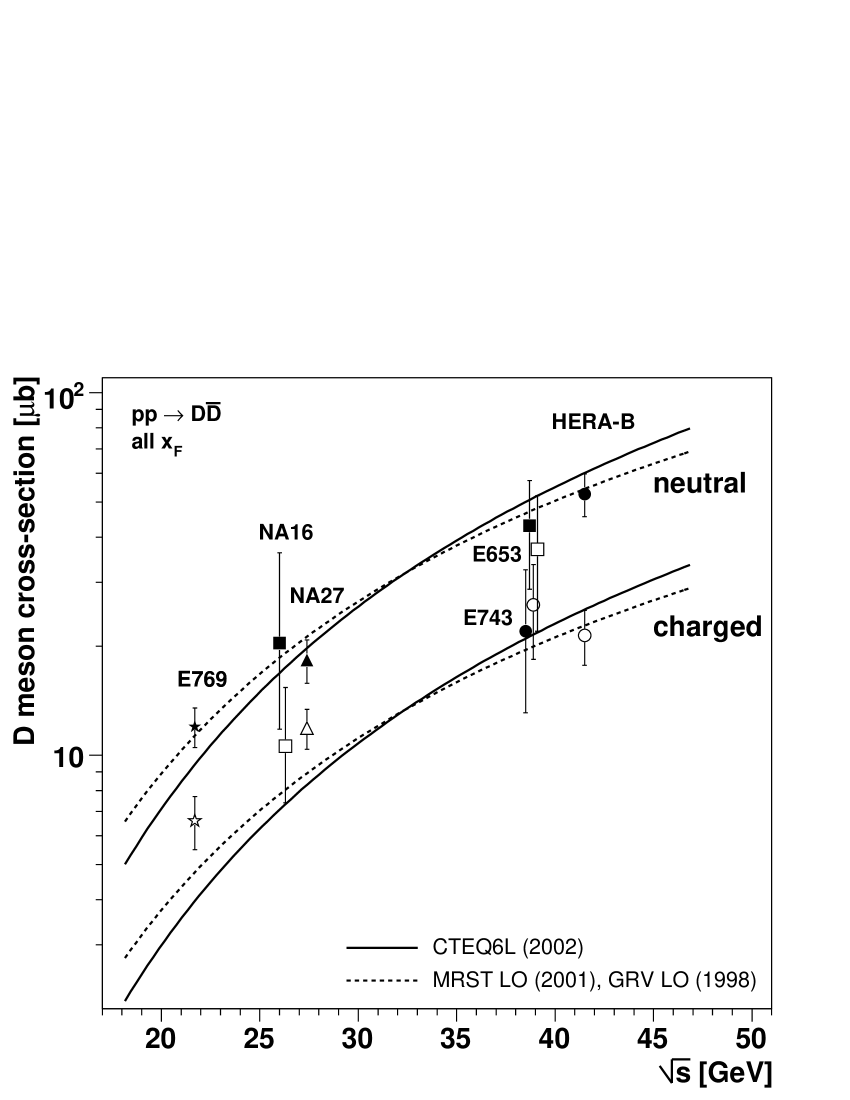
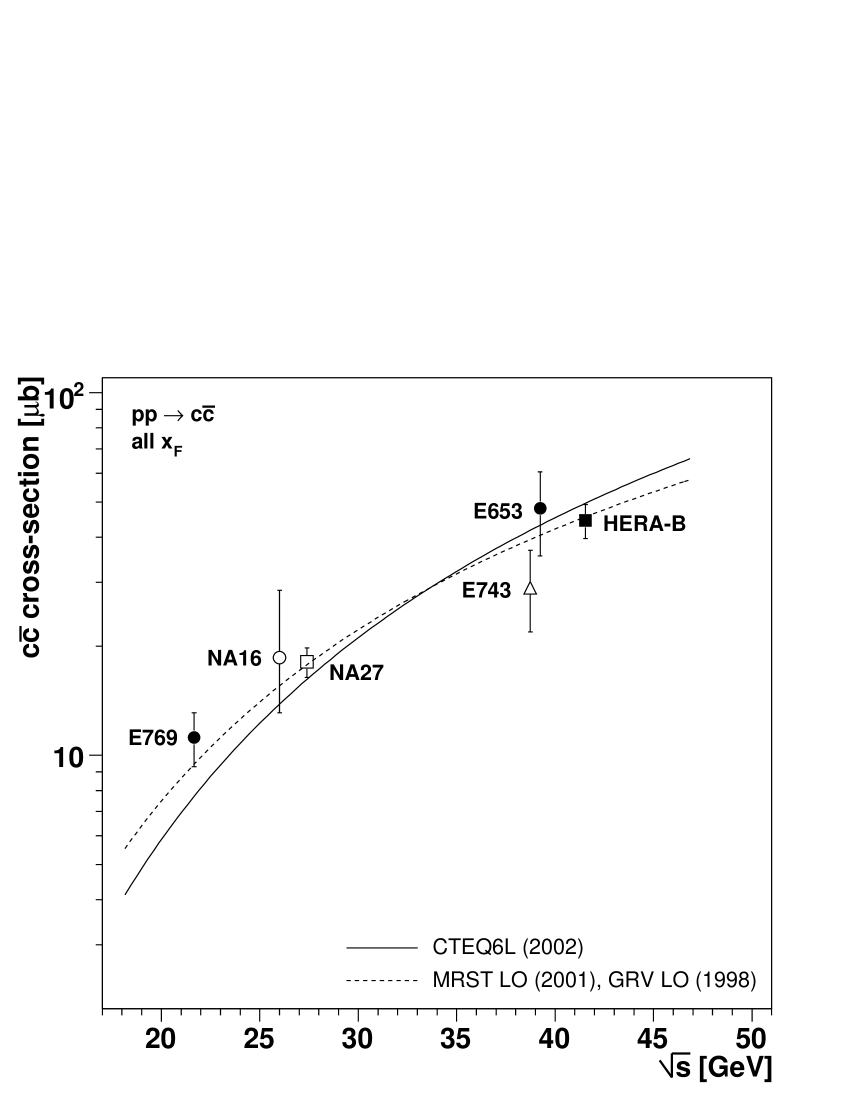
The left panel of Fig. 35 shows the neutral and charged D meson total production cross-sections, as a function of , including the final HERA-B values, compared to curves calculated with Pythia with and three different LO PDF sets (this figure supersedes the top panels of Fig. 12). The right panel of this figure updates the total cross-sections, previously shown in Fig. 16-left, replacing the preliminary HERA-B value (given in Table 6) by the new value: b. The K-factors resulting from the new fits to the data points are 2.8, 3.6 and 4.4 for the CTEQ6L, MRST LO and GRV LO PDF sets, respectively (these values supersede those given in Table 12).
It is particularly remarkable that the final HERA-B value for the ratio of charged to neutral D meson cross-sections is , in very good agreement with the value expected when setting . Figure 36 shows the updated version of the left panel of Fig. 13.
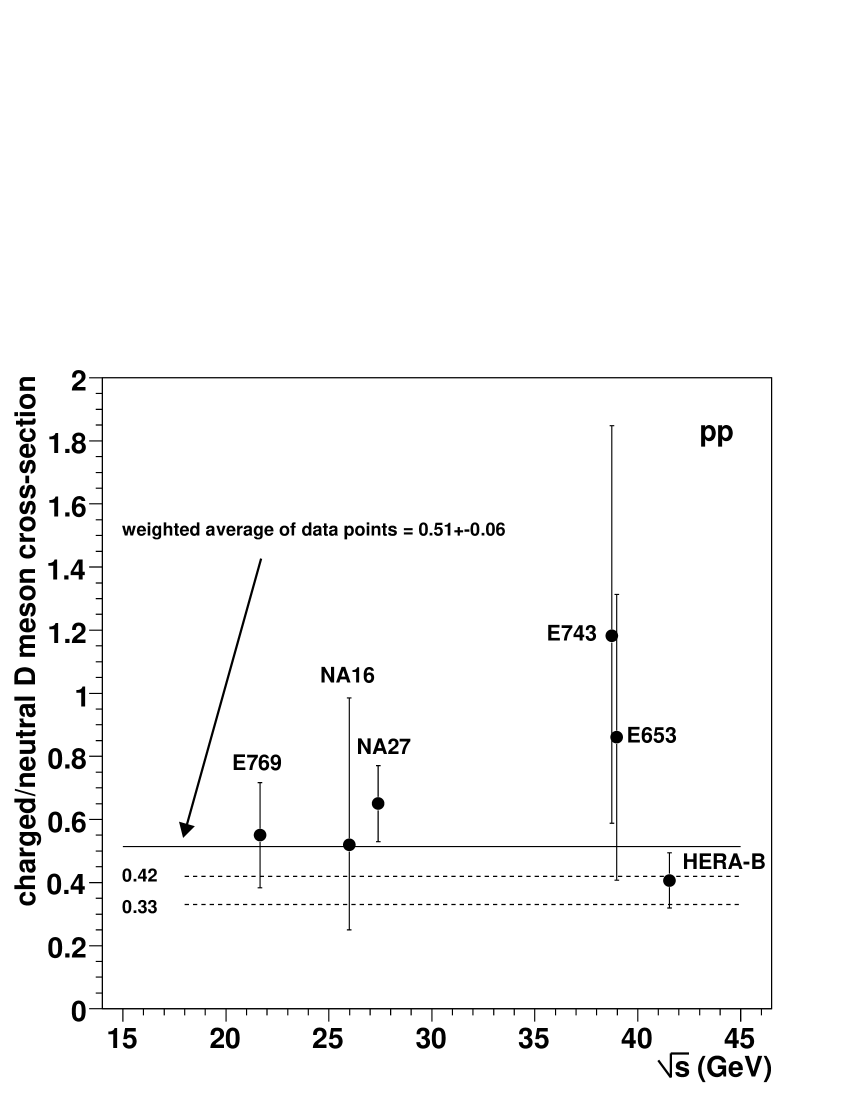
References
-
[1]
M. Mangano, Int. School of Physics “E. Fermi”,
Course 137, hep-ph/9711337;
J.A. Appel, Ann. Rev. of Nucl. and Part. Sci. 42 (1992) 367;
R.K. Ellis, W.J. Stirling and B.R. Webber, “QCD and Collider Physics”, Cambridge Univ. Press, 1996. - [2] R. Vogt, S. Frixione (Eds.), “Heavy Flavour Physics”, in CERN Yellow Report 2004-009, “Hard Probes in Heavy-Ion Collisions at the LHC”.
- [3] C. Lourenço and H. Satz (Eds.), Proc. of the Int. Conf. on Hard and Electromagnetic Probes of High Energy Nuclear Collisions, Eur. Phys. J. C43 (2005).
-
[4]
N. Brambilla et al. (QWG), “Heavy Quarkonium
Physics”, CERN Yellow Report 2005-005, hep-ph/0412158;
R. Vogt, Phys. Rep. 310 (1999) 197. - [5] R. Vogt et al. (Hard Probe Coll.), Int. J. Mod. Phys. E12 (2003) 211.
- [6] A. Baldit et al. (NA51 Coll.), Phys. Lett. B332 (1994) 244.
-
[7]
E.A. Hawker et al. (E866 Coll.),
Phys. Rev. Lett. 80 (1998) 3715;
J.C. Peng et al. (E866 Coll.) Phys. Rev. D58 (1998) 092004;
R.S. Towell et al. (E866 Coll.) Phys. Rev. D64 (2001) 052002. - [8] H. Plothow-Besch, Comp. Phys. Comm. 75 (1993) 396.
- [9] J. Pumplin et al., J. High Energy Phys. 07 (2002) 012.
-
[10]
A.D. Martin et al., Phys. Lett. B531 (2002) 216;
A.D. Martin et al., Eur. Phys. J. C23 (2002) 73. - [11] T. Sjöstrand et al., Comp. Phys. Comm. 135 (2001) 238.
- [12] K.J. Eskola, V.J. Kolhinen and C. Salgado, Eur. Phys. J. C9 (1999) 61.
- [13] K.J. Eskola, V.J. Kolhinen and R. Vogt, Nucl. Phys. A696 (2001) 729.
-
[14]
K.J. Eskola (Ed.), “PDFs,
shadowing and pA collisions”, in CERN Yellow Report 2004-009,
“Hard Probes in Heavy-Ion Collisions at the LHC”;
D. de Florian and R. Sassot, Phys. Rev. D69 (2004) 074028. - [15] C. Peterson et al., Phys. Rev. D27 (1983) 105.
-
[16]
B. Andersson et al., Phys. Rep. 97 (1983)
31;
“Fragmentation” chapter of Pythia’s manual and references therein. - [17] M.B. Bowler, Z. Phys. C11 (1981) 169.
- [18] M. Aguilar-Benitez et al. (NA16 Coll.), Nucl. Instrum. and Meth. 205 (1983) 79.
- [19] M. Aguilar-Benitez et al. (NA16 Coll.), Phys. Lett. B135 (1984) 237.
- [20] M. Aguilar-Benitez et al. (NA27 Coll.), Nucl. Instrum. and Meth. A258 (1987) 26.
- [21] M. Aguilar-Benitez et al. (NA27 Coll.), Z. Phys. C40 (1988) 321.
- [22] M. Aguilar-Benitez et al. (NA27 Coll.), Z. Phys. C31 (1986) 491.
- [23] R. Ammar et al. (E743 Coll.), Phys. Rev. Lett. 61 (1988) 2185.
- [24] L. Anderson et al. (NA10 Coll.), Nucl. Instrum. and Meth. 223 (1984) 26.
- [25] P. Bordalo et al. (NA10 Coll.), Z. Phys. C39 (1988) 7.
- [26] M.G. Catanesi et al. (WA78 Coll.), Nucl. Instrum. and Meth. A253 (1987) 222.
- [27] M.G. Catanesi et al. (WA78 Coll.), Phys. Lett. B231 (1989) 328.
-
[28]
S. Aoki et al. (WA75 Coll.),
Prog. Theor. Phys. 87 (1992) 1305;
S. Aoki et al. (WA75 Coll.), Prog. Theor. Phys. 87 (1992) 1315. -
[29]
R. Bailey et al. (NA11 Coll.),
Phys. Lett. B132 (1983) 230;
R. Bailey et al. (NA11 Coll.), Phys. Lett. B132 (1983) 237. - [30] R. Bailey et al. (NA11 Coll.), Z. Phys. C30 (1986) 51.
- [31] H. Palka et al. (NA11 Coll.), Z. Phys. C35 (1987) 151.
- [32] S. Barlag et al. (NA32 Coll.), Z. Phys. C37 (1987) 17.
- [33] S. Barlag et al. (NA32 Coll.), Z. Phys. C39 (1988) 451.
- [34] S. Barlag et al. (NA32 Coll.), Z. Phys. C49 (1991) 555.
- [35] K. Kodama et al. (E653 Coll.), Nucl. Instrum. and Meth. A289 (1990) 146.
- [36] K. Kodama et al. (E653 Coll.), Phys. Lett. B263 (1991) 573.
- [37] K. Kodama et al. (E653 Coll.), Phys. Lett. B284 (1992) 461.
- [38] K. Kodama et al. (E653 Coll.), Phys. Lett. B303 (1993) 359.
- [39] G.A. Alves et al. (E769 Coll.), Phys. Rev. Lett. 77 (1996) 2388.
- [40] E.M. Aitala et al. (E791 Coll.), Phys. Lett. B462 (1999) 225.
- [41] C. Albajar et al. (UA1 Coll.), Phys. Lett. B256 (1991) 121.
- [42] L. Apanasevich et al. (E706 Coll.), Phys. Rev. D56 (1997) 1391.
- [43] R. Jesik et al. (E672 and E706 Coll.), Phys. Rev. Lett. 74 (1995) 495.
- [44] M.J. Leitch et al. (E789 Coll.), Phys. Rev. Lett. 72 (1994) 2542.
- [45] D.M. Jansen et al. (E789 Coll.), Phys. Rev. Lett. 74 (1995) 3118.
- [46] T. Alexopoulos et al. (E771 Coll.), Nucl. Instrum. and Meth. A376 (1996) 375.
- [47] T. Alexopoulos et al. (E771 Coll.), Phys. Rev. Lett. 82 (1999) 41.
- [48] M. Adamovich et al. (WA92 Coll.), Nucl. Instrum. and Meth. A379 (1996) 252.
- [49] M. Adamovich et al. (WA92 Coll.), Nucl. Phys. B495 (1997) 3.
- [50] M. Adamovich et al. (WA92 Coll.) Nucl. Phys. B519 (1998) 19.
- [51] M. Adamovich et al. (WA82 Coll.), Nucl. Instrum. and Meth. A309 (1991) 401.
- [52] M. Adamovich et al. (WA82 Coll.), Phys. Lett. B284 (1992) 453.
- [53] D. Acosta et al. (CDF Coll.), Phys. Rev. D65 (2002) 052005.
- [54] D. Acosta et al. (CDF Coll.), Phys. Rev. Lett. 91 (2003) 241804.
- [55] D. Acosta et al. (CDF Coll.), Phys. Rev. D71 (2005) 032001.
- [56] I. Abt et al. (HERA-B Coll.), Eur. J. Phys. C26 (2003) 345.
- [57] I. Abt et al. (HERA-B Coll.), Phys. Rev. D73 (2006) 052005.
-
[58]
A. Zoccoli et al. (HERA-B Coll.),
Eur. Phys. J. C43 (2005) 179;
A. Zoccoli, private communication. - [59] S.P.K. Tavernier, Rep. Prog. Phys. 50 (1987) 1439.
-
[60]
J.L. Ritchie et al. (E595 Coll.),
Phys. Lett. B126 (1983) 499;
J.L. Ritchie et al. (E595 Coll.), Phys. Lett. B138 (1984) 213;
A. Badertscher et al. (NA18 Coll.), Phys. Lett. B123 (1983) 471;
O. Erriquez et al. (NA25 Coll.), Physica Scripta 33 (1986) 202;
M. Sarmiento et al. (E515 Coll.), Phys. Rev. D45 (1992) 2244. - [61] O. Botner et al., Phys. Lett. B236 (1990) 488.
- [62] S. Eidelman et al. (PDG), Phys. Lett. B592 (2004) 1.
- [63] J. Adler et al. (Mark III Coll.), Phys. Rev. Lett. 60 (1988) 89.
- [64] S. Barlag et al. (NA32 Coll.), Phys. Lett. B247 (1990) 113.
-
[65]
LEP Colls., Nucl. Instrum. and Meth. A378
(1996) 101;
L. Gladilin, “Charm hadron production fractions”, hep-ex/9912064;
S. Chekanov, Eur. Phys. J. C33 (2004) S488 (EPS-HEP 2003);
A. Aktas et al. (H1 Coll.), Eur. Phys. J. C38 (2005) 447. - [66] M. Cacciari, P. Nason and R. Vogt, Phys. Rev. Lett. 95 (2005) 122001.
-
[67]
H. Albrecht et al. (ARGUS Coll.), Phys.
Lett. B249 (1990) 359;
R. Fulton et al. (CLEO Coll.), Phys. Rev. Lett. 64 (1990) 16. - [68] C. Albajar et al. (UA1 Coll.), Phys. Lett. B256 (1991) 112.
- [69] O. Adriani et al. (L3 Coll.), Phys. Lett. B288 (1992) 412.
- [70] L. Montanet et al. (PDG), Phys. Rev. D50 (1994) 1173.
- [71] D. Coffman et al. (Mark III Coll.), Phys. Rev. Lett. 68 (1992) 282.
- [72] C. Caso et al. (PDG), Eur. Phys. J. C3 (1998) 1.
- [73] M. Aguilar-Benitez et al. (PDG), Phys. Lett. B170 (1986) 1.
-
[74]
R.M. Baltrusaitis et al. (Mark III Coll.),
Phys. Rev. Lett. 54 (1985) 1976;
M. Aguilar-Benitez et al. (NA27 Coll.), Z. Phys. C36 (1987) 559. - [75] R.M. Barnett et al. (PDG), Phys. Rev. D54 (1996) 1.
- [76] H.G. Fischer and W.M. Geist, Z. Phys. C19 (1983) 159.
- [77] A. Ali, Z. Phys. C1 (1979) 25.
- [78] M. Grossmann-Handschin et al. (NA10 Coll.), Phys. Lett. B179 (1986) 170.
- [79] E.L. Berger, Phys. Rev. D37 (1988) 1810.
- [80] R.K. Ellis and C. Quigg, “A pinacoteca of cross-sections for hadroproduction of heavy quarks”, FERMILAB-FN-0445 (1987).
- [81] P. Nason, S. Dawson and R.K. Ellis, Nucl. Phys. B327 (1989) 49; B335 (1990) 260.
- [82] W. Beenakker et al., Nucl. Phys. B351 (1991) 507.
- [83] M. Mangano, P. Nason, G. Ridolfi, Nucl. Phys. B405 (1993) 507.
- [84] T. Sjöstrand, Comp. Phys. Comm. 39 (1986) 347.
- [85] M. Mangano, P. Nason, G. Ridolfi, Nucl. Phys. B373 (1992) 295.
- [86] H.U. Bengtsson and T. Sjöstrand, Comp. Phys. Comm. 46 (1987) 43.
- [87] T. Sjöstrand and M. Bengtsson, Comp. Phys. Comm. 43 (1987) 367.
- [88] E. Eichten et al., Rev. Mod. Phys. 56 (1984) 579; 58 (1985) 1065.
- [89] J.F. Owens, Phys. Rev. D30 (1984) 943.
- [90] P. Nason, S. Dawson and R.K. Ellis, Nucl. Phys. B303 (1988) 607.
-
[91]
J. Chrin, Z. Phys. C36 (1987) 163;
D. Decamp et al. (ALEPH Coll.), Phys. Lett. B244 (1990) 551. - [92] T. Sjöstrand, CERN-TH 6488/92 (1992).
- [93] T. Sjöstrand, Comp. Phys. Comm. 82 (1994) 74.
- [94] F. Paige and S.D. Protopopescu, “ISAJET 5.20: A Monte Carlo event generator for pp and p interactions”, BNL Report No. 38034 (1986).
- [95] C. Albajar et al. (UA1 Coll.), Phys. Lett. B213 (1988) 405.
-
[96]
A. Martin et al., Phys. Lett. B306
(1993) 145;
A. Martin et al., Phys. Lett. B443 (1998) 301;
A. Martin et al., Eur. Phys. J. C4 (1998) 463. - [97] P. Avery, K. Read and G. Trahern, “QQ: A Monte Carlo Generator”, CLEO Software Note CSN-212, 1985.
- [98] M. Cacciari and P. Nason, Phys. Rev. Lett. 89 (2002) 122003.
- [99] M. Cacciari, Proc. of the “39th Rencontres de Moriond on QCD and High-Energy Hadronic Interactions”, La Thuile, Italy, 2004, hep-ph/0407187.
-
[100]
D. Acosta et al. (CDF Coll.), Phys. Rev. D66 (2002) 032002;
T. LeCompte, private communication. - [101] G. Marchesini et al., Comp. Phys. Comm. 67 (1992) 465.
- [102] S. Frixione, P. Nason and B.R. Webber, J. High Energy Phys. 08 (2003) 7.
- [103] U. Kerzel, “Measurements of b and c quark fragmentation functions and of orbitally excited B states”, XI Int. Work. on DIS (DIS2003), St. Petersburg, Russia, 2003, http://www.desy.de/dis03/wgd/apr24/wgd24_kerzel.pdf
- [104] E. Norrbin and T. Sjöstrand, Phys. Lett. B442 (1998) 407.
- [105] E. Norrbin and T. Sjöstrand, Eur. Phys. J. C17 (2000) 137.
- [106] M. Gluck, E. Reya and A. Vogt, Eur. Phys. J. C5 (1998) 461.
- [107] C. Lourenço, Nucl. Phys. A610 (1996) 552c.
-
[108]
A. David, “Charm hadronization fractions”, XLIII
Int. Winter Meeting on Nuclear Physics, Bormio, Italy, 2005,
http://cern.ch/adavid/pv-Bormio05.pdf;
A. David, PhD Thesis, IST, Lisbon, 2006 (CERN/THESIS-2006-7). - [109] P. Braun-Munzinger et al., Eur. Phys. J. C1 (1998) 123.
- [110] K. Adcox et al. (PHENIX Coll.), Phys. Rev. Lett. 88 (2002) 192303.
- [111] B. Osculati et al. (WA82 Coll.), Nucl. Phys. Proc. Suppl. 27 (1992) 212.
- [112] G.A. Alves et al. (E769 Coll.), Phys. Rev. Lett. 77 (1996) 2392.
- [113] M. Aguilar-Benitez et al. (NA27 Coll.), Phys. Lett. B161 (1985) 400.
- [114] M. Adamovich et al. (WA82 Coll.), Phys. Lett. B305 (1993) 402.
- [115] G.D. Lafferty and T.R. Wyatt, Nucl. Instrum. Meth. A355 (1995) 541.
-
[116]
S. Frixione et al., Nucl. Phys. B431
(1994) 453;
Adv. Ser. Direct. High Energy Phys. 15 (1998) 609, hep-ph/9702287. - [117] M. Aguilar-Benitez et al. (NA27 Coll.), Phys. Lett. B164 (1985) 404.
- [118] S. Aoki et al. (WA75 Coll.), Phys. Lett. B209 (1988) 113.
-
[119]
S. Barlag et al. (NA32 Coll.),
Phys. Lett. B257 (1991) 519;
S. Barlag et al. (NA32 Coll.), Phys. Lett. B302 (1993) 112;
K. Rybicki and R. Rylko, Phys. Lett. B353 (1995) 547. - [120] K. Kodama et al. (E653 Coll.), Phys. Lett. B263 (1991) 579.
-
[121]
M. Adamovich et al. (WA92 Coll.),
Phys. Lett. B348 (1995) 256;
M. Adamovich et al. (WA92 Coll.), Phys. Lett. B385 (1996) 487. - [122] E.M. Aitala et al. (E791 Coll.), Eur. Phys. J. direct C1 (1999) 4 (hep-ex/9809029).
- [123] E. Norrbin, Proc. of the 4th Workshop on Heavy Quarks at Fixed Target, Batavia, IL, October 1998, hep-ph/9812460.
- [124] J.M. Link et al. (FOCUS Coll.), Phys. Lett. B566 (2003) 51.
-
[125]
E.M. Aitala et al. (E791 Coll.),
Phys. Lett. B371 (1996) 157;
E.M. Aitala et al. (E791 Coll.), Phys. Lett. B411 (1997) 230. - [126] G.A. Alves et al. (E769 Coll.), Phys. Rev. Lett. 70 (1993) 722.
- [127] H. Cobbaert et al. (WA78 Coll.), Phys. Lett. B206 (1988) 546.
- [128] H. Cobbaert et al. (WA78 Coll.), Phys. Lett. B191 (1987) 456.
- [129] M. MacDermott, S. Reucroft, Phys. Lett. B184 (1987) 108.
- [130] D.S. Barton et al., Phys. Rev. D27 (1983) 2580.
- [131] F. Antinori, “Heavy Flavour Production and Nucleus Nucleus Collisions”, in “HEP2005 Int. Europhysics Conf. on High Energy Physics”, Lisboa, Portugal; http://www.lip.pt/events/2005/hep2005/talks/session6.html
- [132] F. Abe et al. (CDF Coll.), Phys. Rev. Lett. 79 (1997) 572.
- [133] M. Cacciari et al., J. High Energy Phys. 07 (2004) 033.
-
[134]
B. Alessandro et al. (NA50 Coll.),
Phys. Lett. B553 (2003) 167;
B. Alessandro et al. (NA50 Coll.), Eur. Phys. J. C33 (2004) 31. - [135] B. Alessandro et al. (NA50 Coll.), Eur. Phys. J. C39 (2005) 335.
-
[136]
C. Lourenço et al. (NA38 Coll.),
Nucl. Phys. A566 (1994) 77c;
M.C. Abreu et al. (NA38 and NA50 Colls.), Eur. Phys. J. C14 (2000) 443. - [137] J.L. Collins and D.E. Soper, Phys. Rev. D23 (1981) 1070.
-
[138]
S.S. Adler et al. (PHENIX Coll.),
Phys. Rev. Lett. 96 (2006) 032001;
O. Drapier et al. (PHENIX Coll.), Eur. Phys. J. C43 (2005) 201. -
[139]
J. Adams et al. (STAR Coll.),
Phys. Rev. Lett. 94 (2005) 062301;
M. Calderón de la Barca Sánchez et al. (STAR Coll.), Eur. Phys. J. C43 (2005) 187;
A. Suaide et al. (STAR Coll.), Eur. Phys. J. C43 (2005) 193. - [140] A. Zoccoli et al. (HERA-B Coll.), private communication; publication in preparation.