Directed and elliptic flow in heavy ion collisions from MeV/nucleon to GeV/nucleon
Abstract
Recent data from the NA49 experiment on directed and elliptic flow for Pb+Pb reactions at CERN-SPS are compared to calculations with a hadron-string transport model, the Ultra-relativistic Quantum Molecular Dynamics (UrQMD) model. The rapidity and transverse momentum dependence of the directed and elliptic flow, i.e. and , are investigated. The flow results are compared to data at three different centrality bins. Generally, a reasonable agreement between the data and the calculations is found. Furthermore, the energy excitation functions of and from MeV to GeV are explored within the UrQMD framework and discussed in the context of the available data. It is found that, in the energy regime below GeV, the inclusion of nuclear potentials is necessary to describe the data. Above GeV beam energy, the UrQMD model starts to underestimate the elliptic flow. Around the same energy the slope of the rapidity spectra of the proton directed flow develops negative values. This effect is known as the third flow component (”antiflow”) and cannot be reproduced by the transport model. These differences can possibly be explained by assuming a phase transition from hadron gas to quark gluon plasma at about GeV.
pacs:
25.75.Ld, 25.75.Dw, 25.75.GzI Introduction
To create extremely hot and dense matter with partons as its fundamental components - called the Quark-Gluon Plasma (QGP) - is a major goal of current and future high energy heavy-ion collisions experiments at SPS, RHIC and LHC QM2005 . However, due to the complex nature of the relativistic nucleus-nucleus reactions, the QGP, if it has been created, escapes direct detection. Therefore, in order to establish the existence and later on to investigate the properties of the new state of matter, one must find observables which allow to deduce the properties of the intermediate (QGP) state from the final state hadrons.
The exploration of the transverse collective flow is the earliest predicted observable to probe heated and compressed nuclear matter Scheid:1974yi . The transverse flow is intimately connected to the pressure gradients. Therefore, it is sensitive to the equation of state (EoS) and might be used to search for abnormal matter states and phase transitions Stoecker:1979mj ; Hofmann:1976dy ; Stoecker:1986ci .
The intermediate energy regime available at CERN-SPS or at the future GSI-FAIR facility is often referred to as the right place to look for a phase transition to the QGP. Lattice QCD (lQCD) calculations Fodor:2001pe ; Fodor:2002km show that the critical temperature is around 170 MeV (for ) and the critical energy density is around 1 . These values can already be reached at 20-30 AGeV beam energy. At finite baryo-chemical potential, the heated and compressed nuclear matter created at these energies crosses the phase transition line possibly even on the high side of the critical endpoint. Therefore, it is possible to talk about a phase transition of first order, here. During such a first order phase transition the softest point in the equation of state would be mostly pronounced. For example, the proton antiflow around midrapidity (“third flow component”Csernai:1999nf ) and the collapse of the elliptic flow observable have been declared as a signal for the phase transition Stoecker:2004qu ; Stoecker:2004xc .
In this paper, recent results on proton and pion directed and elliptic flow from the NA49 experiment Alt:2003ab are investigated and predictions for FAIR are presented. The data is compared to transport model calculations (UrQMD v2.2). The proton flow measures the behaviour of the nuclear matter during a heavy ion collision, while the flow of pions is a sign for the properties of newly produced particles.
The paper is organized as follows. Section II includes an introduction of the UrQMD model. Section III and IV introduce the flow systematics and the different measurement methods. Then, in Section V, the directed flow results are shown. There are rapidity and transverse momentum distributions for 40 and 160 AGeV beam energy. The centrality dependence is also studied. Predictions for rapidity and dependence of for GeV and GeV are made. In section V (C) the energy dependence of the slope around midrapidity of the directed flow is investigated in the context of the available data. Afterwards, in Section VI, the same analysis for the rapidity and transverse momentum dependence of elliptic flow () is shown. Section VI (C) discusses the excitation function of elliptic flow over the whole energy range from SIS to RHIC. Section VII summarizes the paper.
II The UrQMD model
For our investigation, the Ultra-relativistic Quantum Molecular Dynamics model (UrQMD v2.2) Bleicher:1999xi ; Bass:1998ca is applied to heavy ion reactions from MeV to GeV. This microscopic transport approach is based on the covariant propagation of constituent quarks and diquarks accompanied by mesonic and baryonic degrees of freedom. It simulates multiple interactions of in-going and newly produced particles, the excitation and fragmentation of colour strings and the formation and decay of hadronic resonances. Towards higher energies, the treatment of sub-hadronic degrees of freedom is of major importance. In the present model, these degrees of freedom enter via the introduction of a formation time for hadrons produced in the fragmentation of strings Andersson:1986gw ; Nilsson-Almqvist:1986rx ; Sjostrand:1993yb . A phase transition to a quark-gluon state is not incorporated explicitly into the model dynamics. However, a detailed analysis of the model in equilibrium, yields an effective equation of state of Hagedorn type Belkacem:1998gy ; Bravina:1999dh .
The UrQMD transport model is successful in describing the yields and the spectra of different particles in pp and pA collisions Bratkovskaya:2004kv . It has also been applied to study the flow at lower energies and at RHIC energies(Bleicher:2005ti ; Winckelmann:1996vu ; Bleicher:1998wv ; Lu:2006qn ; Zhu:2006fb ; Zhu:2005qa ).
III Flow systematics
The first coefficient of the Fourier expansion of the azimuthal distribution of the emitted particles () describes the directed in-plane flow. The directed flow measures the total amount of transverse flow. It is most pronounced in semi-central interactions around target and projectile rapidities where the spectators are deflected away from the beam axis due to a bounce-off from the compressed and heated matter in the overlap region. is defined by
| (1) |
where denotes the azimuthal angle of one outgoing particles and is the azimuthal angle of the reaction plane. The angular brackets denote an average over all considered particles from all events.
Three different interesting properties of the directed flow have been proposed.
-
•
The time scales probed by the directed flow are set by the crossing time of the Lorentz-contracted nuclei. Thus, it serves as keyhole to the initial, probably non-equilibrium, stage of the reaction Kolb:2000sd .
-
•
The softening of the equation of state in a first order phase transition leads to a decreasing directed flow Rischke:1995pe ; Bleicher:2002xx ; Soff:1999yg .
-
•
The space-momentum correlation of the emitted particles can be adressed experimentally via the rapidity distributions of nucleons and pions.
The second coefficient of the Fourier expansion of the azimuthal distribution of the emitted particles () is called elliptic flow Sorge:1998mk ; Ollitrault:1992bk ; Hung:1994eq ; Rischke:1996nq ; Sorge:1996pc ; Heiselberg:1998es ; Csernai:1999nf ; Brachmann:1999xt ; Brachmann:1999mp ; Zhang:1999rs ; Bleicher:2000sx . This type of flow is strongest around central rapidities in semi-peripheral collisions. It is driven by the anisotropy of the pressure gradients, due to the geometric anisotropy of the initial overlapping region. Therefore, it is a valuable tool to gain insight into the expanding stage of the fire ball. is defined by
| (2) |
There are two competing effects which lead to contributions with different signs to the integrated value. At low energies or early times there is the so called “squeeze-out”-effect. The spectator matter blocks the emission in the impact parameter direction and therefore the flowing matter is “squeezed”-out perpendicularly to the reaction plane. This leads to negative elliptic flow values. The second effect is the so called in-plane flow. This type of flow becomes important at higher energies and/or later times. At higher bombarding energies ( GeV) the spectators leave the interaction zone quickly. The remaining hot and dense matter expands almost freely, where the surface is such that in-plane emission is preferred. Therefore the elliptic flow receives a positive contribution.
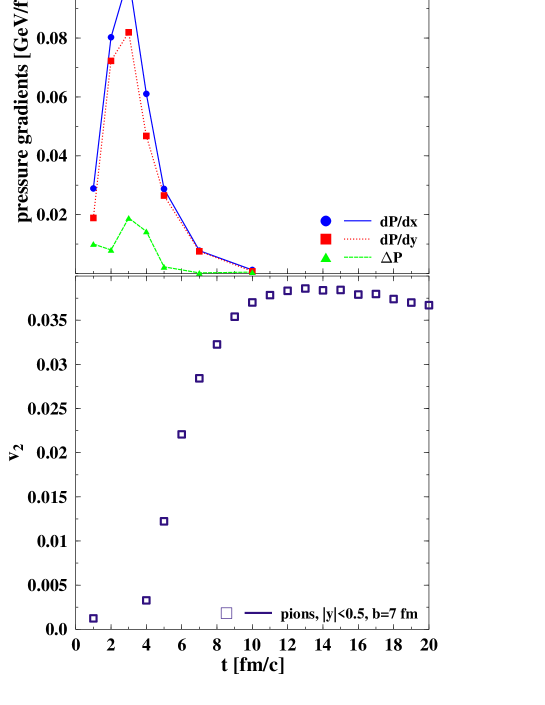
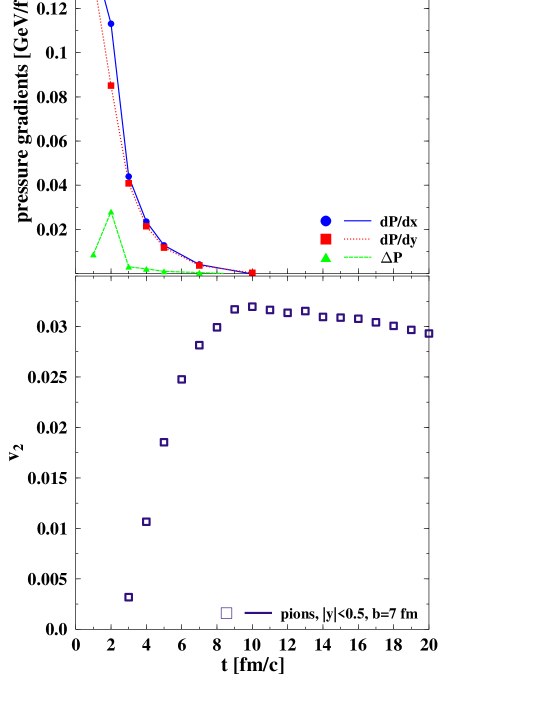
Let us now explore the time evolution of the pressure gradients in connection with the elliptic flow development. The transverse pressure gradients have been calculated for the first 10 fm at GeV (see Fig. 1) and the highest SPS energy (see Fig. 2). In both cases one observes large pressure gradients in the very early stage of the collision. For the lower energy the maximum is reached around fm and for the higher energy it is shifted to even earlier times. The difference between the pressure gradients in x- and y- direction is responsible for the development. As it can be seen in Figs. 1(bottom) and 2(bottom) the temporal evolution of elliptic flow for pions starts exactly after this maximum. The elliptic flow increases during fm until it reaches almost its final value. After fm it decreases a little because of resonance decays. So, elliptic flow builds up in the early stage of the collision due to the difference of pressure gradients as it is expected.
IV Flow measurement methods
In the UrQMD model calculation of flow, the exact azimuthal angle of the reaction plane is known by definition. However, an unambiguous experimental measurement of the azimuthal anisotropic flow is not a trivial task due to the unknown orientation of the reaction plane. Often, experiments use the so called reaction plane method Poskanzer:1998yz to extract the magnitude of flow. In this method, the reaction plane is fixed according to the flow vector of the event, then the estimated with respect to the chosen reaction plane is corrected for the event plane resolution, which accounts for the error in the deduction of the reaction plane.
However, these two-particle correlations based method might suffer from effects which are not related to the reaction plane, these additional contributions are usually called non-flow effects Borghini:2000cm , such as the overall transverse momentum conservation, small angle azimuthal correlations due to final state interactions, resonance decays, jet production Kovchegov:2002nf and quantum correlations due to the HBT effect Dinh:1999mn . Recently, the cumulant method was proposed Borghini:2000sa ; Borghini:2001vi to diminish the non-flow effects. The idea of the cumulant method is to extract flow with many-particle cumulants, which are the many-particle correlations with subtraction of the contributions from the correlations due to the lower-order multiplets. It is believed that the pure many-particle non-flow correlations have much less contributions to the measured flow in the many-particle cumulant method. In other words, the many-particle cumulant method should be much less sensitive to non-flow effects Borghini:2000sa ; Borghini:2001vi .
This has been confirmed by the test of the cumulant method with the UrQMD model Zhu:2006fb ; Zhu:2005qa . However, the test also shows that, at least for the measurement, the cumulant method is not completely free from the effect of event-by-event fluctuations miller03 . Especially when the genuine signal is weak (for example, for the most central events and very peripheral events), the effect of fluctuations could be so strong that the results from the cumulant method becomes unreliable.
V Directed flow results
V.1 Rapidity dependence
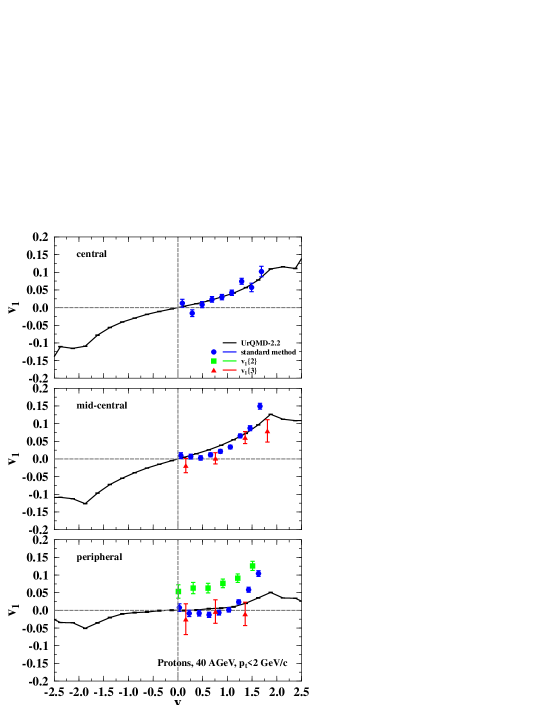
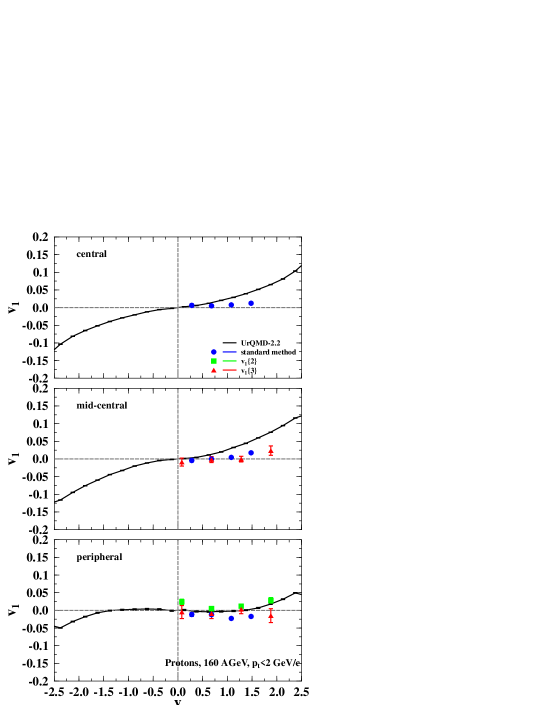
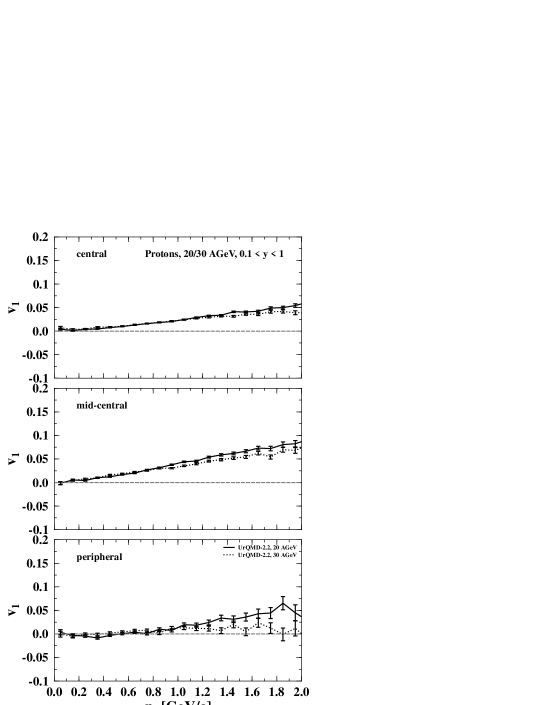
Fig. 3 shows the rapidity dependence of the directed flow of protons for central ( fm), mid-central ( fm) and peripheral ( fm) Pb+Pb reactions at GeV. The symbols denote data by the NA49 collaboration analyzed with different methods Alt:2003ab . UrQMD calculations are depicted with black lines. The directed flow is most pronounced at high rapidity values where the bounced off spectator matter sits.
The strong centrality dependence of can be seen, as the shape of the curves changes drastically from central to peripheral collisions. Overall, the model calculations are in line with the data from the event plane method (standard method, full circle). It is interesting to note that one kind of non-flow effects, i.e. momentum conservation, has been subtracted in this reaction plane method already Borghini:2002mv . Unfortunately, the 2-particle cumulant measurements seem to be affected by the non-flow effects which are in this analysis dominated by momentum conservation. This effect is most pronounced for peripheral collisions. Here, the experimental data points do not approach zero at midrapidity. For the more reliable 3-particle cumulant method Borghini:2002vp , the experimental results agree well with those of the reaction plane method within the statistical error (please see also the following data). This indicates that the momentum conservation corrected reaction plane method gives also reliable data.
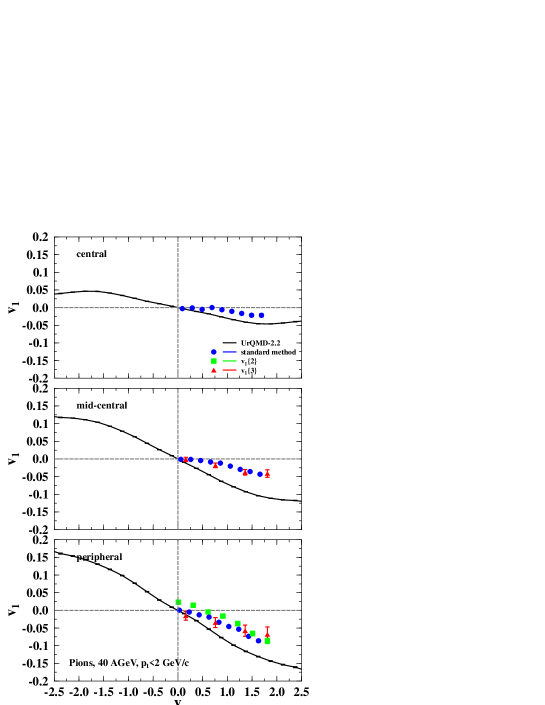
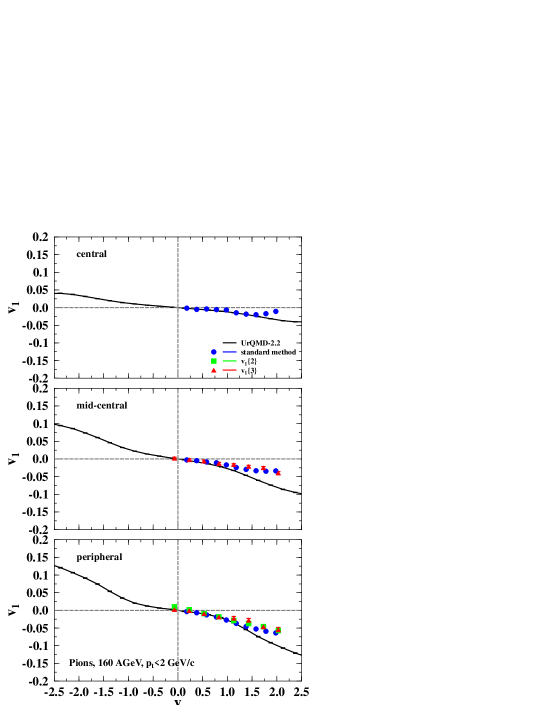
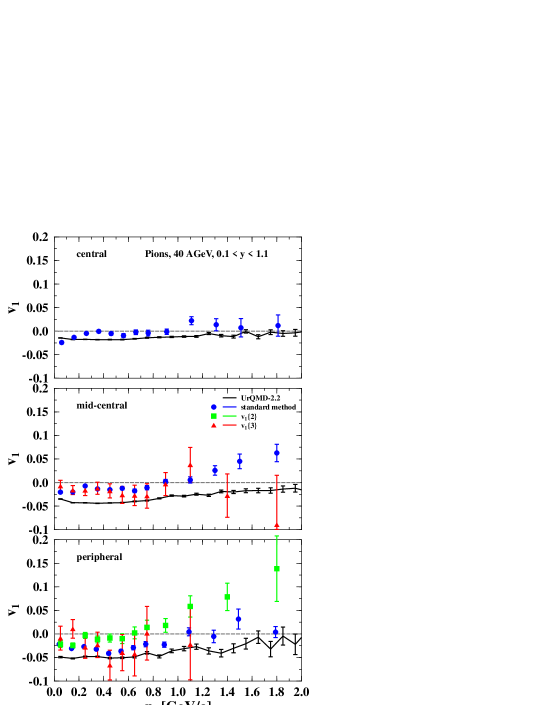
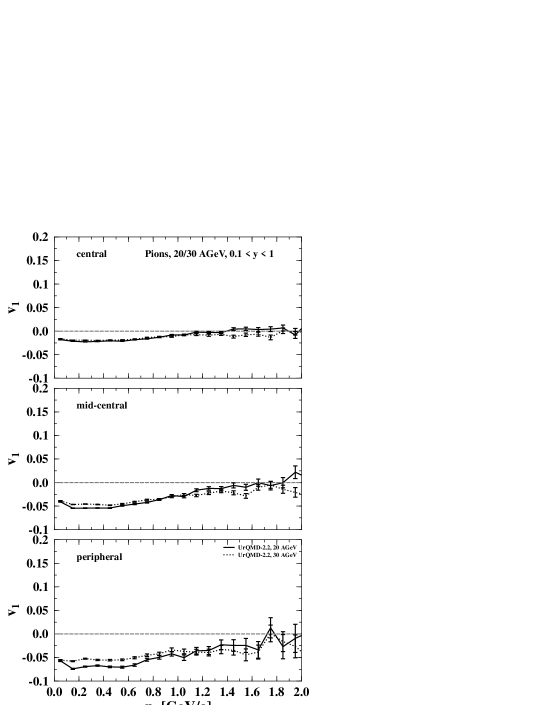
Fig. 4 shows directed flow of pions at GeV. The different sign with respect to the proton flow can be explained by shadowing. The pions are newly produced mesons and therefore they are composed by a quark and especially an anti-quark. Therefore, the cross-section of the pions with the nuclear matter is so large that they cannot escape in the direction where the rest of the colliding nuclei/spectator matter resides.
For peripheral collisions the measured directed flow reaches the same amount as for protons (about 10% at ), but for central collisions it is much less (only about 2.5% at ). The UrQMD calculations overestimate the pion directed flow at large rapidities by about a factor of two for all centralities. This overestimation might be explainable if one assumes that the NA49 collaboration is not able to measure all produced pions. Especially pions produced from nucleons which fly straight ahead through the collision producing only one or two pions appear only in the veto calorimeter. However, in the model calculations every produced pion within the given rapidity and transverse momentum bin is taken into account.
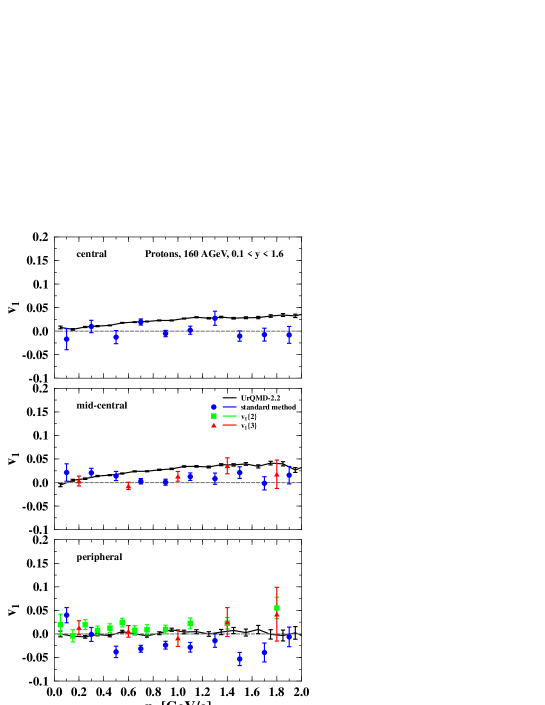
In Fig. 5, directed flow of protons at GeV is shown. In this case the model calculations slightly overestimate the flow at higher rapidities in contrast to the proton flow at GeV. Surprisingly, the data stays almost constant at zero. Even in peripheral collisions there are only about at for the reaction plane method analysis. The flat shape of the curve with respect to the lower energy results can be explained by the spectators sit at higher rapidity values in this plot. This spectator matter is responsible for the directed flow near beam/target rapidities. Since there are no data points of the reaction plane method above this increase is not seen.
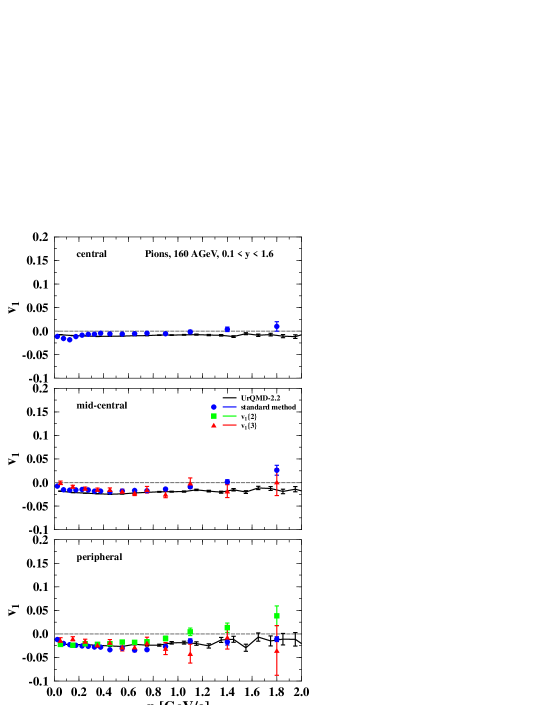
For the pion directed flow at the higher SPS energy (Fig. 6), one observes a reasonable agreement between the model calculations and the data from all three measurement methods, i.e. reaction plane method, and . Above , the UrQMD results increase slightly stronger than the data. The centrality dependence is reproduced correctly. Both in the model and in the experimental data there is an increase in flow for more peripheral collisions.
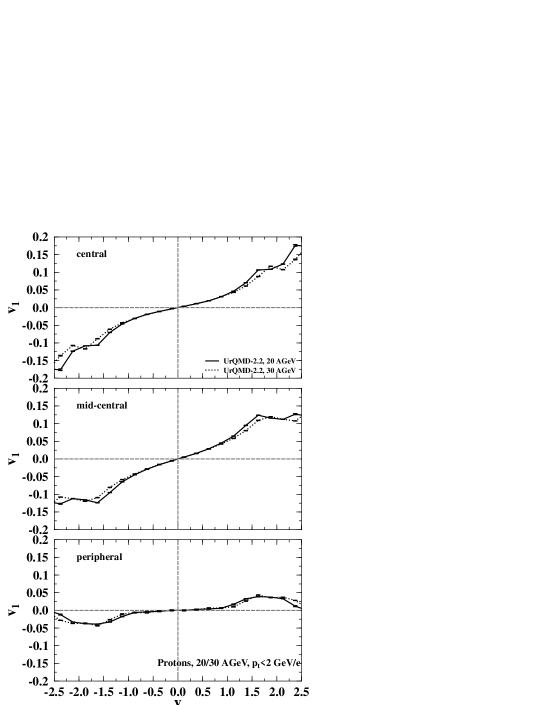
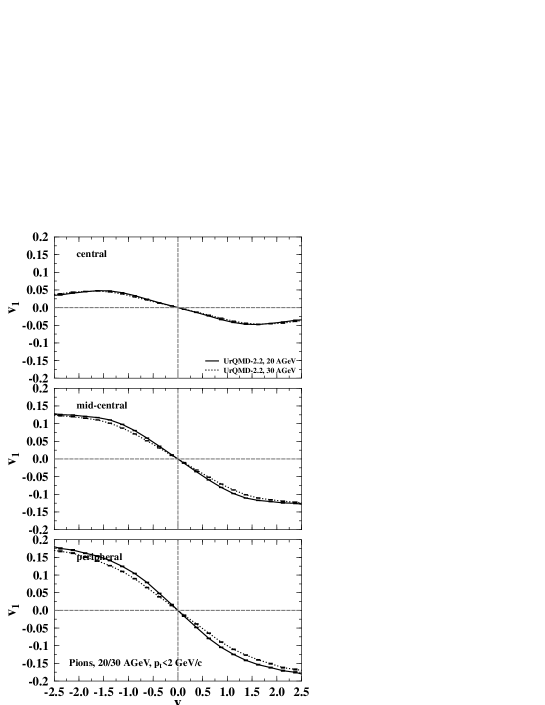
Fig. 7 and Fig. 8 are predictions for the rapidity dependence of proton and pion directed flow at GeV and GeV. The shown results are calculated using the UrQMD model with a transverse momentum cut of GeV/c. In the present model, the calculated directed flow results at these energies under investigation at the new FAIR facility at GSI look rather similar to that at GeV. There is also an inverse centrality dependence for protons and pions in the amount of the directed flow. It is very interesting to see if the experimental proton flow data at this energy will show the negative slope around midrapidity as predicted.
V.2 Transverse momentum dependence
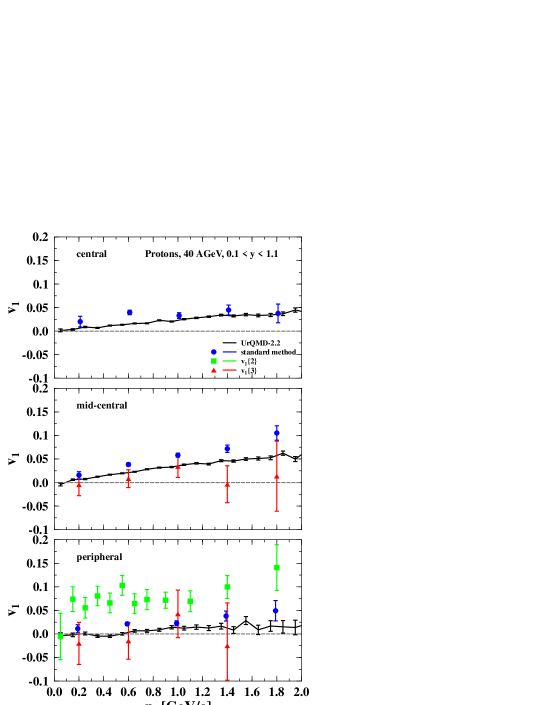
Fig. 9 shows directed flow of protons at GeV as a function of transverse momentum. For the calculation the same rapidity cut () as in the data obtained with the cumulant method has been used. For the standard reaction plane analysis the different cut of has been applied. The different cuts have been used by the experimental collaboration to improve the statistics and reduce the time amount for the analysis. Since the higher order cumulant method measurements are the most reliable way to reduce systematic errors Zhu:2006fb ; Zhu:2005qa , the comparisons are done with the cuts for the cumulant method. The calculations are in line with the data for mid-central and peripheral collisions. Unfortunately, the statistical errors are the biggest for this method and there are only a few data points because it is the newest and most elaborate analysis.
The transverse momentum dependence of the pion directed flow at GeV (Fig. 10) shows many uncertainties. The data differs very much depending on the analysis method. Furthermore, the cumulant method of order 3 has large statistical error bars. The UrQMD calculations are negative as the sign convention suggests. It is remarkable that the directed flow does not show any clear transverse momentum dependence.
Next, we turn to the results for GeV collisions. For central collisions the calculated transverse momentum dependence of the directed flow of protons at GeV (see Fig. 11) starts at zero for and increases steadily until 2% at GeV/c. The measured data fluctuates between and . Going to mid-central collisions the calculations are quite in line with the third order cumulant method and the standard method data. In peripheral collisions there are big systematic uncertainties because especially around GeV/c the data points differ between and . The second order cumulant results are higher, but they are not corrected due to momentum conservation. The negative directed flow of protons is consistent with the rapidity distribution. Because of the negative slope around midrapidity at the higher SPS energy the protons fly in the “wrong” direction.
The calculated directed flow for pions at GeV, as depicted in Fig. 12, stays constant as a function of the transverse momentum at for central, at for mid-central and at for peripheral collisions. In mid-central and peripheral collisions this trend is in line with the third order cumulant measurement. Especially the data from second order cumulant increase up to . This is probably due to momentum conservation which is not taken into account to correct the data. The negative directed flow of pions is consistent with the rapidity dependence in the chosen bin.
Finally, we show the prediction for the transverse momentum dependence of directed flow at GeV and GeV in Figs. 13 and 14. In the present calculations, the shape and magnitude of the flow are similar to the results at GeV. The directed flow of pions at GeV and GeV looks also rather similar to the calculations for the pion directed flow at GeV. But there is a difference for peripheral collisions. The value is only about compared to at GeV.
V.3 Excitation function
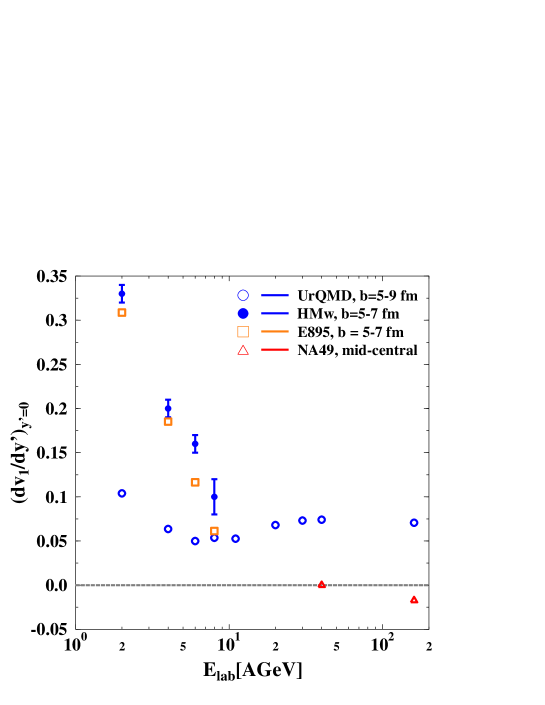
To characterize the amount and the direction of the directed flow of protons over the energy range from GeV one can extract the slope around midrapidity from the normalized rapidity distributions usually referred to as the “F” parameter Liu:2000am . “Normalized” means in this case where is the beam rapidity. This normalization accounts for the trivial energy dependence of the slope. The values for the slope in Fig. 15 have been extracted via a polynomial fit of the form with . At low energies, one observes that the inclusion of a nuclear potential is needed to reproduce the data. Here is shown the calculation with included mean field from a hard equation of state with momentum dependence and medium-modified nucleon-nucleon cross sections (HMw)Li:2005gf ; Li:2006ez . At higher energies the calculation has been performed in the cacsade mode without the additional inclusion of nuclear potentials.
At SPS energies the data develops even negative values for the slope around midrapidity Stoecker:2004qu ; Stoecker:2004xc . This behaviour cannot be reproduced within the transport model calculation. However, ideal hydro calculations have predicted the appearance of a so-called ”third flow component” Csernai:1999nf or ”antiflow” Brach00 at finite impact parameters. In these analysis’ it was pointed out that this “antiflow” develops if the matter undergoes a first order phase transition to the QGP. In contrast, a hadronic EoS without QGP phase transition did not yield such an exotic ”antiflow” (negative slope) wiggle in the proton flow at low energies.
VI Elliptic flow
VI.1 Rapidity dependence
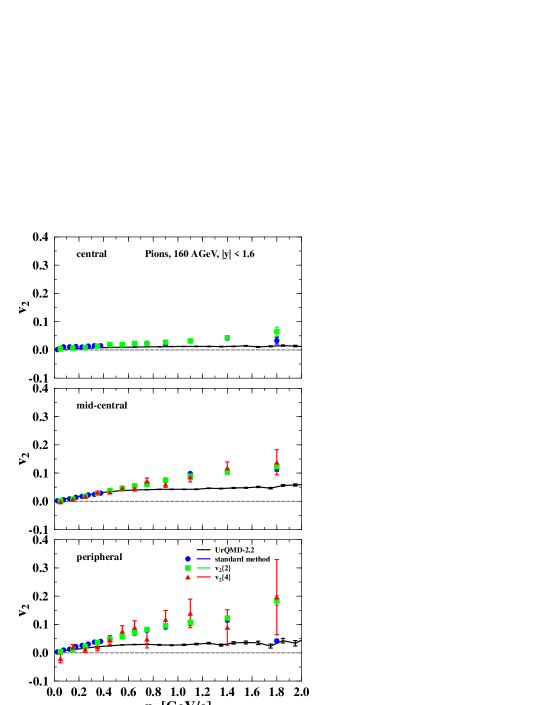
Elliptic flow develops because of the almond shape of the overlapping region in a heavy ion collision. The breakdown of proton elliptic flow at GeV has been stressed as a signal for the observation of a first order phase transition Stoecker:2004xc . As can be seen from the NA49 data in Fig. 16, the elliptic flow parameter vanishes at midrapidity only for the standard reaction plane method data, which could be affected by the non-flow effects. The cumulant measurements show a completely different shape. The second and fourth order measurements for peripheral and mid-central collisions increase to about around midrapidity not consistent with zero. Looking now at the UrQMD calculations one cannot observe an overestimation, but finds that the results are compatible with the data. Therefore, before one can draw concise conclusions the systematic and statistical uncertainties of the data must be resolved.
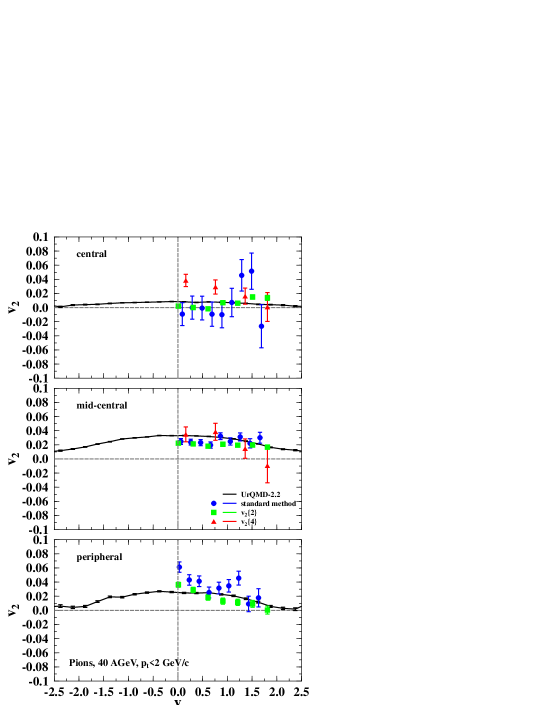
For the elliptic flow of pions (Fig. 17) in central collisions there are again systematic uncertainties in the experimental data. Again all three methods have different shapes and the calculated elliptic flow value is consistent with the measurement with errors. The elliptic flow increases to about around midrapidity within the UrQMD model. For mid-central collisions the picture becomes clearer. The data and the calculations are in line. Here, the elliptic flow around midrapidity is about . Going to peripheral collisions the experimental results of the standard method show an unsteady behaviour but are compatible with the UrQMD calculations.
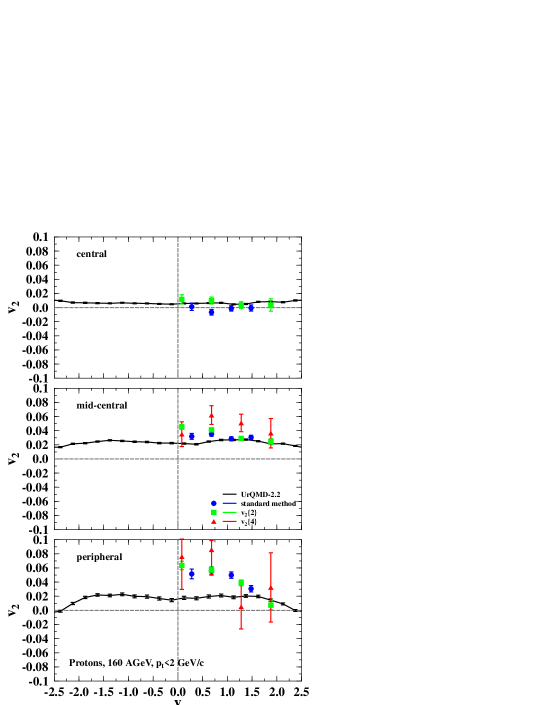
The elliptic flow is expected to be larger in more peripheral collisions because the anisotropy in coordinate space which is the source of this flow component is larger. This dependence can be seen very well in the proton flow at GeV (Fig.18). In central collisions there is almost no elliptic flow at all. Going to mid-central collisions the flow is between depending on rapidity and in peripheral collisions even between . The model calculations do not show a big difference between mid-central and peripheral collisions. Both values are about around midrapidity. The large elliptic flow data in peripheral collisions could be due to the fact of non-flow effects and/or large event-by-event fluctuations there, which affect the measurement heavily.
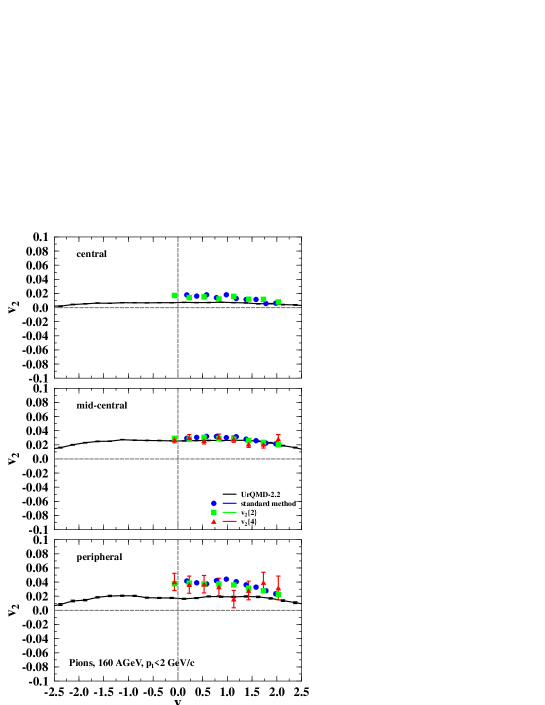
Fig. 19 shows the elliptic flow of pions at GeV. These newly produced particles show almost no elliptic flow in central collisions, i.e. they are emitted isotropically out of the collision region. The experimental result is between . In mid-central collisions there is a very good agreement between the model and data again. For peripheral collisions the same underestimation of the calculations as for the proton flow in comparison to the data can be seen.
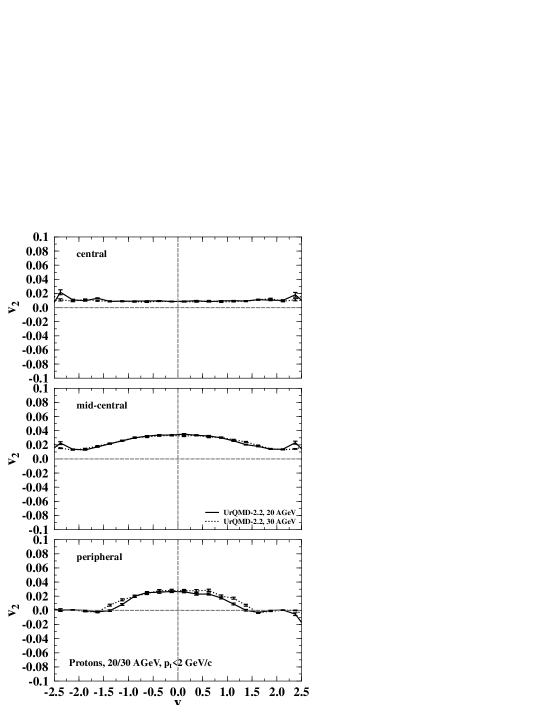
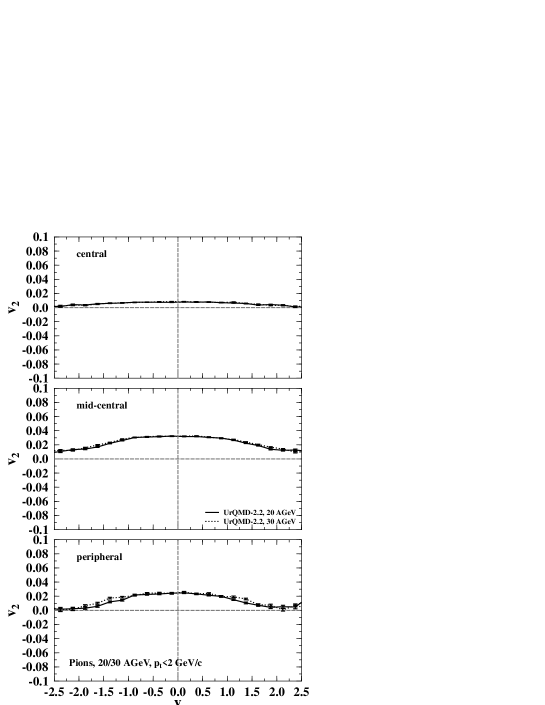
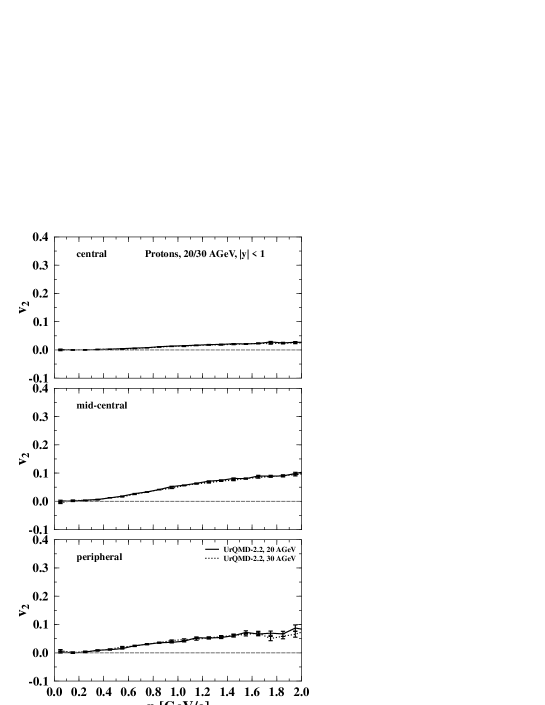
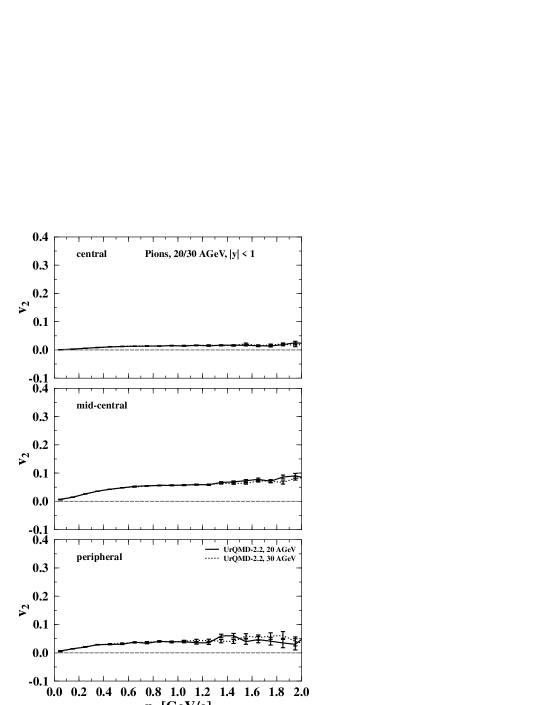
Fig. 20 and Fig. 21 are predictions for the rapidity dependence of proton and pion elliptic flow at GeV and GeV. The shown results are calculated using the UrQMD model with a transverse momentum cut of GeV/c. The elliptic flow results at this energy of the new accelerator FAIR at the GSI look rather similar to that at GeV.
VI.2 Transverse momentum dependence
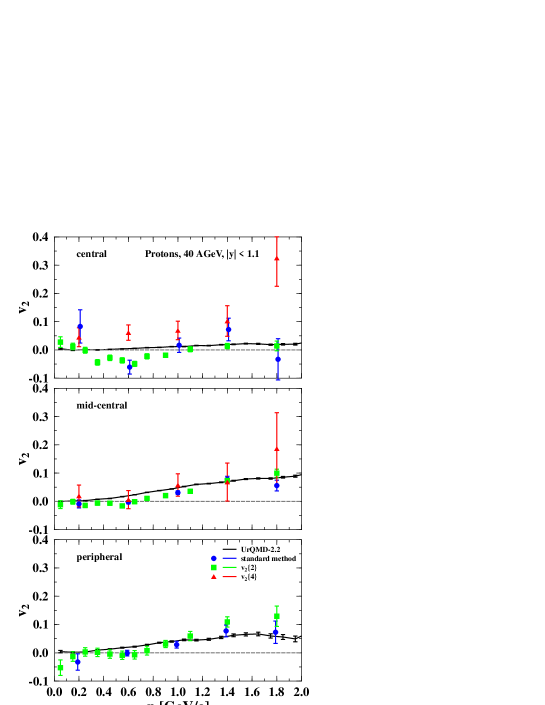
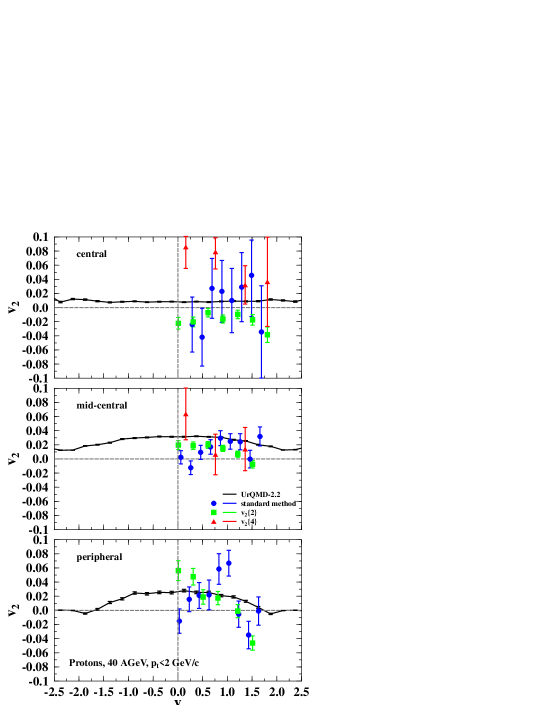
The elliptic flow of protons at GeV (Fig. 24) in central collisions looks similar to that at GeV. There is a smooth increase from zero at to about 2% at GeV/c. The underestimation of the flow by the transport model calculations at higher energies is visible in the results for mid-central and peripheral collisions at high . At low the calculations are in line with the data.
For the elliptic flow of protons as a function of transverse momentum there is a different rapidity cut used in the data than in the calculations. For proton and pion flow at GeV it is and for GeV it is for the cumulant order measurements. For the standard reaction plane method data, larger rapidity bins have been used for the integration. To improve the statistics of the UrQMD results we use symmetric rapidity cuts as for GeV and for GeV. Since the elliptic flow is symmetric in rapidity this can be done without problems. The elliptic flow of protons at GeV (Fig. 22) increases only to about for central and peripheral collisions in the calculated results. For mid-central collisions there is a steady increase with the increase of transverse momentum to about % which is in line with the data.
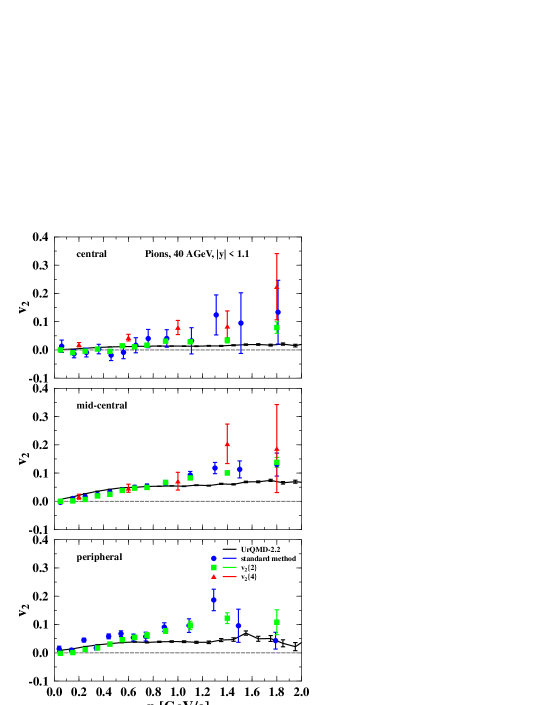
For the calculated pion elliptic flow at GeV (Fig. 23) a quite similar behaviour as for protons is seen. At high the experimental results have large statistical error bars. At low the experimental is not plagued by statistical and systematic errors and one observes good agreement between model and data. There is a increase of elliptic flow with increasing transverse momentum because the larger the momentum of the particle the earlier it escapes the collision zone Bass:1994af . These high energy particles carry the signal of the very early stage of the collision where the coordinate space asymmetry is most pronounced Lu:2006qn .
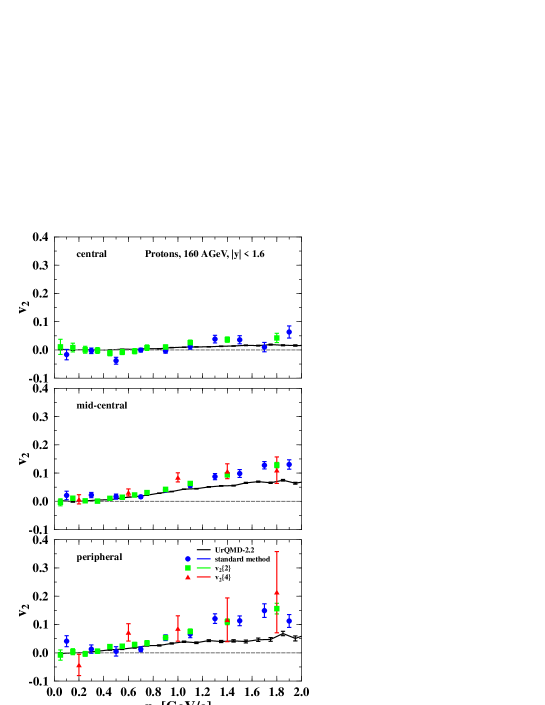
For pion elliptic flow at 160 AGeV the picture is very similar to the plot of the proton flow at this energy.
The predictions for the transverse momentum dependence of proton elliptic flow at GeV and GeV (Fig. 26) have mostly the same shape as the calculations at GeV.
The elliptic flow of pions at GeV and GeV shown in Fig. 27 are also similar to the calculations for the pion elliptic flow at GeV. But there is a difference for peripheral collisions. At the higher energy there is a lower value than for the lower energy.
VI.3 Excitation function
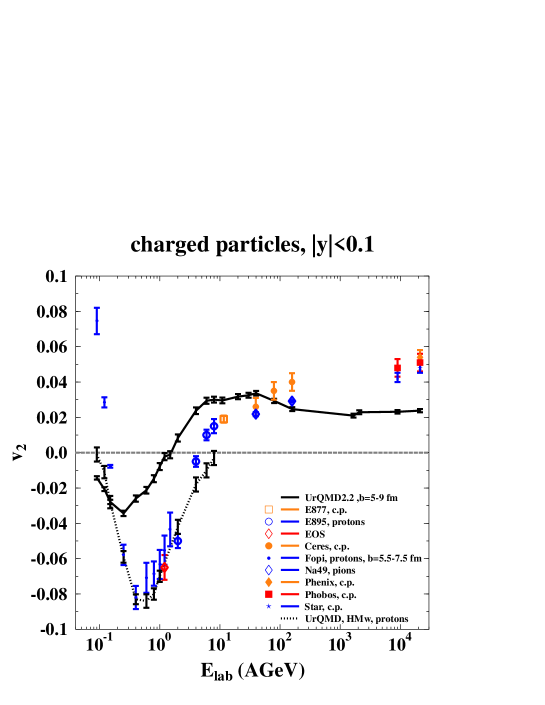
The excitation function of charged particle elliptic flow is compared to data over a wide energy range (Fig. 28), i.e from MeV to GeV. The squeeze-out effect at low energies and the change to in-plane emission at higher energies is nicely observed in the excitation function. The symbols indicate the data for charged particles from different experiments. Note however, that in the low energy regime there are only experimental data points for protons. For beam energies below 2 AGeV most of the charged particles are also protons because there is not enough energy to produce many new particles. Going to higher energies the elliptic flow of pions and charged particles are very similar. The rapidity cut of has been used for the whole energy range despite the fact that the data at higher energies is within . This has been done to avoid too much changes in the parameters and this choice gives reasonable results over the whole energy range. We have checked that the results at higher energies are not affected by the choice of this narrower rapidity window.
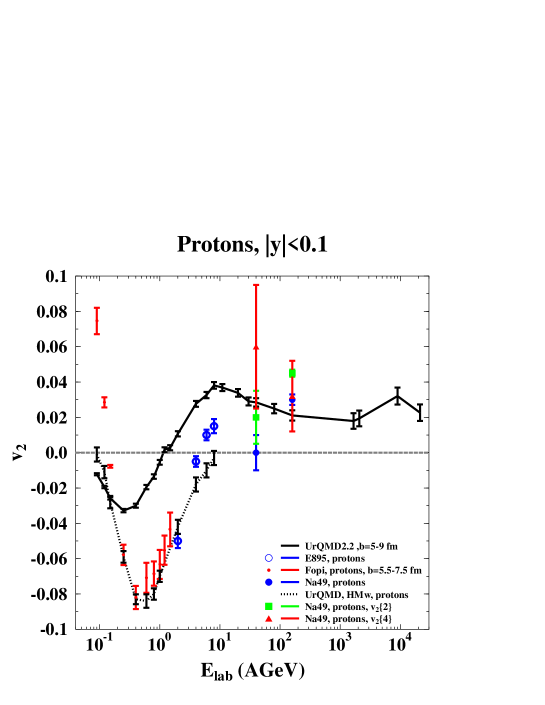
At low energies A GeV the squeeze-out effect, i.e. the elliptic flow out-of-plane, is clearly seen in the data as well as in the calculations, especially when the mean field is considered. At such energies, it is well known that both the mean field and the two-body collision are equally important to reproduce quantitatively the experimental results Danielewicz:1999vh ; Danielewicz:1998vz ; Pan:1992ef . In this paper we adopt a hard equation of state with momentum dependence (HM-EoS) which was updated recently in UrQMD model Li:2005gf . Meanwhile, the two-body scattering in heavy ion collisions might be modified by the nuclear medium. In order to consider (partly) the medium effect, the nucleon-nucleon elastic scattering cross sections are modified to depend on the nuclear density, the isospin-asymmetry and the two-nucleon relative momentum, besides the center-of-mass energy of two nucleons. This treatment was investigated based on the relativistic Dirac-Brueckner-Hartree-Fock (DBHF) theory as well as the relativistic mean field (RMF) theory, please see Ref. Li:2006ez for details. Here we show the calculation results with the HM-EoS and with the DBHF-like medium modification on nucleon-nulceon elastic cross sections (HMw) Li:2006ez .
In the SPS regime the model calculations are quite in line with the data, especially with the NA49 results. Above GeV the calculation underestimates the elliptic flow. At the highest RHIC energy there are about 5% flow in the data while the model calculation provides only half of this value. This can be explained by assuming a lack of pressure in the transport model at these energies.
In Fig. 29 the excitation function of elliptic flow of nucleons is presented. The rapidity cut of has been used because this is the appropriate one to compare with the data at lower energies. Due to this cut now also the calculation in the cascade mode (without nuclear potential) reaches negative values at low energies. With included potential the model is in line with experimental data. The UrQMD result in the SPS energy range lies in between the NA49 measurement of elliptic flow of protons. These values have been extracted from the differential plots of elliptic flow over rapidity for mid-central collisions discussed above in this paper.
The observed proton flow below GeV is smaller than zero, which corresponds to the squeeze-out predicted by hydrodynamics long ago Hofmann74 ; Hofmann:1976dy ; Stoecker:1980vf ; Stocker81 ; Stoecker:1981pg ; Stoecker:1986ci . At higher energies, GeV, an increase of the flow to a maximum around GeV followed by a decrease to about 2 % and a saturation is predicted from the string-hadronic transport model. In fact, the GeV data of the NA49 Collaboration suggest that a smooth increase proceeds between AGS and SPS.
The “collapse” of (strong negative value) for protons around midrapidity at GeV is only pronounced in the standard method data. The UrQMD calculations, without a phase transition, show a robust 3% flow of protons. One cannot say anything about a clear underestimation at high energies in this case because integrated proton flow data at RHIC is still not available.
VII Summary
We have compared UrQMD calculations to recent NA49 data. In general, a good agreement between data and calculation is found. There seem to be systematic uncertainties in the measurement method looking at the different results. For example for the directed flow data the effect of momentum conservation on the flow data can be seen. The slope around midrapidity of the rapidity distributions of proton directed flow becomes negative around GeV. This cannot be reproduced by the transport model calculations. The excitation function of elliptic flow shows strong negative flow at low energies - the “squeeze-out”-effect - which can quantitatively only be reproduced by including a nuclear potential in the calculation. At high energies we observed an underestimation of the elliptic flow of charged particles in the present model. This can possibly be explained by assuming a lack of pressure in the early stage of the collisions at high energies. It will be very interesting to see what happens in the lower energy regime (GeV) when high quality CBM-FAIR data becomes accessible.
Acknowledgements.
We are grateful to the Center for the Scientific Computing (CSC) at Frankfurt for the computing resources. The authors thank Alexander Wetzler for helpful and stimulating discussions. Q. Li thanks the Alexander von Humboldt-Stiftung for a fellowship. This work was supported by GSI and BMBF.References
- (1) See proceedings of the Quark Matter 2005, Budapest, Hungary, 2005
- (2) W. Scheid, J. Hofmann and W. Greiner, In *Berkeley 1974, Proceedings, Lawrence Berkeley Lab Lbl-3675*, Berkeley 1974, 1-50.
- (3) H. Stöcker, J. A. Maruhn and W. Greiner, Z. Phys. A 290 (1979) 297.
- (4) J. Hofmann, H. Stöcker, U. W. Heinz, W. Scheid and W. Greiner, Phys. Rev. Lett. 36 (1976) 88.
- (5) H. Stöcker and W. Greiner, Phys. Rept. 137 (1986) 277.
- (6) Z. Fodor and S. D. Katz, JHEP 0203 (2002) 014 [arXiv:hep-lat/0106002].
- (7) Z. Fodor, S. D. Katz and K. K. Szabo, Phys. Lett. B 568 (2003) 73 [arXiv:hep-lat/0208078].
- (8) L. P. Csernai and D. Rohrich, Phys. Lett. B 458 (1999) 454 [arXiv:nucl-th/9908034].
- (9) H. Stöcker, Nucl. Phys. A 750 (2005) 121 [arXiv:nucl-th/0406018].
- (10) H. Stöcker, E. L. Bratkovskaya, M. Bleicher, S. Soff and X. Zhu, J. Phys. G 31 (2005) S929 [arXiv:nucl-th/0412022].
- (11) C. Alt et al. [NA49 Collaboration], Phys. Rev. C 68 (2003) 034903 [arXiv:nucl-ex/0303001].
- (12) M. Bleicher et al., J. Phys. G 25 (1999) 1859 [arXiv:hep-ph/9909407].
- (13) S. A. Bass et al., Prog. Part. Nucl. Phys. 41 (1998) 225 [arXiv:nucl-th/9803035].
- (14) B. Andersson, G. Gustafson and B. Nilsson-Almqvist, Nucl. Phys. B 281 (1987) 289.
- (15) B. Nilsson-Almqvist and E. Stenlund, Comput. Phys. Commun. 43 (1987) 387.
- (16) T. Sjostrand, Comput. Phys. Commun. 82 (1994) 74.
- (17) M. Belkacem et al., Phys. Rev. C 58 (1998) 1727 [arXiv:nucl-th/9804058].
- (18) L. V. Bravina et al., Phys. Rev. C 60 (1999) 024904 [arXiv:hep-ph/9906548].
- (19) E. L. Bratkovskaya et al., Phys. Rev. C 69 (2004) 054907 [arXiv:nucl-th/0402026].
- (20) M. Bleicher, E. Bratkovskaya, S. Vogel and X. Zhu, “Transverse pressure and strangeness dynamics in relativistic heavy ion J. Phys. G 31 (2005) S709 [arXiv:hep-ph/0503252].
- (21) L. A. Winckelmann et al., “Microscopic calculations of stopping and flow from 160-A-MeV to Nucl. Phys. A 610 (1996) 116C [arXiv:nucl-th/9610033].
- (22) M. Bleicher et al., Phys. Lett. B 447 (1999) 227 [arXiv:hep-ph/9803346].
- (23) Y. Lu et al., J. Phys. G: Nucl. Part. Phys. 32, 1121 (2006) [arXiv:nucl-th/0602009].
- (24) X. l. Zhu, M. Bleicher and H. Stöcker, arXiv:nucl-th/0601049.
- (25) X. l. Zhu, M. Bleicher and H. Stöcker, Phys. Rev. C 72 (2005) 064911 [arXiv:nucl-th/0509081].
- (26) P. F. Kolb, J. Sollfrank and U. W. Heinz, Phys. Rev. C 62 (2000) 054909 [arXiv:hep-ph/0006129].
- (27) D. H. Rischke, Y. Pursun, J. A. Maruhn, H. Stöcker and W. Greiner, Heavy Ion Phys. 1 (1995) 309 [arXiv:nucl-th/9505014].
- (28) M. Bleicher and J. Aichelin, Phys. Lett. B 612 (2005) 201 [arXiv:nucl-th/0205069].
- (29) S. Soff, S. A. Bass, M. Bleicher, H. Stöcker and W. Greiner, arXiv:nucl-th/9903061.
- (30) H. Sorge, Phys. Rev. Lett. 82 (1999) 2048 [arXiv:nucl-th/9812057].
- (31) J. Y. Ollitrault, Phys. Rev. D 46 (1992) 229.
- (32) C. M. Hung and E. V. Shuryak, Phys. Rev. Lett. 75 (1995) 4003 [arXiv:hep-ph/9412360].
- (33) D. H. Rischke, Nucl. Phys. A 610 (1996) 88C [arXiv:nucl-th/9608024].
- (34) H. Sorge, Phys. Rev. Lett. 78 (1997) 2309 [arXiv:nucl-th/9610026].
- (35) H. Heiselberg and A. M. Levy, Phys. Rev. C 59 (1999) 2716 [arXiv:nucl-th/9812034].
- (36) J. Brachmann et al., Phys. Rev. C 61 (2000) 024909 [arXiv:nucl-th/9908010].
- (37) J. Brachmann, A. Dumitru, H. Stöcker and W. Greiner, Eur. Phys. J. A 8 (2000) 549 [arXiv:nucl-th/9912014].
- (38) B. Zhang, M. Gyulassy and C. M. Ko, Phys. Lett. B 455 (1999) 45 [arXiv:nucl-th/9902016].
- (39) M. Bleicher and H. Stöcker, Phys. Lett. B 526 (2002) 309 [arXiv:hep-ph/0006147].
- (40) A. M. Poskanzer and S. A. Voloshin, Phys. Rev. C 58 (1998) 1671 [arXiv:nucl-ex/9805001].
- (41) N. Borghini, P. M. Dinh and J. Y. Ollitrault, Phys. Rev. C 62 (2000) 034902 [arXiv:nucl-th/0004026].
- (42) Y. V. Kovchegov and K. L. Tuchin, Nucl. Phys. A 708 (2002) 413 [arXiv:hep-ph/0203213].
- (43) P. M. Dinh, N. Borghini and J. Y. Ollitrault, Phys. Lett. B 477 (2000) 51 [arXiv:nucl-th/9912013].
- (44) N. Borghini, P. M. Dinh and J. Y. Ollitrault, Phys. Rev. C 63 (2001) 054906 [arXiv:nucl-th/0007063].
- (45) N. Borghini, P. M. Dinh and J. Y. Ollitrault, Phys. Rev. C 64 (2001) 054901 [arXiv:nucl-th/0105040].
- (46) Brachmann J 2000 PhD Thesis JW Goethe Universität Frankfurt am Main
- (47) M. Miller and R. Snellings, nucl-ex/0312008.
- (48) N. Borghini, P. M. Dinh, J. Y. Ollitrault, A. M. Poskanzer and S. A. Voloshin, Phys. Rev. C 66, 014901 (2002) [arXiv:nucl-th/0202013].
- (49) N. Borghini, P. M. Dinh and J. Y. Ollitrault, Phys. Rev. C 66, 014905 (2002) [arXiv:nucl-th/0204017].
- (50) H. Liu et al. [E895 Collaboration], Phys. Rev. Lett. 84 (2000) 5488 [arXiv:nucl-ex/0005005].
- (51) Q. Li, Z. Li, S. Soff, M. Bleicher and H. Stöcker, J. Phys. G: Nucl. Part. Phys. 32, 151 (2006)
- (52) Q. Li, Z. Li, S. Soff, M. Bleicher and H. Stöcker, J. Phys. G: Nucl. Part. Phys. 32, 407 (2006)
- (53) S. A. Bass, C. Hartnack, H. Stöcker and W. Greiner, Phys. Rev. C 50 (1994) 2167
- (54) C. Pinkenburg et al. [E895 Collaboration], Prepared for Centennial Celebration and Meeting of the American Physical Society (Combining Annual APS General Meeting and the Joint Meeting of the APS and the AAPT), Atlanta, Georgia, 20-26 Mar 1999
- (55) P. Chung et al. [E895 Collaboration], Phys. Rev. C 66 (2002) 021901 [arXiv:nucl-ex/0112002].
- (56) A. Andronic et al. [FOPI Collaboration], Phys. Lett. B 612 (2005) 173 [arXiv:nucl-ex/0411024].
- (57) K. Filimonov et al. [CERES/NA45 Collaboration], arXiv:nucl-ex/0109017.
- (58) J. Slivova [CERES/NA45 Collaboration], Nucl. Phys. A 715 (2003) 615 [arXiv:nucl-ex/0212013].
- (59) S.I.Esumi, J. Slivova, J. Milosevic for CERES Collaboration SFIN, year XV, Series A: Conferences, No. A2(2002)
- (60) S. Esumi [PHENIX Collaboration], Nucl. Phys. A 715 (2003) 599 [arXiv:nucl-ex/0210012].
- (61) S. Manly et al. [PHOBOS Collaboration], Nucl. Phys. A 715 (2003) 611 [arXiv:nucl-ex/0210036].
- (62) R. L. Ray [STAR Collaboration], Nucl. Phys. A 715 (2003) 45 [arXiv:nucl-ex/0211030].
- (63) P. Danielewicz, Nucl. Phys. A 661 (1999) 82 [arXiv:nucl-th/9907098].
- (64) P. Danielewicz, R. A. Lacey, P. B. Gossiaux, C. Pinkenburg, P. Chung, J. M. Alexander and R. L. McGrath, Phys. Rev. Lett. 81 (1998) 2438 [arXiv:nucl-th/9803047].
- (65) Q. b. Pan and P. Danielewicz, Phys. Rev. Lett. 70 (1993) 2062 [Erratum-ibid. 70 (1993) 3523].
- (66) J. Hofmann,H. Stöcker,W. Scheid and W. Greiner Report of the Workshop on BeV/Nucleon Collisions of Heavy Ions- How and Why(Bear Mountain, New York, 29 Nov.-1 Dec.) (BNL-AUI 1975)(1974)
- (67) H. Stöcker, J. A. Maruhn and W. Greiner, Phys. Rev. Lett. 44 (1980) 725.
- (68) H. Stöcker, J. Hofmann,J. A. Maruhn and W. Greiner Prog. Part. Nucl. Phys. 4 (1980) 133
- (69) H. Stöcker et al., Phys. Rev. C 25 (1982) 1873.