Far Field Monitoring of Rogue Nuclear Activity with
an Array of Large anti-neutrino Detectors
Abstract
The result of a study on the use of an array of large anti-neutrino detectors for the purpose of monitoring rogue nuclear activity is presented. Targeted regional monitoring of a nation bordering large bodies of water with no pre-existing legal nuclear activity may be possible at a cost of about several billion dollars, assuming several as-yet-untested schemes pan out in the next two decades. These are: (1) the enabling of a water-based detector to detect reactor anti-neutrinos by doping with GdCl3; (2) the deployment of a KamLAND-like detector in a deep-sea environment; and (3) the scaling of a Super-Kamiokande-like detector to a size of one or more megatons. The first may well prove feasible, and should be tested by phase-III Super-Kamiokande in the next few years. The second is more of a challenge, but may well be tested by the Hanohano collaboration in the coming decade. The third is perhaps the least certain, with no schedule for construction of any such device in the foreseeable future. In addition to the regional monitoring scheme, several global, untargeted monitoring schemes were considered. All schemes were found to fail benchmark sensitivity levels by a wide margin, and to cost at least several trillion dollars.
I Introduction
The human race first tapped into nuclear energy with the success of the Manhattan project. Ever since, the practical know-how regarding the use of this source of energy has expanded and spread, and, so far as civilization as we know it continues to exist, this, no doubt, will continue to be the case. The spread of practical know-how in this area, however, presents a threat to peace, since there will always be desperate characters among the world’s political leaders, and it is a matter of time before one such leader gets access to this know-how and decides to use it indiscriminately against his enemies.
Monitoring regimes exist to guard against the uncontrolled spread of nuclear technology and the detonation of nuclear bombs. The International Atomic Energy Agency (IAEA) works under the auspices of the United Nations to make sure that nations that use nuclear energy do so only for peaceful purposes iae . Another monitoring regime is the Comprehensive Test Ban Treaty (CTBT), which is an agreement among nations to ban all nuclear explosions ctb . As recent world events (the detonation of a fission bomb by Pakistan in 1998, and the current political crisis involving nuclear activities in North Korea and Iran) have shown, however, neither regime has proved sufficient to curb the spread of nuclear technology nor the detonation of bombs. Clearly, the flaws in the regimes are mostly political. For instance, the detonation of nuclear bombs by Pakistan in 1998 was not against the CTBT because Pakistan is not a signatory. Also, the recent events in North Korea and Iran have little to do with monitoring techniques, but, rather, with flaws in the political process that allows headstrong political leaders to use nuclear threats as political bargaining chips.
Although much of the problems with today’s monitoring regime is political, some of the political problems are abetted by insufficiencies in the monitoring techniques. For instance, in 2002, after mounting tensions with the United States and her allies, North Korea expelled United Nations inspectors and threatened to restart its nuclear facilities in Yongbyon cnn . Once the inspectors were ousted, it was impossible to tell whether or not the North Koreans had actually carried through with their threat to reprocess nuclear fuel. This scenario is made possible by the fact that the IAEA monitoring technique requires the cooperation of participants. Clearly, a more robust monitoring regime requires far-field monitoring techniques that do not depend on participant cooperation.
Such techniques are already in use to monitor nuclear explosions by the CTBT (seismology, hydroacoustics, infrasound, and radionuclide monitoring) ctb , but they are useless for detecting nuclear reactor operation because a reactor burns nuclear fuel at a steady rate, and it does not release redionuclides into the environment. Far-field monitoring, however, is possible in principle using anti-neutrinos produced in nuclear fission. Indeed, the KamLAND experiment Eguchi et al. (2003) detects anti-neutrinos from nuclear reactors at an average distance of about 180 km. anti-neutrinos are electrically neutral particles produced in nuclear fission; they interact with matter only via the weak nuclear force. Because of this, anti-neutrinos can easily travel through hundreds of kilometer of matter with almost no probability of interaction with the intervening material. This feature of the anti-neutrino makes its detection very difficult; however, given a big enough target, a sufficiently long exposure time, and a sufficiently low background level, they can be reliably detected.
The purpose of the study presented herein is to determine the feasibility of using anti-neutrino detection for far-field monitoring of both nuclear reactor operation and fission bomb detonations. At the most basic level, the feasibility of this technique has been established by KamLAND. However, they were helped by the very large signal due to the unusually large concentration of nuclear reactors in Japan222As of 2002, Japan has 16 nuclear reactor plants producing a total power of 130 GW Bemporad et al. (2002).. In a realistic far-field monitoring scenario, the signal is expected to be tiny – probably much less than 100 MW (a typical commercial nuclear reactor power is about 2500 MW). We have found that a regionally targeted monitoring regime – e.g. the monitoring of nuclear reactor operations in North Korea – is may be possible at a projected cost of several billion dollars, as long as several as-yet-untested schemes pan out in the coming decade. We also considered the possibility of setting up a global array of large anti-neutrino detectors to detect surreptitious nuclear fission activity anywhere in the world. This was found to miss benchmark sensitivity levels by a wide margin, and to be unrealistic because of the prohibitive projected cost on the order of trillions of dollars.
II anti-neutrinos Produced in Nuclear Fission
Nuclear reactors and fission bombs make use of the energy released by splitting heavy nuclei (primarily uranium and plutonium). The former are designed to keep the rate of splitting constant so that energy is released at a steady rate, whereas the latter is designed to cause the energy to be released in a very short period. In both cases, the daughter nuclei from the splitting of uranium and plutonium are unstable and undergo radioactive decay; an anti-neutrino is produced from every beta decay.
The rate of anti-neutrino production in a nuclear reactor is directly proportional to its thermal power. Each nuclear fission releases about 200 MeV (million electron volts) of thermal energy333One electron volt is the amount of energy that an electron gains when it moves from the “” to “+” terminal of a 1-volt battery. The energy released by nuclear fission, therefore, is hundreds of million times as large as the energy released by a typical battery used in every-day life, which is equal to Joules. A typical nuclear reactor has a thermal power of one gigawatt, or Joules per second. The number of fissions per second required to produce this power, therefore, is J/s divided by J, which is equal to . Finally, since about 6 anti-neutrinos are produced per fission, we find that anti-neutrinos per second are produced for every one gigawatt of thermal power.
The corresponding calculation for a fission bomb proceeds similarly. The strength of a fission bomb is usually quoted in terms of its “yield”, which is the mass of TNT that produces the same amount of energy. A small fission bomb has an yield of about 1000 ton of TNT, and one metric ton of TNT releases Joules, so this bomb releases Joules of energy. As in the case of a nuclear reactor, each fission releases 200 MeV of energy, and 6 anti-neutrinos are produced per fission. Thus anti-neutrinos are released for every kilo-ton of fission bomb yield. Unlike a reactor, which releases anti-neutrinos at a steady rate, a fission bomb releases the anti-neutrino impulsively over a period of several seconds; almost no anti-neutrinos are emitted after about 10 seconds from the blast Bernstein et al. .
III Detecting anti-neutrinos
The stuff that composes the material world is responsive to the electromagnetic force. It is this force that keeps a ball from going through one’s hand when caught. anti-neutrinos, unlike ordinary stuff, are unresponsive to the electromagnetic force. Consequently, an anti-neutrino can travel through an extraordinary thickness of matter with almost zero chance of hitting stuff on its way through; the illustration of a neutrino traveling through a light-year thick block of lead is famous. They, however, do interact with matter via the weak nuclear force. This force has a strength comparable to that of the electromagnetic force, but the carriers of this force are very massive, unlike photons, the massless particles that transmit the electromagnetic force. As a result, the weak force has a very short range; an anti-neutrino interacts with matter only if it happens to pass by very close to a target particle. The chance of this happening is extraordinarily low, and this accounts for an anti-neutrino’s ability to travel through large amount of matter.
The weak interaction between an anti-neutrino and matter can take place in various ways. For instance, an anti-neutrino can hit an electron that orbits an atomic nucleus, transmitting some of its momentum to it. Since an electron carries an electric charge, its motion through matter is very noticeable; a sensitive particle detector can detect the effects produced by this motion. For instance, an electron carrying several million electron-volts of energy travels faster than the speed of light in matter; this super-luminal motion creates a shock wave of electromagnetic radiation, which is referred to as the Cherenkov effect. Detectors like Super-Kamiokande Fukuda et al. (2003) detect anti-neutrinos (and neutrinos) using this effect.
Another way that an anti-neutrino can be detected is via the inverse beta process, in which an anti-neutrino encounters a proton and comes out transformed into a positron, while the proton is transformed into a neutron. This is written symbolically as follows:
| (1) |
The symbols , , , and stand, respectively, for anti-neutrino (electron-type), proton, neutron, and positron. In the study we performed, we considered detectors that use this process for detecting antineurtrinos. The advantages of this technique are the relatively high probability of the occurrence or the inverse beta process, and the “double-bang” signature produced by the anti-neutrino. That is, the out-going particles and both produce signals in the detector. First, the produces a burst of light, the amount of which is proportional to its energy (which is also closely related to the anti-neutrino’s energy). This happens promptly after the transformation in Eqn. 1 takes place. The neutron, however, rattles around for tens to hundreds of microseconds (millionth of a second, which is a relatively long time in the present context) until it is eventually absorbed by a proton or a dopant like gadolinium in the target. This absorption is followed by the emission of gamma ray(s) of several million electron volts; a burst of light proportional to this energy is produced. In summary, then, an anti-neutrino interacting in this manner produces two bursts of light separated by a meter or so in distance, and tens to hundreds of microseconds in time. This double-bang signature is useful for picking out anti-neutrino events from the large background produced, for example, by radioactive contaminants in the detector. The background events produce random flashes of light, but they are not very likely to produce the double-bang signature Bemporad et al. (2002).
The detection of anti-neutrinos using inverse beta decay is typically done using a liquid scintillator detector; KamLAND is an example of such a detector Eguchi et al. (2003). Liquid scintillator is used primarily because the amount of light produced by an anti-neutrino interaction event is very large compared to Cherenkov radiation produced in water; greater light yield translates to higher sensitivity (i.e. particles with lower energy are visible) and better energy resolution. In the present context, however, the required detector size is of the order of one megaton, which, for liquids, is about a cube of sides 100 m. At this scale, the use of liquid scintillator becomes impractical because of the cost; water is the only economically realistic target material. By itself, however, water cannot be used to detect the inverse beta decay process because the second “bang” in the double-bang signature is below the energy threshold. In order to make the second bang visible, the detector must be doped with an element such as gadolinium, which aggressively absorbs the produced neutron and emits gamma rays above the detector energy threshold. Because of the very large absorption cross section for thermal neutrons, only a 0.2% concentration is needed to capture 90% of the neutrons. For a 1 megaton detector, this corresponds to 200 tons of the salt GdCl3 Beacom and Vagins (2004).
The rate of detection of anti-neutrinos from a nuclear reactor in a water detector is given by the equation below444This rate assumes 100% efficiency above the threshold anti-neutrino energy of 1.8 MeV. The anti-neutrino energy spectrum depends somewhat on the relative fraction of isotopes in a fission reactor; we took average values used in Eguchi et al. (2003), which were 0.567, 0.078, 0.297, and 0.057 for 235U, 238U, 239Pu, and 241Pu, respectively. The rate also depends on the production cross section for the inverse beta process; the energy dependence was taken to be the same as that used in Eguchi et al. (2003). Finally, it was assumed that all isotopes produce 204 MeV of thermal energy per fission; in fact, different isotopes produce somewhat different energies, but the value used here is a good-enough approximation for the present purpose.:
This equation shows that a 100 MW nuclear reactor (about the upper limit of the power expected from a rogue nuclear reactor) at 100 km from a 1-Megaton detector exposed for 1 year produces about 3000 observable events. The number of anti-neutrino events from a fission bomb is given by:
Unlike Eqn. III, which gives the rate of anti-neutrino detection (events per year), Eqn. III gives the total anti-neutrino yield over 10 seconds during which most of the anti-neutrinos are released by a fission bomb. Based on this equation, one finds only 2.25 events for a 1 kiloton bomb detonated at 100 km from a 1-Megaton detector. This may seem small, but since the events arrive in a 10-second window, the signal-to-background ratio is actually quite good. For instance, a 2500 MW reactor (typical power of a commercial reactor) 100 km away produces about 2.5 events in this time window, giving a signal-to-background ratio close to 1; at most locations, the ratio is much better than this.
Both Eqn. III and Eqn. III are somewhat optimistic because they were calculated assuming that the detector is sensitive to all values of anti-neutrino energy (the inverse beta process requires at least 1.8 MeV in anti-neutrino energy). In reality, the anti-neutrino energy probably needs to be at least 3.8 MeV to be visible by the detector. Only 58% of events have energy above this. Other data selection cuts may decrease the event rate somewhat, probably to a total efficiency of about 50%. For the sake of simplicity, we shall take the efficiency to be 100%. Any result we obtain here, therefore, will be over-optimistic by a factor of about . In other words, the actual sensitivity will be worse by about a factor of .
IV Shielding from Cosmic Rays
Because anti-neutrinos interact very rarely with matter, extreme care must be taken to ensure that the signal is not overwhelmed by background noise. One way to deal with this is to increase the signal so much that it is comparable to the background. This is what is done in short-baseline reactor detectors Bemporad et al. (2002) and near-field reactor monitoring detectors Bernstein et al. . For some applications, however, the distance between the anti-neutrino source and the detector must be large. Since the anti-neutrino flux is inversely proportional to the square of this distance, the signal rate is tiny in these situations. To make up for this, the detector must be large and it must have a very small level of background noise.
There are two main classes of background noise: radioactivity present in and around the detector, and radioactivity produced by cosmic ray muons. The level of the former can be reduced to very low levels, thanks to decades of experience from numerous neutrino detection experiments. The latter, however, can only be reduced by brute force: i.e. by having sufficient shielding material, such as rock or water. As a rough rule of thumb for typical anti-neutrino measurements, two kilometers of water is barely enough shielding, three kilometers is satisfactory, and four or more kilometers provides good shielding. Shielding by rock is very costly unless it is already present, such as inside of a pre-existing mine. Indeed, most large anti-neutrino detectors in existence today are located in commercial mines. For the purpose of nuclear monitoring, however, it is unlikely in general that commercial mines would exist in locations where the detectors need to be placed. Thus, for economic reasons, the only locations where far-field monitoring detectors could be placed are in large bodies of water (i.e. oceans, seas, and large lakes).
V anti-neutrino Background Sources
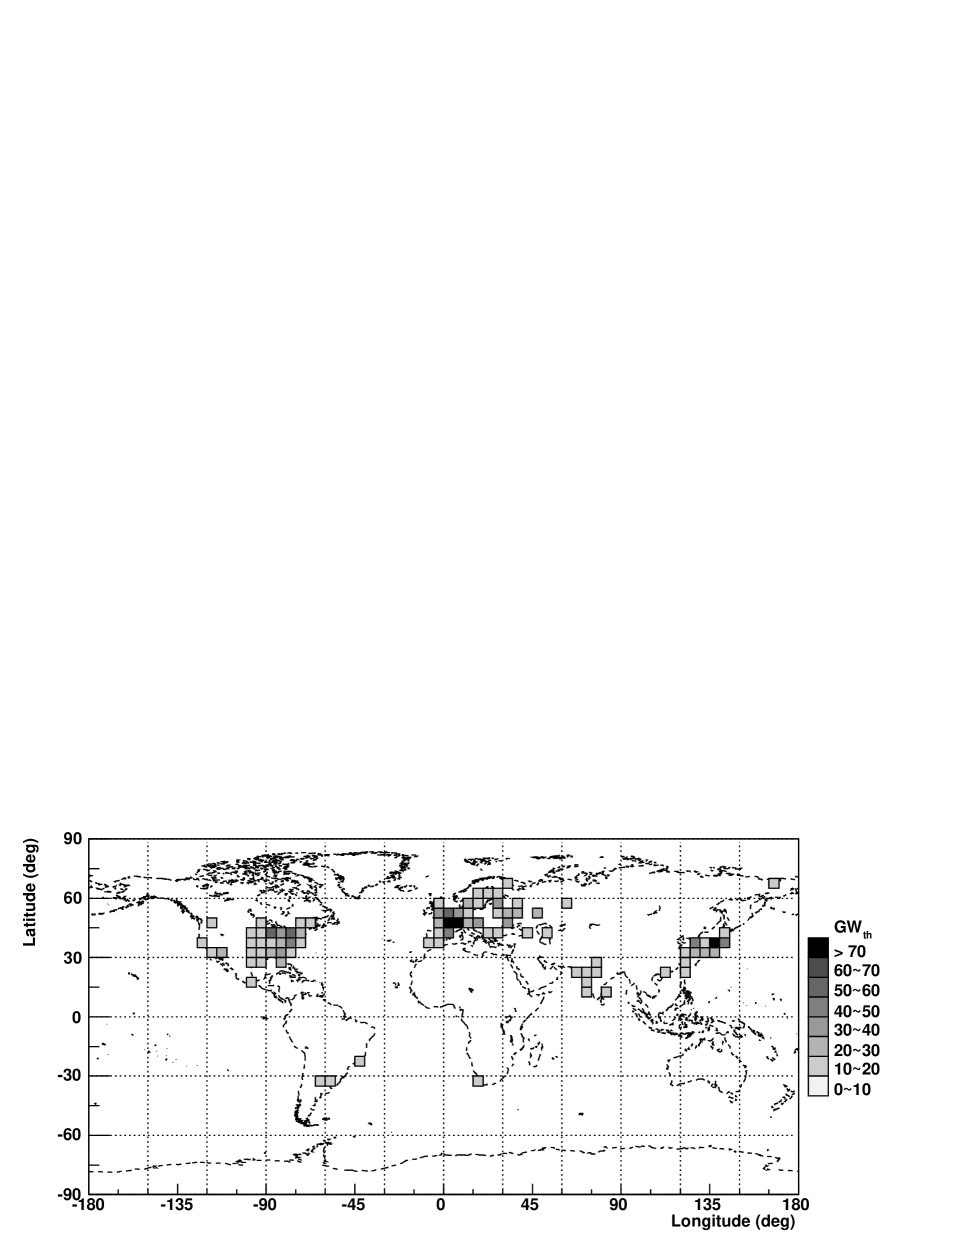
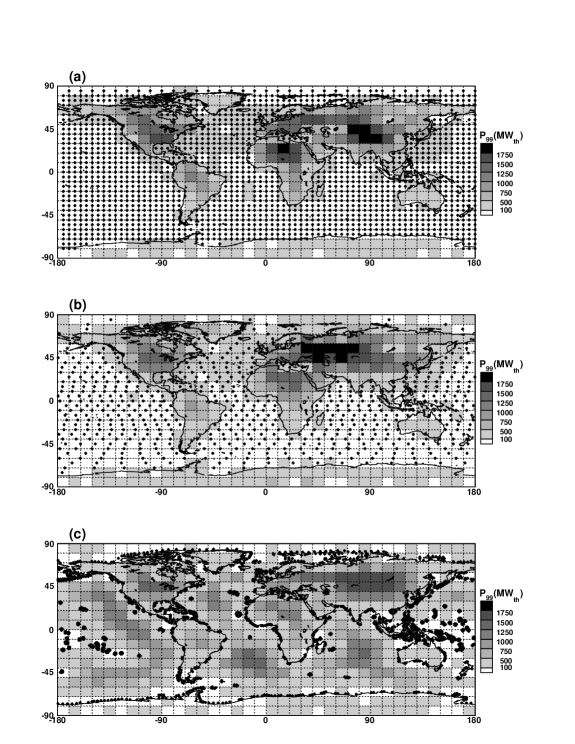
One of the most formidable background sources for nuclear monitoring with antinuetrino detectors is the flux of anti-neutrinos from commercial and research nuclear reactors around the world. Distributed mostly around the northern hemisphere, a total thermal power of about 1 TW is produced by these reactors. The distribution of these reactors is shown in Fig. 1. See Appendix A for details on the location and power of these reactors. The number of anti-neutrinos produced by these nuclear reactors detected per year by a one-megaton detector located at various locations on Earth is shown in Fig. 2(a). anti-neutrinos produced by these reactors are virtually indistinguishable from those produced by a rogue reactor; if a rogue reactor operates in a region where the anti-neutrino flux from commercial and research reactors is high, it would be very difficult to detect.
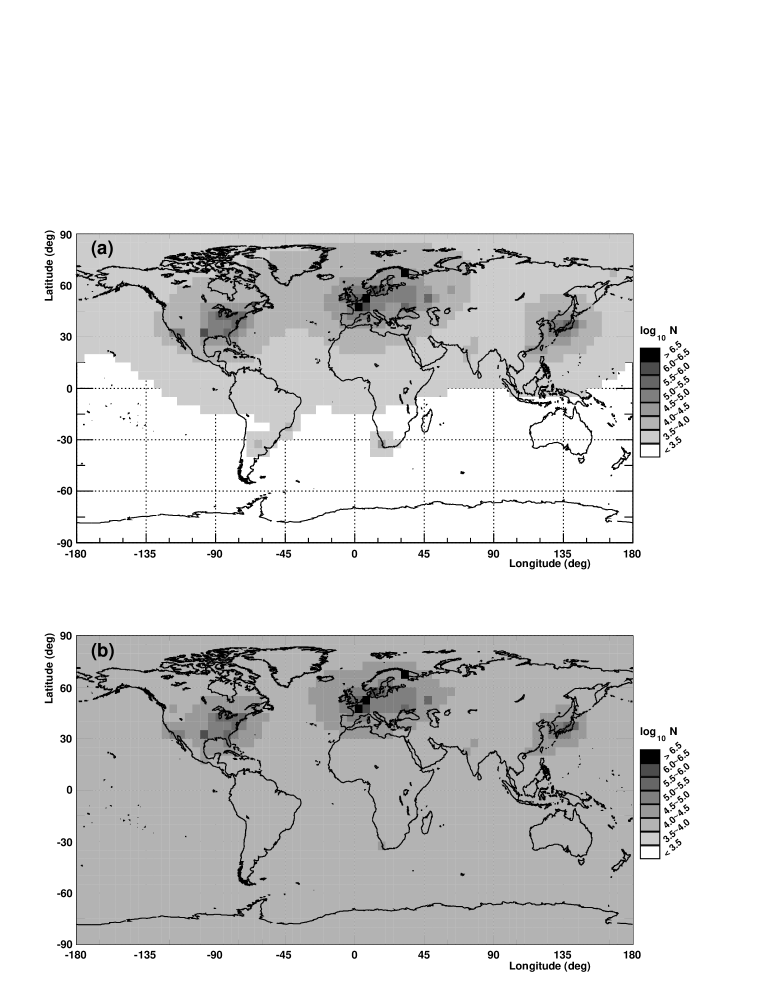
Another possible source of background is the “georeactor”, which is a hypothetical natural nuclear reactor in the core of the Earth Herndon (1979, 1980, 1996); Hollenbach and Herndon (2001); Herndon (2003). If it exists, this reactor is expected to have a radius of several kilometers and have a thermal power of about 1 to 10 TW. Since commercial and research nuclear reactors world wide produce a total power of about 1 TW, the existence of a georeactor would have a large impact on the background rate for detecting a rogue reactor. This is illustrated in Fig. 2(b), which is the same as Fig. 2(a), but with a contribution from a 3 TW georeactor. The effect of a georeactor is not particularly serious in much of the northern hemisphere because the anti-neutrino flux is already high, but it causes a serious increase in background in much of the southern hemisphere. For this reason, a measurement of this background is an important prerequisite for the anti-neutrino detector array being considered here. A preliminary measurement has already been carried out by KamLAND Maricic (2005), but the result is imprecise because of the large background from commercial nuclear reactors. However, a detector whose size is comparable to KamLAND and located far away from commercial reactors can easily make a precise measurement of georeactor power down to about 1 TW. Hanohano geo (Hawaii anti-neutrino Observatory) is an example of a detector capable of making this measurement. Like the detectors in this array, Hanohano will be placed deep in the ocean. Thus, it is a prototype of the megaton detectors, and the successful implementation and operation of it would be an important prerequisite for the rogue activity detector array concept.
VI Neutrino Oscillations
A potentially important detail that must be kept in mind when considering neutrino detection is neutrino flavor oscillation. The current view of the nature of neutrinos is that three “flavors” of neutrinos exist; the flavors are referred to as the “electron-type”, “muon-type”, and “tau-type”. An electron-type neutrino turns into an electron when it interacts with the target via the charged-current electroweak interaction, while a muon-type neutrino is transformed into a muon and similarly with a tau-type neutrino. The situation with “anti-neutrinos” – which is the focus of this study – is similar, except that the out-going particle has the opposite electric charge.
The importance of the above discussion is the fact that the final state particles – the electron, muon, and the tau (and their anti-particles) – have very different masses. The electron, muon, and the tau have, respectively, a mass of 0.511, 105, and 1777 MeV. A neutrino can only undergo the charged-current interaction with the target particle if it carries at least as much energy as the out-going particle mass.
Recent results of solar and reactor neutrino experiments have unequivocally established the fact that neutrinos “oscillate”. For practical purposes, this means that the neutrino flavor when it is produced is not the same as when it is detected. In the present context, electron anti-neutrinos are produced in a nuclear reactor; as these anti-neutrinos propagate outward, they become a quantum mechanical superposition of different neutrino flavors. Since these anti-neutrinos have energy well below 10 MeV, that part of the superposition that has turned into a muon- or tau-type neutrino cannot interact with the target because the available energy is insufficient to produce a muon or tau. The result is that the anti-neutrino detection rate is smaller than is expected in the absence of neutrino oscillations. The neutrino survival probability – defined as the fraction of detection rate compared to the rate without oscillations – is a function of distance from the reactor. For a threshold energy of 1.8 MeV, this starts out at 100% for distances of 0 to several 10s of kilometers. The probability then oscillates around an asymptotic value of 0.57 as the distance ranges from about 100 km to 300 km. Beyond this, the amplitude of the oscillation approaches zero, and the probability is practically indistinguishable from 0.57.
In this study, we consider two cases: regional monitoring (section VII) and global monitoring (section VIII). In the former, the variation of the survival probability with distance affects the result of performance studies, so this has been taken into account in all figures and results. In the latter, the effect of oscillation was implemented by simply scaling the no-oscillation rate by 0.57. This simplification is valid because we are only interested in how the detector array performs as a group spanning many thousands of kilometers. In other words, in the global scheme, we are not interested in how well several near-by detectors perform (which is covered in the regional scheme), but in how well many hundreds of widely separated detectors perform. We have established that, for the global scheme, the asymptotic approximation of the survival probability is accurate to within a fraction of a percent.
VII Regional Monitoring
As an example of the capability of a megaton-scale array of anti-neutrino detectors for the purpose of detecting rogue nuclear activity, we consider a scenario in which rogue activity is taking place in North Korea. To make the illustration concrete, it was assumed that the rogue reactor is located deep inside of North Korean territory at longitude E and latitude N (Fig. 3(a)). North Korea presents a realistic test case not only because of recent events, but also because of the fact that it does not operate any nuclear reactors legally. If this were not the case, the monitoring regime presented here would be easily defeated because the rogue reactor could be placed close to a legally operated reactor, which would obscure this activity. Thus this monitoring regime would not be realistic for monitoring rogue activities in South Korea or Japan, or any nation with legally operating nuclear reactors.
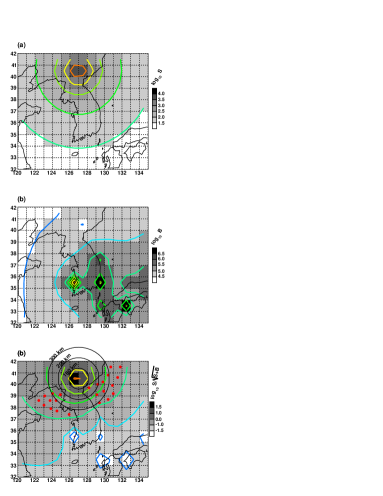
The choice of location of anti-neutrino detectors should be based on the sensitivity to rogue reactor detection. Fig. 3 (a) shows the number of events deteced by a 1-megaton detector exposed for one year, assuming the rogue reactor power is 100 MW.
Fig. 3 (b) shows the number of background events, mostly from commercial nuclear reactors in South Korea and Japan. The sensitivity of a detector depends on the signal and the background according to the formula . Twenty-three candidate locations were chosen based on the sensitivity contour (Fig. 3 (c)). We assumed, of course, that the detector must be located in the ocean for cosmic ray shielding. We did not consider the feasibility of the candidate locations from the point of view of political boundaries, depth, or ease of sabotage.
The general outline of the monitoring regime proceeds as follows. First, detectors are placed in several locations around North Korea. In our simulations, we examined array configurations with two to four detectors, the location of which was chosen from the 23 shown in Fig. 3 (c). Of course, we do not know the rogue reactor locaion a priori, but North Korea is not such a big territory, so the exact choice of locations should not matter so long as the detectors are reasonably close to land. Second, the detectors take data for about one year. During this exposure period, it receives background events from commercial reactors, but the expected level can be calculated accurately using data provided by the reactor operators. Finally, one compares the observed number of events in each detector to the expected number of background events. If a significant excess is observed in any of the detectors, an alarm is raised and one would then use the data from all the detectors to try to triangulate the location of the rogue activity. At the same time, political action would commence against the rogue regime. The statistical technique used in the comparison of the data against the background expectation is described in detail in Appendix B.
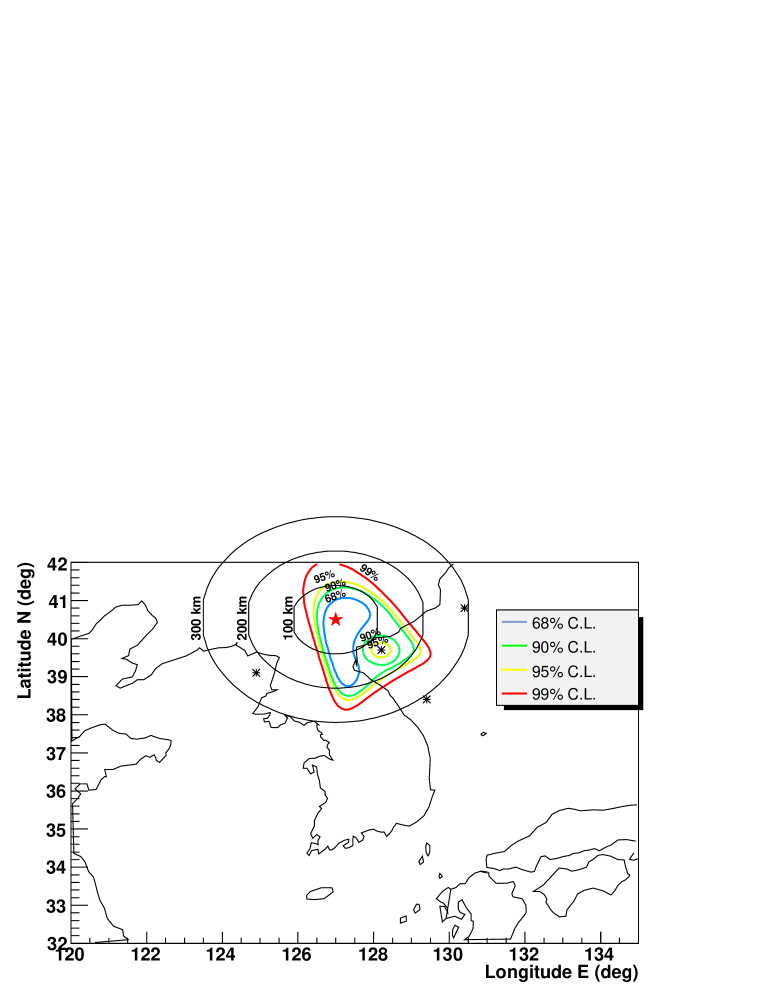
The quantity (defined in detail in Appendix B) stands for the threshold rogue reactor thermal power that triggers an alarm at the “99%” confidence level. Fig. 4 shows an array configuration with four detectors for which MW. To quantify the ability of the array to pin-point the reactor, a map of was made (Fig. 4). This map was made by comparing the observed number of events (sum of signal and background) in each detector with the number of expected events for a hypothetical rogue reactor at different locations and power levels. At each location, the power was varied until the between the observed and expected set of events was minimized. As one would expect, the smallest minimized occurs at the true reactor location; is defined as the difference between this smallest minimized and that at any given location in the map (by definition, at the true location). The contours shown in the map indicate the range of likely reconstructed positions at the specified confidence level. In other words, an -% contour indicates that there is an -% chance that the reconstructed position would lie within the contour.
There are several notable features in Fig. 4. First is the fact that each detector strongly rules out a circular region of radius of several 10s km. Second is the fact that the alarm level is determined almost completely by the closest detector. The addition of the other detectors do not lower the alarm level (i.e. they do not improve the sensitivity); their role is to help pin-point the location of the rogue reactor. To see this, note that if only the closest detector were present, the minimum would be an annular region around it; the other detectors strongly rule out circular regions surrounding their locations, thus narrowing down the possible locations.
We finally note that nuclear reactors need to be cooled; reactors located inland are cooled with a river or a lake. Thus the intersection of rivers and lakes with the confidence region discussed above would allow one to focus in on possible reactor sites.
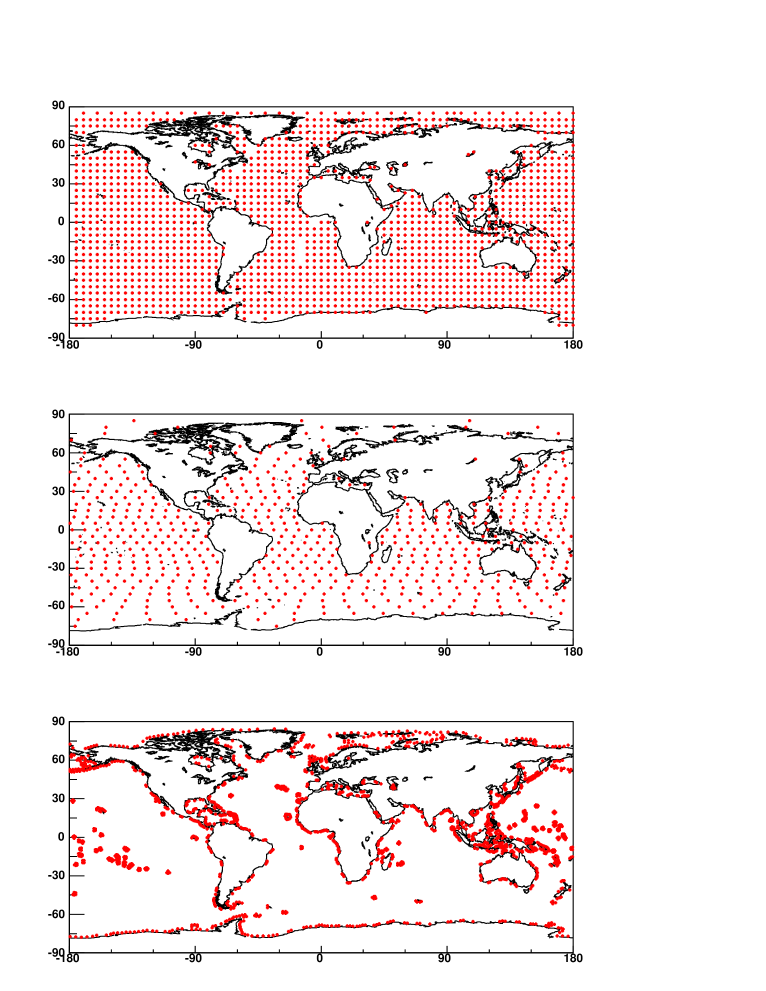
VIII Global Monitoring
More ambitious in objective than regional monitoring is a global monitoring regime, the goal of which is to monitor all locations on Earth. Unlike the regional monitoring case, one cannot optimize resources to focus in on a suspect region, so the size requirements are very demanding. First, detector modules need to be an order of magnitude larger than in the regional monitoring case – i.e. each module is 10 megatons, which corresponds to a cube of sides 216 m. This is about the limiting size of a detector module from the point of view of light detection efficiency because even in extremely pure water, light has a maximum attenuation length of about 100 m Fukuda et al. (2003). Thus light produced in the center of the detector is attenuated by about a factor of 0.40; such events would be detected with low efficiency with any detector that is significantly larger. Also, the number of modules in an array needs to be on the order of 1000. As before, we took the exposure time to be one year. We considered three different array configurations in our study, shown in Fig. 5. To measure the performance of the arrays, a map of was made (see Appendix B). In other words, a rogue reactor was assumed to exist in various locations on Earth. For each location, the rogue reactor power was varied until the reactor was detectable at the “99%” confidence level. The maps show that in most costal regions (i.e. within several hundred kilometers of the shore), the array is sensitive to rogue reactor power of several hundred MW. The sensitivity worsens to about 1000 MW for regions with a high level of legal nuclear activity. The sensitivity worsens yet to almost 2000 MW deep within continents. Since rogue reactors, realistically, should have a power of less than about 100 MW, it is seen that the world-wide monitoring regime considered here does not measure up well to the task at hand.
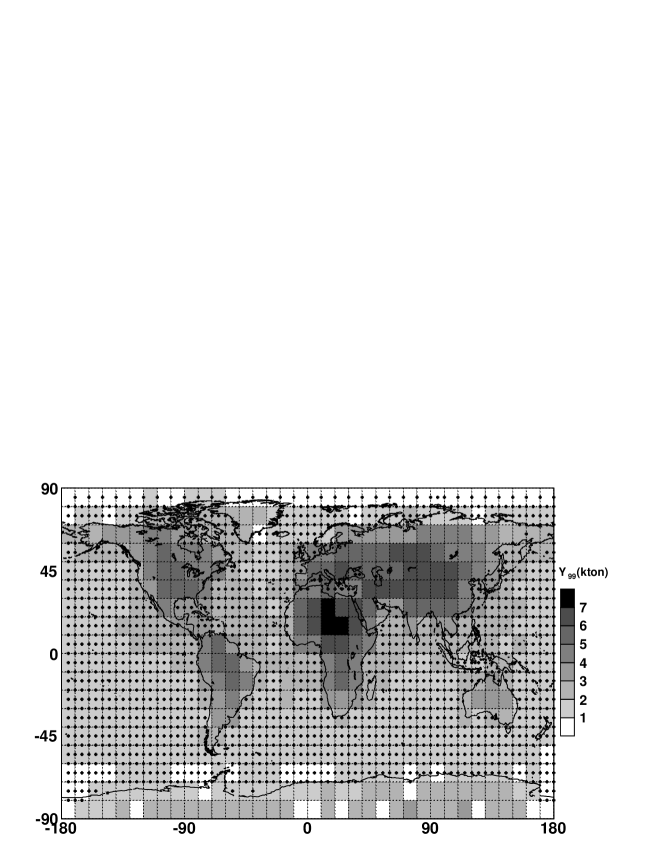
IX Monitoring of Fission Bomb Detonation
The energy production mechanism of a fission bomb is basically the same as that of a nuclear reactor. The main difference is that the latter operate in a steady-state mode, while the former releases its energy in a short burst. Most of the anti-neutrinos from a fission bomb are released in 10 seconds from the moment of detonation. The anti-neutrino yield from a 1 kton bomb observed by a 1 megaton detector at 100 km from ground-zero is 2.25 events (Eqn. III). This may seem like a small number, but one must consider the fact that the amount of background is reduced greatly by the fact that the observation time is ten seconds. A study of the sensitivity of a global array was carried out as in the case for rogue reactors (section VIII). In this case, a map of “” was made instead of , where is the yield of a fission bomb that can be detected at the 99% confidence level, as defined in Appendix B. The result is shown in Fig. 7. Unfortunately, at most places on Earth, the sensitivity is several kilotons, compared to the goal of one kiloton. However, since the goal is not too far off, one may achieve the goal by targeting to certain regions (though not going down quite to the regional scale like for North Korea), or by loosening the alarm threshold.
X Cost
Here, only a very rough estimate of the cost of the arrays will be attempted. The main costs involve: (1) photomultiplier tubes (PMTs), (2) detector material, civil engineering, transport, etc., (3) water purification, (4) gadolinium dopant, and (5) man-power. The PMT cost is fairly well-understood. If we assume the same coverage as the Super-Kamiokande detector (about 40% of the detector wall area), assuming that the same PMTs as Super-Kamiokande will be used, and assuming that the cost per PMT will be about $1000 (assuming that bulk-discount or economy of scale reduces the price per PMT), about 120,000 PMT will be required per detector module. This translates to 120 million dollars per detector. The material, civil engineering, transport, etc. cost is not well-known at this point, but probably several hundred million dollars per module is the right order of magnitude. The cost of water purification is also not known right now, but probably about 100 million dollars is the right order of magnitude. Several thousand tons of GdCl3 per module is required; at $3 per kilogram, this translates to several million dollars, which is negligible compared to the total cost. Man-power and everything else is quite vague, but something on the order of $100 million is probably the right order of magnitude. In total, then, each detector module will probably cost about $1 billion. This implies that a regional monitoring scheme would cost several billion dollars. In contrast, a world monitoring regime will cost several trillion dollars.
XI Conclusion
Our study shows that targeted regional monitoring of rogue nuclear reactor activity in a nation without pre-existing legally operated nuclear reactor may be done at a cost of several billion dollars, provided that the nation has significant coast lines facing large bodies of water. We note, however, that the cost accounting is very rough, and that several key features of the scheme have yet to be proved feasible. For instance, the idea Beacom and Vagins (2004) of doping a water-based detector with gadolinium to make it sensitive to reactor anti-neutrinos is promising, but yet unproven. The verdict should be out in the next several years as Super-Kamiokande starts its third experimental phase this year (2006). Another unproven scheme is the deploying of a KamLAND-like detector in a deep-sea environment. Hanohano appears to be the single experiment that will test this idea in the coming decade. Finally, the idea of deploying a megaton-scale detector is unproven. Ideas to construct detectors on this scale exist (e.g. Hyper-K and UNO), but there are no schedules for building any. Moreover, these detectors are to be deployed on land, which probably simplifies matters considerably compared to deploying it deep in the ocean. The more ambitious idea of an untargeted world-wide array was studied, but it mostly did not reach the target sensitivity of about 100 MW for reactors nor the 1 kiloton yield for fission bombs. This was at a prohibitive cost of more than trillion dollars. Thus it is concluded that an untargeted world-wide monitoring scheme is unrealistic. A viable monitoring scheme must focus in on some region in order to optimize resources.
Acknowledgements.
I would like to thank Prof. John Learned for his leadership in initiating at the University of Hawaii a program exploring the use of anti-neutrinos for monitoring nuclear activities. I feel honored to have been invited to join the research effort, and am indebted to him for his kind support throughout the time I was there. I would like to thank Prof. Stephen Dye for his dedication to Hanohano and related research activities. I would also like to thank Jelena Maricic for working with me on various aspects of research in anti-neutrino detection. I thank all members of the University of Hawaii Hanohano team who worked hard to keep up the momentum for an exceptionally worthy goal. Thanks also to the members of the Neutrino Physics Group and all others in the Physics Department for maintaining a high-quality research environment, and to the Department Staff whose daily support was invaluable.Appendix A A List of Nuclear Reactor Location and Power
This appendix gives a list of the location (longitude and latitude) and the nominal thermal power of registered nuclear reactors throughout the world. The list was obtained in 2003 from the International Nuclear Safety Center 555The International Nuclear Safety Center, operated by the Argonne National Laboratory, maintains a list of registered nuclear reactors worldwide. Prof. John Learned of the University of Hawaii, Manoa obtained a text version of the list through private channels.. The list may not be up to date, and the positions are only approximate. Our results, however, do not depend sensitively on the exact world wide distribution of nuclear reactors, nor on the relatively small change in the total nuclear power world wide since 2003, so this should be sufficient for the purpose of this study. A total of 433 reactors are in the list, and the total thermal power is 1.06 TW. This list will be provided in ASCII format upon request to ehguillian@gmail.com.
| Reactor | Thermal | Latitude | Longitude (E) | Reactor | Thermal | Latitude | Longitude (E) |
|---|---|---|---|---|---|---|---|
| Number | Power (MW) | Number | Power (MW) | ||||
| 1 | 1375 | 40.166 | 44.133 | 61 | 2894 | 39.200 | -0.633 |
| 2 | 1100 | -34.000 | -59.250 | 62 | 3027 | 40.702 | -2.379 |
| 3 | 2103 | -32.233 | -64.449 | 63 | 510 | 40.350 | -2.883 |
| 4 | 1192 | 51.316 | 4.266 | 64 | 1 | 42.766 | -3.200 |
| 5 | 1192 | 51.316 | 4.266 | 65 | 2686 | 39.807 | -5.696 |
| 6 | 2775 | 51.316 | 4.266 | 66 | 2696 | 39.807 | -5.696 |
| 7 | 2988 | 51.316 | 4.266 | 67 | 2686 | 41.200 | 0.566 |
| 8 | 2660 | 50.533 | 5.266 | 68 | 2686 | 41.200 | 0.566 |
| 9 | 2775 | 50.533 | 5.266 | 69 | 2785 | 40.966 | 0.883 |
| 10 | 2988 | 50.533 | 5.266 | 70 | 2000 | 61.233 | 21.450 |
| 11 | 1375 | 43.750 | 23.633 | 71 | 2000 | 61.233 | 21.450 |
| 12 | 1375 | 43.750 | 23.633 | 72 | 1375 | 60.366 | 26.366 |
| 13 | 1375 | 43.750 | 23.633 | 73 | 1375 | 60.366 | 26.366 |
| 14 | 1375 | 43.750 | 23.633 | 74 | 2785 | 45.260 | -0.688 |
| 15 | 1882 | -23.000 | -44.450 | 75 | 2785 | 45.260 | -0.688 |
| 16 | 2156 | 45.066 | -66.450 | 76 | 2785 | 45.260 | -0.688 |
| 17 | 2180 | 46.400 | -72.316 | 77 | 2785 | 45.260 | -0.688 |
| 18 | 2774 | 43.883 | -78.750 | 78 | 3817 | 49.535 | -1.881 |
| 19 | 2774 | 43.883 | -78.750 | 79 | 3817 | 49.535 | -1.881 |
| 20 | 2774 | 43.883 | -78.750 | 80 | 2785 | 47.229 | 0.167 |
| 21 | 2774 | 43.883 | -78.750 | 81 | 2785 | 47.229 | 0.167 |
| 22 | 1754 | 43.816 | -79.066 | 82 | 2905 | 47.229 | 0.167 |
| 23 | 1754 | 43.816 | -79.066 | 83 | 2905 | 47.229 | 0.167 |
| 24 | 1754 | 43.816 | -79.066 | 84 | 3817 | 49.858 | 0.633 |
| 25 | 1754 | 43.816 | -79.066 | 85 | 3817 | 49.858 | 0.633 |
| 26 | 2832 | 44.333 | -81.600 | 86 | 3817 | 49.858 | 0.633 |
| 27 | 2832 | 44.333 | -81.600 | 87 | 3817 | 49.858 | 0.633 |
| 28 | 2832 | 44.333 | -81.600 | 88 | 4250 | 46.457 | 0.659 |
| 29 | 2832 | 44.333 | -81.600 | 89 | 3817 | 44.106 | 0.849 |
| 30 | 947 | 46.966 | 7.266 | 90 | 3817 | 44.106 | 0.849 |
| 31 | 2806 | 47.366 | 7.966 | 91 | 3817 | 49.975 | 1.211 |
| 32 | 3012 | 47.583 | 8.149 | 92 | 3817 | 49.975 | 1.211 |
| 33 | 1130 | 47.550 | 8.216 | 93 | 2785 | 47.720 | 1.579 |
| 34 | 1130 | 47.550 | 8.216 | 94 | 2785 | 47.720 | 1.579 |
| 35 | 2905 | 22.600 | 114.533 | 95 | 2785 | 51.016 | 2.144 |
| 36 | 2905 | 22.600 | 114.533 | 96 | 2785 | 51.016 | 2.144 |
| 37 | 966 | 30.450 | 120.933 | 97 | 2785 | 51.016 | 2.144 |
| 38 | 1375 | 49.083 | 16.133 | 98 | 2785 | 51.016 | 2.144 |
| 39 | 1375 | 49.083 | 16.133 | 99 | 2785 | 51.016 | 2.144 |
| 40 | 1375 | 49.083 | 16.133 | 100 | 2785 | 51.016 | 2.144 |
| 41 | 1375 | 49.083 | 16.133 | 101 | 2785 | 47.733 | 2.516 |
| 42 | 3765 | 49.983 | 10.183 | 102 | 2785 | 47.733 | 2.516 |
| 43 | 3840 | 48.516 | 10.400 | 103 | 2785 | 47.733 | 2.516 |
| 44 | 3840 | 48.516 | 10.400 | 104 | 2785 | 47.733 | 2.516 |
| 45 | 3690 | 53.400 | 10.433 | 105 | 3817 | 47.507 | 2.877 |
| 46 | 2575 | 48.600 | 12.300 | 106 | 3817 | 47.507 | 2.877 |
| 47 | 3765 | 48.600 | 12.300 | 107 | 3817 | 48.517 | 3.520 |
| 48 | 3850 | 52.466 | 7.316 | 108 | 3817 | 48.517 | 3.520 |
| 49 | 3517 | 49.716 | 8.416 | 109 | 563 | 44.816 | 4.700 |
| 50 | 3733 | 49.716 | 8.416 | 110 | 2785 | 44.329 | 4.732 |
| 51 | 2575 | 49.250 | 8.450 | 111 | 2785 | 44.329 | 4.732 |
| 52 | 3850 | 49.250 | 8.450 | 112 | 2785 | 44.329 | 4.732 |
| 53 | 3733 | 53.433 | 8.466 | 113 | 2785 | 44.329 | 4.732 |
| 54 | 1050 | 49.366 | 9.083 | 114 | 2785 | 44.631 | 4.755 |
| 55 | 2292 | 53.916 | 9.116 | 115 | 2785 | 44.631 | 4.755 |
| 56 | 2497 | 49.033 | 9.166 | 116 | 2785 | 44.631 | 4.755 |
| 57 | 3850 | 49.033 | 9.166 | 117 | 2785 | 44.631 | 4.755 |
| 58 | 3765 | 53.850 | 9.350 | 118 | 3817 | 45.405 | 4.755 |
| 59 | 3765 | 52.033 | 9.416 | 119 | 3817 | 45.405 | 4.755 |
| 60 | 1892 | 53.616 | 9.533 | 120 | 4270 | 50.090 | 4.789 |
| Reactor | Thermal | Latitude | Longitude (E) | Reactor | Thermal | Latitude | Longitude (E) |
|---|---|---|---|---|---|---|---|
| Number | Power (MW) | Number | Power (MW) | ||||
| 121 | 4270 | 50.090 | 4.789 | 181 | 3293 | 37.416 | 138.600 |
| 122 | 2785 | 45.795 | 5.270 | 182 | 3293 | 37.416 | 138.600 |
| 123 | 2785 | 45.795 | 5.270 | 183 | 3293 | 37.416 | 138.600 |
| 124 | 2785 | 45.795 | 5.270 | 184 | 3926 | 37.416 | 138.600 |
| 125 | 2785 | 45.795 | 5.270 | 185 | 3926 | 37.416 | 138.600 |
| 126 | 3817 | 49.413 | 6.216 | 186 | 1650 | 43.033 | 140.516 |
| 127 | 3817 | 49.413 | 6.216 | 187 | 1650 | 43.033 | 140.516 |
| 128 | 3817 | 49.413 | 6.216 | 188 | 3293 | 36.461 | 140.610 |
| 129 | 3817 | 49.413 | 6.216 | 189 | 1380 | 37.416 | 141.000 |
| 130 | 2660 | 47.906 | 7.565 | 190 | 2381 | 37.416 | 141.000 |
| 131 | 2660 | 47.906 | 7.565 | 191 | 2381 | 37.416 | 141.000 |
| 132 | 1375 | 46.572 | 18.854 | 192 | 2381 | 37.416 | 141.000 |
| 133 | 1375 | 46.572 | 18.854 | 193 | 2381 | 37.416 | 141.000 |
| 134 | 1375 | 46.572 | 18.854 | 194 | 3293 | 37.416 | 141.000 |
| 135 | 1375 | 46.572 | 18.854 | 195 | 3293 | 37.316 | 141.033 |
| 136 | 660 | 19.833 | 72.700 | 196 | 3293 | 37.316 | 141.033 |
| 137 | 660 | 19.833 | 72.700 | 197 | 3293 | 37.316 | 141.033 |
| 138 | 802 | 21.266 | 73.400 | 198 | 3293 | 37.316 | 141.033 |
| 139 | 801 | 21.266 | 73.400 | 199 | 1593 | 38.400 | 141.500 |
| 140 | 801 | 14.866 | 74.450 | 200 | 2436 | 38.400 | 141.500 |
| 141 | 801 | 14.866 | 74.450 | 201 | 2775 | 35.500 | 126.416 |
| 142 | 693 | 24.883 | 75.633 | 202 | 2775 | 35.500 | 126.416 |
| 143 | 694 | 24.883 | 75.633 | 203 | 2825 | 35.500 | 126.416 |
| 144 | 801 | 28.183 | 78.366 | 204 | 2825 | 35.500 | 126.416 |
| 145 | 801 | 28.183 | 78.366 | 205 | 1928 | 35.333 | 129.333 |
| 146 | 801 | 12.583 | 80.183 | 206 | 1876 | 35.333 | 129.333 |
| 147 | 801 | 12.583 | 80.183 | 207 | 2775 | 35.333 | 129.333 |
| 148 | 1650 | 33.516 | 129.833 | 208 | 2775 | 35.333 | 129.333 |
| 149 | 1650 | 33.516 | 129.833 | 209 | 2775 | 37.100 | 129.383 |
| 150 | 3423 | 33.516 | 129.833 | 210 | 2775 | 37.100 | 129.383 |
| 151 | 3423 | 33.516 | 129.833 | 211 | 2825 | 37.100 | 129.383 |
| 152 | 2660 | 31.833 | 130.200 | 212 | 2825 | 37.100 | 129.383 |
| 153 | 2660 | 31.833 | 130.200 | 213 | 2156 | 35.750 | 129.500 |
| 154 | 1650 | 33.483 | 132.316 | 214 | 2169 | 35.750 | 129.500 |
| 155 | 1650 | 33.483 | 132.316 | 215 | 1000 | 44.600 | 50.300 |
| 156 | 2660 | 33.483 | 132.316 | 216 | 4800 | 55.600 | 26.483 |
| 157 | 1380 | 35.533 | 133.000 | 217 | 4800 | 55.600 | 26.483 |
| 158 | 2436 | 35.533 | 133.000 | 218 | 1931 | 19.725 | -96.387 |
| 159 | 2440 | 35.516 | 135.500 | 219 | 1931 | 19.725 | -96.387 |
| 160 | 2440 | 35.516 | 135.500 | 220 | 1366 | 51.433 | 3.716 |
| 161 | 2660 | 35.516 | 135.500 | 221 | 433 | 24.866 | 66.789 |
| 162 | 2660 | 35.516 | 135.500 | 222 | 2180 | 44.316 | 28.016 |
| 163 | 3423 | 35.533 | 135.650 | 223 | 62 | 68.033 | 166.250 |
| 164 | 3423 | 35.533 | 135.650 | 224 | 62 | 68.033 | 166.250 |
| 165 | 3423 | 35.533 | 135.650 | 225 | 62 | 68.033 | 166.250 |
| 166 | 3423 | 35.533 | 135.650 | 226 | 62 | 68.033 | 166.250 |
| 167 | 1031 | 35.683 | 135.966 | 227 | 3200 | 59.500 | 29.050 |
| 168 | 1456 | 35.683 | 135.966 | 228 | 3200 | 59.500 | 29.050 |
| 169 | 2440 | 35.683 | 135.966 | 229 | 3200 | 59.500 | 29.050 |
| 170 | 714 | 35.766 | 136.000 | 230 | 3200 | 59.500 | 29.050 |
| 171 | 557 | 35.750 | 136.016 | 231 | 1375 | 67.466 | 32.466 |
| 172 | 1064 | 35.747 | 136.022 | 232 | 1375 | 67.466 | 32.466 |
| 173 | 3411 | 35.747 | 136.022 | 233 | 1375 | 67.466 | 32.466 |
| 174 | 1593 | 37.050 | 136.733 | 234 | 1375 | 67.466 | 32.466 |
| 175 | 1593 | 34.616 | 138.150 | 235 | 3200 | 54.166 | 33.233 |
| 176 | 2436 | 34.616 | 138.150 | 236 | 3200 | 54.166 | 33.233 |
| 177 | 3293 | 34.616 | 138.150 | 237 | 3200 | 54.166 | 33.233 |
| 178 | 3293 | 34.616 | 138.150 | 238 | 3000 | 57.916 | 35.083 |
| 179 | 3293 | 37.416 | 138.600 | 239 | 3000 | 57.916 | 35.083 |
| 180 | 3293 | 37.416 | 138.600 | 240 | 3200 | 51.683 | 35.616 |
| Reactor | Thermal | Latitude | Longitude (E) | Reactor | Thermal | Latitude | Longitude (E) |
|---|---|---|---|---|---|---|---|
| Number | Power (MW) | Number | Power (MW) | ||||
| 241 | 3200 | 51.683 | 35.616 | 301 | 1555 | 54.033 | -2.916 |
| 242 | 3200 | 51.683 | 35.616 | 302 | 947 | 51.200 | -3.133 |
| 243 | 3200 | 51.683 | 35.616 | 303 | 947 | 51.200 | -3.133 |
| 244 | 1375 | 51.283 | 39.216 | 304 | 1500 | 51.200 | -3.133 |
| 245 | 1375 | 51.283 | 39.216 | 305 | 1500 | 51.200 | -3.133 |
| 246 | 3000 | 51.283 | 39.216 | 306 | 260 | 55.016 | -3.216 |
| 247 | 3000 | 51.916 | 47.366 | 307 | 260 | 55.016 | -3.216 |
| 248 | 3000 | 51.916 | 47.366 | 308 | 260 | 55.016 | -3.216 |
| 249 | 3000 | 51.916 | 47.366 | 309 | 260 | 55.016 | -3.216 |
| 250 | 3000 | 51.916 | 47.366 | 310 | 270 | 54.416 | -3.483 |
| 251 | 60 | 54.233 | 49.616 | 311 | 270 | 54.416 | -3.483 |
| 252 | 150 | 54.233 | 49.616 | 312 | 270 | 54.416 | -3.483 |
| 253 | 1470 | 56.850 | 61.316 | 313 | 270 | 54.416 | -3.483 |
| 254 | 2270 | 57.250 | 12.116 | 314 | 1496 | 54.416 | -3.483 |
| 255 | 2440 | 57.250 | 12.116 | 315 | 1496 | 54.416 | -3.483 |
| 256 | 2775 | 57.250 | 12.116 | 316 | 1760 | 53.416 | -4.483 |
| 257 | 2775 | 57.250 | 12.116 | 317 | 1730 | 53.416 | -4.483 |
| 258 | 1800 | 55.700 | 12.916 | 318 | 780 | 50.550 | 0.580 |
| 259 | 1375 | 57.416 | 16.666 | 319 | 780 | 50.550 | 0.580 |
| 260 | 1800 | 57.416 | 16.666 | 320 | 1550 | 50.550 | 0.580 |
| 261 | 3300 | 57.416 | 16.666 | 321 | 1550 | 50.550 | 0.580 |
| 262 | 2928 | 60.400 | 18.166 | 322 | 500 | 51.750 | 0.883 |
| 263 | 2928 | 60.400 | 18.166 | 323 | 500 | 51.750 | 0.883 |
| 264 | 3200 | 60.400 | 18.166 | 324 | 800 | 52.200 | 1.616 |
| 265 | 1876 | 45.916 | 15.533 | 325 | 800 | 52.200 | 1.616 |
| 266 | 1375 | 48.500 | 17.683 | 326 | 3411 | 52.200 | 1.616 |
| 267 | 1375 | 48.500 | 17.683 | 327 | 3817 | 33.390 | -112.862 |
| 268 | 1375 | 48.500 | 17.683 | 328 | 3817 | 33.390 | -112.862 |
| 269 | 1375 | 48.500 | 17.683 | 329 | 3817 | 33.390 | -112.862 |
| 270 | 1375 | 48.250 | 18.450 | 330 | 3390 | 33.370 | -117.557 |
| 271 | 1375 | 48.250 | 18.450 | 331 | 3390 | 33.370 | -117.557 |
| 272 | 2785 | 21.966 | 120.733 | 332 | 3323 | 46.471 | -119.333 |
| 273 | 2785 | 21.966 | 120.733 | 333 | 3338 | 35.212 | -120.854 |
| 274 | 1775 | 25.300 | 121.583 | 334 | 3411 | 35.212 | -120.854 |
| 275 | 1775 | 25.300 | 121.583 | 335 | 1998 | 41.944 | -70.579 |
| 276 | 2894 | 25.200 | 121.666 | 336 | 3411 | 42.898 | -70.851 |
| 277 | 2894 | 25.200 | 121.666 | 337 | 2700 | 41.309 | -72.168 |
| 278 | 1375 | 51.333 | 25.883 | 338 | 3579 | 41.309 | -72.168 |
| 279 | 1375 | 51.333 | 25.883 | 339 | 1593 | 42.780 | -72.516 |
| 280 | 3000 | 51.333 | 25.883 | 340 | 3071 | 41.271 | -73.953 |
| 281 | 3000 | 50.600 | 26.550 | 341 | 3025 | 41.271 | -73.953 |
| 282 | 3200 | 51.383 | 30.100 | 342 | 1930 | 39.814 | -74.206 |
| 283 | 3000 | 47.816 | 31.216 | 343 | 3411 | 39.463 | -75.536 |
| 284 | 3000 | 47.816 | 31.216 | 344 | 3411 | 39.463 | -75.536 |
| 285 | 3000 | 47.816 | 31.216 | 345 | 3293 | 39.468 | -75.538 |
| 286 | 3200 | 47.483 | 34.633 | 346 | 3293 | 40.220 | -75.590 |
| 287 | 3200 | 47.483 | 34.633 | 347 | 3293 | 40.220 | -75.590 |
| 288 | 3200 | 47.483 | 34.633 | 348 | 3293 | 41.092 | -76.149 |
| 289 | 3200 | 47.483 | 34.633 | 349 | 3293 | 41.092 | -76.149 |
| 290 | 3200 | 47.483 | 34.633 | 350 | 3293 | 39.759 | -76.269 |
| 291 | 3200 | 47.483 | 34.633 | 351 | 3293 | 39.759 | -76.269 |
| 292 | 1500 | 54.650 | -1.183 | 352 | 2436 | 43.524 | -76.398 |
| 293 | 1500 | 54.650 | -1.183 | 353 | 1850 | 43.522 | -76.410 |
| 294 | 1555 | 55.966 | -2.516 | 354 | 3323 | 43.522 | -76.410 |
| 295 | 1555 | 55.966 | -2.516 | 355 | 2700 | 38.435 | -76.442 |
| 296 | 893 | 51.650 | -2.566 | 356 | 2700 | 38.435 | -76.442 |
| 297 | 893 | 51.650 | -2.566 | 357 | 2441 | 37.166 | -76.698 |
| 298 | 1500 | 54.033 | -2.916 | 358 | 2441 | 37.166 | -76.698 |
| 299 | 1500 | 54.033 | -2.916 | 359 | 2568 | 40.153 | -76.725 |
| 300 | 1556 | 54.033 | -2.916 | 360 | 1520 | 43.292 | -77.309 |
| Reactor | Thermal | Latitude | Longitude (E) | Reactor | Thermal | Latitude | Longitude (E) |
|---|---|---|---|---|---|---|---|
| Number | Power (MW) | Number | Power (MW) | ||||
| 361 | 2893 | 38.061 | -77.791 | 421 | 2568 | 35.227 | -93.231 |
| 362 | 2893 | 38.061 | -77.791 | 422 | 2815 | 35.227 | -93.231 |
| 363 | 2416 | 33.958 | -78.011 | 423 | 1670 | 45.333 | -93.848 |
| 364 | 2436 | 33.958 | -78.011 | 424 | 2381 | 40.362 | -95.641 |
| 365 | 2775 | 35.633 | -78.956 | 425 | 3411 | 38.239 | -95.689 |
| 366 | 2300 | 34.405 | -80.159 | 426 | 3817 | 28.795 | -96.048 |
| 367 | 2700 | 27.349 | -80.246 | 427 | 3817 | 28.795 | -96.048 |
| 368 | 2700 | 27.349 | -80.246 | 428 | 1500 | 41.521 | -96.077 |
| 369 | 2200 | 25.435 | -80.331 | 429 | 3411 | 32.298 | -97.785 |
| 370 | 2200 | 25.435 | -80.331 | 430 | 3411 | 32.298 | -97.785 |
| 371 | 2652 | 40.622 | -80.434 | 431 | 2775 | -33.650 | 18.416 |
| 372 | 2652 | 40.622 | -80.434 | 432 | 2775 | -33.650 | 18.416 |
| 373 | 3411 | 35.432 | -80.948 | 433 | 0 | 40.166 | 44.133 |
| 374 | 3411 | 35.432 | -80.948 | ||||
| 375 | 3411 | 35.051 | -81.069 | ||||
| 376 | 3411 | 35.051 | -81.069 | ||||
| 377 | 3579 | 41.801 | -81.143 | ||||
| 378 | 2775 | 34.296 | -81.320 | ||||
| 379 | 3565 | 33.142 | -81.765 | ||||
| 380 | 3565 | 33.142 | -81.765 | ||||
| 381 | 2436 | 31.934 | -82.344 | ||||
| 382 | 2436 | 31.934 | -82.344 | ||||
| 383 | 2544 | 28.957 | -82.699 | ||||
| 384 | 2568 | 34.792 | -82.899 | ||||
| 385 | 2568 | 34.792 | -82.899 | ||||
| 386 | 2568 | 34.792 | -82.899 | ||||
| 387 | 2772 | 41.597 | -83.086 | ||||
| 388 | 3292 | 41.963 | -83.259 | ||||
| 389 | 3411 | 35.603 | -84.790 | ||||
| 390 | 3411 | 35.223 | -85.088 | ||||
| 391 | 3411 | 35.223 | -85.088 | ||||
| 392 | 2652 | 31.223 | -85.112 | ||||
| 393 | 2652 | 31.223 | -85.112 | ||||
| 394 | 2530 | 42.322 | -86.315 | ||||
| 395 | 3250 | 41.976 | -86.566 | ||||
| 396 | 3411 | 41.976 | -86.566 | ||||
| 397 | 3293 | 34.704 | -87.119 | ||||
| 398 | 3293 | 34.704 | -87.119 | ||||
| 399 | 3292 | 34.704 | -87.119 | ||||
| 400 | 1518 | 44.281 | -87.536 | ||||
| 401 | 1518 | 44.281 | -87.536 | ||||
| 402 | 1650 | 44.343 | -87.536 | ||||
| 403 | 3411 | 41.244 | -88.229 | ||||
| 404 | 3411 | 41.244 | -88.229 | ||||
| 405 | 2527 | 41.390 | -88.271 | ||||
| 406 | 2527 | 41.390 | -88.271 | ||||
| 407 | 3323 | 41.244 | -88.671 | ||||
| 408 | 3323 | 41.244 | -88.671 | ||||
| 409 | 2894 | 40.172 | -88.834 | ||||
| 410 | 3411 | 42.075 | -89.282 | ||||
| 411 | 3411 | 42.075 | -89.282 | ||||
| 412 | 2511 | 41.726 | -90.310 | ||||
| 413 | 2511 | 41.726 | -90.310 | ||||
| 414 | 3410 | 29.995 | -90.471 | ||||
| 415 | 3833 | 32.008 | -91.048 | ||||
| 416 | 2894 | 30.757 | -91.332 | ||||
| 417 | 1658 | 42.101 | -91.777 | ||||
| 418 | 3565 | 38.758 | -91.782 | ||||
| 419 | 1650 | 44.619 | -92.633 | ||||
| 420 | 1650 | 44.619 | -92.633 |
Appendix B The Statistical Technique Used to Compare the Observed Number of Events against the Expected Number
Let us say that there are detectors in the array. In the absence of any rogue reactor, detector number detects events per year; these are from commercial and research reactors, and (possibly) from the georeactor in Earth’s core. We denote the set of observed number of events , , by the usual “set” notation .
The actually observed number of events in each detector is represented as . In the absence of rogue activity, the numbers in should agree with those in . If, however, rogue activity is taking place, the predicted numbers is incorrect, and it should be replaced with , where represents the number of events in detector number due to the rogue activity.
The method used to detect rogue activity starts with the assumption that no rogue activity is taking place, so that the predicted number of events at each detector is given by . The set of observed number of events is compared against the observed number using a likelihood function; as the name suggests, this function provides information about how likely a set of numbers is to have resulted from the predicted set , given statistical and systematic uncertainties. For this report, we considered only statistical uncertainty, in which case the logarithm of the likelihood function (the log-likelihood function) is defined as follows:
| (4) |
The last term is the logarithm of the Gamma function.
The value of for a given measurement (lasting one year) is not known a priori because of statistical fluctuations, although the mean expected value is (Fig. 8 (a)). The mean expected value, in fact, depends on the power of the rogue reactor; we denote this dependence as . As the power increases, the assumption that no rogue reactor exists becomes increasingly inconsistent with observations; this inconsistency causes to be biased to lower values. When is small, the slightly biased distribution of largely overlaps the distribution of , which implies that the detector array is not sensitive enough to detect such a low value of (Fig. 8 (b)). However, as the power is raised, a point is reached where the two distributions are different enough that the rogue reactor can be judged to exist with great confidence (Fig. 8 (c)).
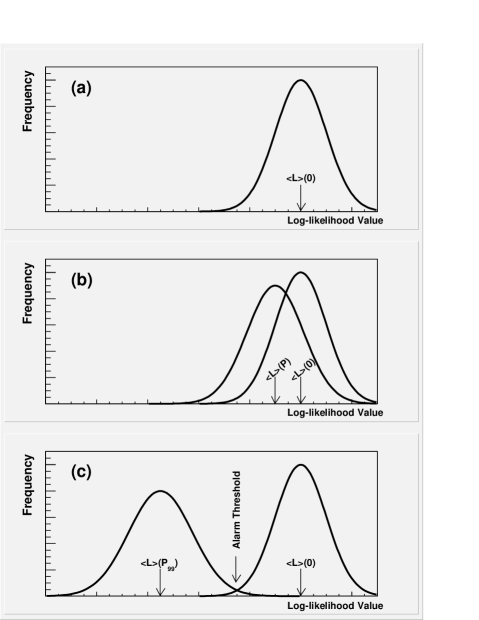
For the purpose of identifying a rogue reactor, a threshold level of the log-likelihood value for triggering an alarm is necessary. If this is set too close to , the observed value of would easily trigger a false-positive alarm just from statistical fluctuations. For the purpose of the present study, we decided to tolerate a 1% false-positive probability (Fig. 8 (c)). Once this threshold is set, we can talk about the sensitivity of an array. We quantified this with , which is the rogue reactor power that has a 99% chance of clearing the alarm threshold. Since rogue reactors are not likely to be much larger than 100 MW, a promising detector array should have at this level. Of course, the tolerance for false-positives and -negatives chosen here are arbitrary; looser tolerance would result in sensitivity to lower power, but at the cost of greater chance of mis-identification and missing an actually existing reactor.
References
- (1) http://www.iaea.org/.
- (2) http://www.fas.org/nuke/control/ctbt/.
- (3) http://www.cnn.com/2005/WORLD/asiapcf/02/10/ nkorea.timeline/index.html.
- Eguchi et al. (2003) K. Eguchi et al., Physical Review Letters 90, 021802 (2003), URL http://www.citebase.org/cgi-bin/citations?id=oai:arXiv.org:he%p-ex/0212021.
- (5) A. Bernstein, T. West, and V. Gupta, An assessment of antineutrino detection as a tool for monitoring nuclear explosions, Science & Global Security, Volume 9, pp. 235-255, ©2001 Taylor and Francis.
- Fukuda et al. (2003) S. Fukuda et al., Nuclear Instruments and Methods in Physics Research A 501, 418 462 (2003).
- Bemporad et al. (2002) C. Bemporad, G. Gratta, and P. Vogel, Reviews of Modern Physics 74, 297 (2002), URL http://www.citebase.org/cgi-bin/citations?id=oai:arXiv.org:he%p-ph/0107277.
- Beacom and Vagins (2004) J. F. Beacom and M. R. Vagins, Physical Review Letters 93, 171101 (2004), URL http://www.citebase.org/cgi-bin/citations?id=oai:arXiv.org:he%p-ph/0309300.
- Herndon (1979) J. M. Herndon, Proc. R. Soc. London A 368, 495 (1979).
- Herndon (1980) J. M. Herndon, Proc. R. Soc. London A 372, 149 (1980).
- Herndon (1996) J. M. Herndon, Proc. Natl. Acad. Sci. USA 93, 646 (1996).
- Hollenbach and Herndon (2001) D. F. Hollenbach and J. M. Herndon, Proc. Natl. Acad. Sci. USA 98, 11085 (2001).
- Herndon (2003) J. M. Herndon, Proc. Natl. Acad. Sci. USA 100, 3047 (2003).
- Maricic (2005) J. Maricic, Ph.D. thesis, University of Hawaii, Manoa (2005).
- (15) http://www.phys.hawaii.edu/ sdye/hnsc.html.