LC-PHSM-2006-002 Measurement of the top-Higgs Yukawa coupling at a Linear e+​eβˆ’superscript𝑒superscript𝑒e^{+}e^{-} Collider

Arnaud GAY 111e-mail: arnaud.gay@ires.in2p3.fr

Institut Pluridisciplinaire Hubert Curien
23 rue du Loess, BP 20, F-67037 Strasbourg, France
Abstract

Understanding the mechanism of electroweak symmetry breaking and the origin of boson and fermion masses is among the most pressing questions raised in contemporary particle physics. If these issues involve one (several) Higgs boson(s), a precise measurement of all its (their) properties will be of prime importance. Among those, the Higgs coupling to matter fermions (the Yukawa coupling). At a Linear Collider, the process e+​eβˆ’β†’t​t¯​Hβ†’superscript𝑒superscript𝑒𝑑¯𝑑𝐻e^{+}e^{-}\rightarrow t\overline{t}H will allow in principle a direct measurement of the top-Higgs Yukawa coupling. We present a realistic feasibility study of the measurement in the context of the TESLA collider. Four channels are studied and the analysis is repeated for several Higgs mass values within the range 120 GeV/c2 - 200 GeV/c2.

1 Introduction

The gauge sector of electroweak interactions has been checked to coincide with the Standard Model (SM) prediction to the per-mil level, at LEP and SLC. On the contrary, there is no direct experimental evidence for the Higgs mechanism, supposed to be responsible for electroweak symmetry breaking and the generation of masses. Direct search of the Higgs boson at LEP yields the lower limit [1]: MH>114.4subscript𝑀𝐻114.4M_{H}>114.4 GeV/c2 at 95%percent9595\% CL. Precision measurements on the other hand give [2]: MH≲240less-than-or-similar-tosubscript𝑀𝐻240M_{H}\lesssim 240 GeV/c2 at 99%percent9999\% CL. Once a Higgs particle is found, if ever, all its properties should be measured precisely to completely characterise the Higgs mechanism. Among those, the coupling of the Higgs boson to fermions (the Yukawa coupling), which is supposed to scale with the fermion mass:

gf​f​H=mfvsubscript𝑔𝑓𝑓𝐻subscriptπ‘šπ‘“π‘£g_{ffH}=\frac{m_{f}}{v} (1.1)

where gf​f​Hsubscript𝑔𝑓𝑓𝐻g_{ffH} is the Yukawa coupling of a fermion f of mass mfsubscriptπ‘šπ‘“m_{f} and v𝑣v is the vacuum expectation value of the Higgs field, v=(2​GF)βˆ’1/2β‰ˆ246𝑣superscript2subscript𝐺𝐹12246v=({\sqrt{2}G_{F}})^{-1/2}\approx 246 GeV.

The top quark is the heaviest fermion, thus the top-Higgs Yukawa coupling should be the easiest to measure. If MH>2βˆ—mtsubscript𝑀𝐻2subscriptπ‘šπ‘‘M_{H}>2*m_{t}, this parameter can be measured through the branching ratio of the Higgs boson decay into a pair of top quarks. Otherwise, i.e. for lower values of the Higgs boson mass, the process e+​eβˆ’β†’t​t¯​Hβ†’superscript𝑒superscript𝑒𝑑¯𝑑𝐻e^{+}e^{-}\rightarrow t\overline{t}H allows in principle a direct measurement of this coupling.

Feasibility studies of the measurement of the top-Higgs Yukawa coupling via the process e+​eβˆ’β†’t​t¯​Hβ†’superscript𝑒superscript𝑒𝑑¯𝑑𝐻e^{+}e^{-}\rightarrow t\overline{t}H at a Linear Collider have already been performed Β [3]Β [4] for a Higgs boson mass of 120-130 GeV/c2. This is the most favourable case (taking into account the lower mass bound) as the cross-section of this process decreases with increasing Higgs boson mass and as a Higgs boson of such a mass decays predominantly to a pair of b quarks, allowing a very effective signal and background separation using b-tagging algorithms. One of the studies ([4]) showed that a neural network analysis was essential to get a precise result. We repeated this work and extended it up to MH=subscript𝑀𝐻absentM_{H}= 150 GeV/c2. When MH≳greater-than-or-equivalent-tosubscript𝑀𝐻absentM_{H}\gtrsim 135 GeV/c2, the Hβ†’W+​Wβˆ’β†’π»superscriptπ‘Šsuperscriptπ‘ŠH\rightarrow W^{+}W^{-} decay mode dominates. This channel was also studied, for masses up to 200 GeV/c2.

2 The process e+​eβˆ’β†’t​t¯​Hβ†’superscript𝑒superscript𝑒𝑑¯𝑑𝐻e^{+}e^{-}\rightarrow t\overline{t}H

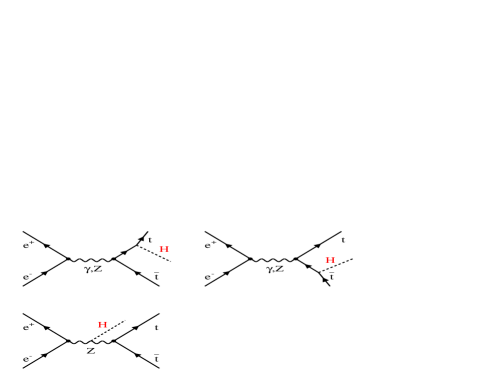
The lowest order Feynman diagrams contributing to the e+​eβˆ’β†’t​t¯​Hβ†’superscript𝑒superscript𝑒𝑑¯𝑑𝐻e^{+}e^{-}\rightarrow t\overline{t}H process are shown in figureΒ 1. The amplitude of the diagram where the Higgs boson is radiated from the Z boson is not expressing the top-Higgs Yukawa coupling. However, since it modifies only slightly the cross-section of the process, it can safely be neglected. The cross-section and the top-Higgs Yukawa coupling thus verify to a good approximation: Οƒe+​eβˆ’β†’t​t¯​H∝gt​t​H2proportional-tosubscriptπœŽβ†’superscript𝑒superscript𝑒𝑑¯𝑑𝐻subscriptsuperscript𝑔2𝑑𝑑𝐻\sigma_{e^{+}e^{-}\rightarrow t\overline{t}H}\propto g^{2}_{ttH}.

Refer to caption
Figure 1: Lowest order Feynman diagrams of the process e+​eβˆ’β†’t​t¯​Hβ†’superscript𝑒superscript𝑒𝑑¯𝑑𝐻e^{+}e^{-}\rightarrow t\overline{t}H.

For this work, the following assumptions were made: mt=175subscriptπ‘šπ‘‘175m_{t}=175 GeV/c2 and B​R​(tβ†’W​b)=100%π΅π‘…β†’π‘‘π‘Šπ‘percent100BR(t\rightarrow Wb)=100\%. The Higgs branching ratios were calculated with the HDECAYΒ [5] program. The values obtained for the Hβ†’b​b¯→𝐻𝑏¯𝑏H\rightarrow b\overline{b} and Hβ†’W+​Wβˆ’β†’π»superscriptπ‘Šsuperscriptπ‘ŠH\rightarrow W^{+}W^{-} modes, which are the main decays within the Higgs mass range considered in this paper, are shown in tableΒ 1 and figureΒ 2.

MHsubscript𝑀𝐻M_{H} (GeV/c2) B​R​(Hβ†’b​bΒ―)𝐡𝑅→𝐻𝑏¯𝑏BR(H\rightarrow b\overline{b}) B​R​(Hβ†’W+​Wβˆ’)𝐡𝑅→𝐻superscriptπ‘Šsuperscriptπ‘ŠBR(H\rightarrow W^{+}W^{-}) ΟƒπœŽ\sigma (fb)
(s=𝑠absent\sqrt{s}= 800 GeV)
120 67%percent\% 13%percent\% 2.50
130 51%percent\% 30%percent\% 2.17
140 33%percent\% 50%percent\% 1.88
150 16%percent\% 70%percent\% 1.64
160 3.1%percent3.13.1\% 92%percent9292\% 1.44
170 0.76%percent0.760.76\% 97%percent9797\% 1.25
180 0.48%percent0.480.48\% 93%percent9393\% 1.09
200 0.23%percent0.230.23\% 73%percent7373\% 0.80
Table 1: Higgs branching ratios for the Hβ†’b​b¯→𝐻𝑏¯𝑏H\rightarrow b\overline{b} and Hβ†’W+​Wβˆ’β†’π»superscriptπ‘Šsuperscriptπ‘ŠH\rightarrow W^{+}W^{-} modes (as given by HDECAY) and cross-section at lowest order of the process e+​eβˆ’β†’t​t¯​Hβ†’superscript𝑒superscript𝑒𝑑¯𝑑𝐻e^{+}e^{-}\rightarrow t\overline{t}H (as given by CompHEP), for various Higgs mass values and for s=𝑠absent\sqrt{s}= 800 GeV. In the calculation of the cross-section, initial state radiation and beamstrahlung were taken into account.
Refer to caption
Figure 2: Higgs branching ratios (dashed lines) for the Hβ†’b​b¯→𝐻𝑏¯𝑏H\rightarrow b\overline{b} and Hβ†’W+​Wβˆ’β†’π»superscriptπ‘Šsuperscriptπ‘ŠH\rightarrow W^{+}W^{-} modes (as given by HDECAY) and cross-section (solid line) at lowest order of the process e+​eβˆ’β†’t​t¯​Hβ†’superscript𝑒superscript𝑒𝑑¯𝑑𝐻e^{+}e^{-}\rightarrow t\overline{t}H (as given by CompHEP), for various Higgs mass values and for s=𝑠absent\sqrt{s}= 800 GeV. In the calculation of the cross-section, initial state radiation and beamstrahlung were taken into account.

Previous studies showed that a center-of-mass energy close to the kinematical limit of the t​t¯​H𝑑¯𝑑𝐻t\overline{t}H production process does not allow to measure the coupling with a satisfactory precision, due to the tiny cross-section. Center-of-mass energies of 800 GeV and 1 TeV have shown to be far better for the measurement. A run at 800 GeV being a very likely possibility for the Linear Collider, this will be the default value of our study. The lowest order cross-section of the process (as given by the CompHEPΒ [6] software) is shown in tableΒ 1 and figureΒ 2 for the Higgs mass range considered and a center-of-mass energy of 800 GeV.

The π’ͺ​(Ξ±s)π’ͺsubscript𝛼𝑠{\cal O}(\alpha_{s}) corrections to the e+​eβˆ’β†’t​t¯​Hβ†’superscript𝑒superscript𝑒𝑑¯𝑑𝐻e^{+}e^{-}\rightarrow t\overline{t}H process have been calculated by several groupsΒ [7]. At a center-of-mass energy of 800 GeV, they affect the total cross-section by less than 5%percent55\% and were thus neglected in this study.

3 Measurement of gt​t​Hsubscript𝑔𝑑𝑑𝐻g_{ttH}

For a particular analysis yielding a selection efficiency of the signal Ο΅s​e​ls​i​g​n​a​lsuperscriptsubscriptitalic-Ο΅π‘ π‘’π‘™π‘ π‘–π‘”π‘›π‘Žπ‘™\epsilon_{sel}^{signal} and a purity of the selected sample ρs​e​ls​a​m​p​l​esuperscriptsubscriptπœŒπ‘ π‘’π‘™π‘ π‘Žπ‘šπ‘π‘™π‘’\rho_{sel}^{sample} and assuming an integrated luminosity L, the statistical and systematic uncertainties on the measurement of gt​t​Hsubscript𝑔𝑑𝑑𝐻g_{ttH} can be expressed as follows:

(Δ​gt​t​Hgt​t​H)s​t​a​tβ‰ˆ1Ss​t​a​t​(gt​t​H2)​ϡs​e​ls​i​g​n​a​l​ρs​e​ls​a​m​p​l​e​LsubscriptΞ”subscript𝑔𝑑𝑑𝐻subscriptπ‘”π‘‘π‘‘π»π‘ π‘‘π‘Žπ‘‘1subscriptπ‘†π‘ π‘‘π‘Žπ‘‘subscriptsuperscript𝑔2𝑑𝑑𝐻superscriptsubscriptitalic-Ο΅π‘ π‘’π‘™π‘ π‘–π‘”π‘›π‘Žπ‘™superscriptsubscriptπœŒπ‘ π‘’π‘™π‘ π‘Žπ‘šπ‘π‘™π‘’πΏ\big{(}\frac{\Delta g_{ttH}}{g_{ttH}}\big{)}_{stat}\approx\frac{1}{S_{stat}(g^{2}_{ttH})\sqrt{\epsilon_{sel}^{signal}\rho_{sel}^{sample}L}} (3.1)
(Δ​gt​t​Hgt​t​H)s​y​s​tβ‰ˆ1Ss​y​s​t​(gt​t​H2)​1βˆ’Οs​e​ls​a​m​p​l​eρs​e​ls​a​m​p​l​e​Δ​σB​Ge​f​fΟƒB​Ge​f​fsubscriptΞ”subscript𝑔𝑑𝑑𝐻subscript𝑔𝑑𝑑𝐻𝑠𝑦𝑠𝑑1subscript𝑆𝑠𝑦𝑠𝑑subscriptsuperscript𝑔2𝑑𝑑𝐻1superscriptsubscriptπœŒπ‘ π‘’π‘™π‘ π‘Žπ‘šπ‘π‘™π‘’superscriptsubscriptπœŒπ‘ π‘’π‘™π‘ π‘Žπ‘šπ‘π‘™π‘’Ξ”superscriptsubscriptπœŽπ΅πΊπ‘’π‘“π‘“superscriptsubscriptπœŽπ΅πΊπ‘’π‘“π‘“\big{(}\frac{\Delta g_{ttH}}{g_{ttH}}\big{)}_{syst}\approx\frac{1}{S_{syst}(g^{2}_{ttH})}\frac{1-\rho_{sel}^{sample}}{\rho_{sel}^{sample}}\frac{\Delta\sigma_{BG}^{eff}}{\sigma_{BG}^{eff}} (3.2)

The default value for L assumed through the whole study is 1000 f​bβˆ’1𝑓superscript𝑏1fb^{-1}. This large value is quite essential to maintain the statistical uncertainty at the level of a few per-cent. Δ​σB​Ge​f​fΟƒB​Ge​f​fΞ”superscriptsubscriptπœŽπ΅πΊπ‘’π‘“π‘“superscriptsubscriptπœŽπ΅πΊπ‘’π‘“π‘“\frac{\Delta\sigma_{BG}^{eff}}{\sigma_{BG}^{eff}} is the relative uncertainty on the residual background normalisation. It is mostly due to badly known differential cross-sections in weakly populated phase space corners. It is sizeable and moreover difficult to estimate. However, t​t¯𝑑¯𝑑t\overline{t} pairs will be copiously produced at the LC, allowing a complete characterisation of them. For example, studying these pairs during a run at an energy where the t​t¯​H𝑑¯𝑑𝐻t\overline{t}H process is negligible will allow to improve their simulation by event generators. Therefore, this uncertainty should not exceed 10%. We will thus repeat the analysis for two values of this uncertainty, 10%percent1010\% and 5%percent55\%. In the systematic uncertainty, we just take into account the one which arises from the effective background normalisation since it is by far the largest one among those we can estimate now.

The sensitivity factors Ss​t​a​tsubscriptπ‘†π‘ π‘‘π‘Žπ‘‘S_{stat} and Ss​y​s​tsubscript𝑆𝑠𝑦𝑠𝑑S_{syst} in relations 3.1 and 3.2 express the dependence of the cross-section on the coupling squared:

Ss​t​a​t​(gt​t​H2)=1Οƒt​t¯​H​|d​σt​t¯​Hd​gt​t​H2|subscriptπ‘†π‘ π‘‘π‘Žπ‘‘subscriptsuperscript𝑔2𝑑𝑑𝐻1subscriptπœŽπ‘‘Β―π‘‘π»π‘‘subscriptπœŽπ‘‘Β―π‘‘π»π‘‘subscriptsuperscript𝑔2𝑑𝑑𝐻S_{stat}(g^{2}_{ttH})=\frac{1}{\sqrt{\sigma_{t\overline{t}H}}}\Bigg{|}\frac{d\sigma_{t\overline{t}H}}{dg^{2}_{ttH}}\Bigg{|} (3.3)
Ss​y​s​t​(gt​t​H2)=1Οƒt​t¯​H​|d​σt​t¯​Hd​gt​t​H2|subscript𝑆𝑠𝑦𝑠𝑑subscriptsuperscript𝑔2𝑑𝑑𝐻1subscriptπœŽπ‘‘Β―π‘‘π»π‘‘subscriptπœŽπ‘‘Β―π‘‘π»π‘‘subscriptsuperscript𝑔2𝑑𝑑𝐻S_{syst}(g^{2}_{ttH})=\frac{1}{\sigma_{t\overline{t}H}}\Bigg{|}\frac{d\sigma_{t\overline{t}H}}{dg^{2}_{ttH}}\Bigg{|} (3.4)

As pointed out in section 2, the contribution from Higgs radiation off the Z to the signal cross-section is very small. In order to calculate the sensitivity factors, we will thus neglect it, allowing a very simple calculation. In this approximation, we can write:

Οƒt​t¯​Hβ‰ˆgt​t​H2​F​(MH,mt,s)subscriptπœŽπ‘‘Β―π‘‘π»subscriptsuperscript𝑔2𝑑𝑑𝐻𝐹subscript𝑀𝐻subscriptπ‘šπ‘‘π‘ \sigma_{t\overline{t}H}\approx g^{2}_{ttH}F(M_{H},m_{t},s) (3.5)

And thus:

d​σt​t¯​Hd​gt​t​H2β‰ˆF​(MH,mt,s)β‰ˆΟƒt​t¯​Hgt​t​H2𝑑subscriptπœŽπ‘‘Β―π‘‘π»π‘‘subscriptsuperscript𝑔2𝑑𝑑𝐻𝐹subscript𝑀𝐻subscriptπ‘šπ‘‘π‘ subscriptπœŽπ‘‘Β―π‘‘π»subscriptsuperscript𝑔2𝑑𝑑𝐻\frac{d\sigma_{t\overline{t}H}}{dg^{2}_{ttH}}\approx F(M_{H},m_{t},s)\approx\frac{\sigma_{t\overline{t}H}}{g^{2}_{ttH}} (3.6)

where s is the squared collision energy.

The sensitivity factors eventually read:

Ss​t​a​t​(gt​t​H2)=Οƒt​t¯​Hgt​t​H2subscriptπ‘†π‘ π‘‘π‘Žπ‘‘subscriptsuperscript𝑔2𝑑𝑑𝐻subscriptπœŽπ‘‘Β―π‘‘π»subscriptsuperscript𝑔2𝑑𝑑𝐻S_{stat}(g^{2}_{ttH})=\frac{\sqrt{\sigma_{t\overline{t}H}}}{g^{2}_{ttH}} (3.7)
Ss​y​s​t​(gt​t​H2)=1gt​t​H2subscript𝑆𝑠𝑦𝑠𝑑subscriptsuperscript𝑔2𝑑𝑑𝐻1subscriptsuperscript𝑔2𝑑𝑑𝐻S_{syst}(g^{2}_{ttH})=\frac{1}{g^{2}_{ttH}} (3.8)

The values of Ss​t​a​tsubscriptπ‘†π‘ π‘‘π‘Žπ‘‘S_{stat} and Ss​y​s​tsubscript𝑆𝑠𝑦𝑠𝑑S_{syst} are summarised in tableΒ 2. In this approximation, Ss​y​s​tsubscript𝑆𝑠𝑦𝑠𝑑S_{syst} is independent of the Higgs mass and of the center-of-mass energy. The results obtained for MH=120subscript𝑀𝐻120M_{H}=120 GeV/c2 agree with those presented inΒ [4].

MHsubscript𝑀𝐻M_{H} (GeV/c2) Ss​t​a​tsubscriptπ‘†π‘ π‘‘π‘Žπ‘‘S_{stat} (fb1/2) Ss​y​s​tsubscript𝑆𝑠𝑦𝑠𝑑S_{syst}
120 3.13 1.98
130 2.92 1.98
140 2.72 1.98
150 2.54 1.98
170 2.21 1.98
200 1.77 1.98
Table 2: Sensitivity factors for various Higgs mass values at s=𝑠absent\sqrt{s}= 800 GeV.

4 Analysis and simulation

4.1 Background

The resonant background processes considered in the analysis are listed in tableΒ 3, together with their cross-sections (as given by the CompHEP software).

Elementary process ΟƒπœŽ\sigma (fb)
e+​eβˆ’β†’q​qΒ―β†’superscript𝑒superscriptπ‘’π‘žΒ―π‘že^{+}e^{-}\rightarrow q\overline{q} 1557.7
e+​eβˆ’β†’t​tΒ―β†’superscript𝑒superscript𝑒𝑑¯𝑑e^{+}e^{-}\rightarrow t\overline{t} 297.3
e+​eβˆ’β†’W+​Wβˆ’β†’superscript𝑒superscript𝑒superscriptπ‘Šsuperscriptπ‘Še^{+}e^{-}\rightarrow W^{+}W^{-} 4298
e+​eβˆ’β†’Z​Zβ†’superscript𝑒superscript𝑒𝑍𝑍e^{+}e^{-}\rightarrow ZZ 239.8
e+​eβˆ’β†’t​t¯​Zβ†’superscript𝑒superscript𝑒𝑑¯𝑑𝑍e^{+}e^{-}\rightarrow t\overline{t}Z 4.3
Table 3: Resonant background cross-sections for s=𝑠absent\sqrt{s}= 800 GeV from CompHEP. Initial state radiation and beamstrahlung are taken into account.

The processes e+​eβˆ’β†’q​qΒ―β†’superscript𝑒superscriptπ‘’π‘žΒ―π‘že^{+}e^{-}\rightarrow q\overline{q} and e+​eβˆ’β†’W+​Wβˆ’β†’superscript𝑒superscript𝑒superscriptπ‘Šsuperscriptπ‘Še^{+}e^{-}\rightarrow W^{+}W^{-} exhibit a very different topology from the signal, however, their huge cross-section (two or three orders of magnitude larger than the cross-section of the signal) forbids to neglect them.

Although its cross section is much lower, the above statements hold for the process e+​eβˆ’β†’Z​Zβ†’superscript𝑒superscript𝑒𝑍𝑍e^{+}e^{-}\rightarrow ZZ.

The process e+​eβˆ’β†’t​t¯​Zβ†’superscript𝑒superscript𝑒𝑑¯𝑑𝑍e^{+}e^{-}\rightarrow t\overline{t}Z and its cross section are very close to those of the signal.

Finally, the process e+​eβˆ’β†’t​tΒ―β†’superscript𝑒superscript𝑒𝑑¯𝑑e^{+}e^{-}\rightarrow t\overline{t} has a rather large cross-section and will often mimic the signal. It is expected to be the main background.

The backgrounds listed in table 3 don’t account for 6 fermion production, which may turn out to be not negligible. The generation of these events is however a complicated and very time consuming task, which leads to rather large uncertainties. As we do not want to completely neglect these final states, we adopt the following procedure, which acts as a compromise. The selection is first optimised for the suppression of resonant background (which is by far the main background). The residual contamination from the dominant 6 fermion processes is then estimated with the same selection criteria. The results will be presented with and without inclusion of the 6 fermion processes in the overall background.

4.2 Generation of events and simulation of the detector

The t​t¯​H𝑑¯𝑑𝐻t\overline{t}H and t​t¯​Z𝑑¯𝑑𝑍t\overline{t}Z partonic events were generated with CompHEP V.41.10. This program allows to include the initial state radiation and the beamstrahlung. These events were then treated with PYTHIA V.6.158Β [8] for hadronization, decay and final state radiation.

Resonant backgrounds were generated with PYTHIA V.6.158. In this case, the initial state radiation was considered in the structure function approach and the beamstrahlung was implemented with CIRCEΒ [9].

The 6 fermion process partonic events were generated with WHIZARD V.1.2x222Versions 1.22 to 1.24 were used. [10]. As for t​t¯​H𝑑¯𝑑𝐻t\overline{t}H and t​t¯​Z𝑑¯𝑑𝑍t\overline{t}Z events, they were treated with PYTHIA V.6.158 for hadronization, decay and final state radiation. Beamstrahlung and initial state radiation are handled by WHIZARD.

Some of these 6 fermion processes receive contributions from the reactions listed in table 3. For these processes, the corresponding diagrams are removed from the calculation to avoid double counting, keeping however the interference between the resonant and non-resonant diagrams. This short-cut is motivated by the complexity a more correct treatment would introduce; it is justified by the magnitude of the interferences considered.

The cross-sections of the 6 fermion processes are in general calculated with quite good accuracy. However, when coming to the event generation, things get substantially more complicated and time consuming. Due to CPU limitations, the number of events in the 6 fermion samples is sometimes modest and, conversely, the differential cross sections have sizeable statistical uncertainties. Furthermore, some ambiguities may arise when pairing the particles in the final state (needed for hadronization and final state radiation) e.g. when there are 2 pairs of identical particles.

The contaminations by the 6 fermion processes will thus not be estimated as precisely as the ones by the resonant backgrounds. The loss of resolution arising from these events should thus be taken as a rough estimate. This shoud not matter as the residual 6 fermion background is small.

The events were further processed by SIMDET V.4Β [11], the fast simulation program of the TESLAΒ [12] detector, in order to take into account detector and event reconstruction effects.

4.3 b-tagging

The b-tagging is an essential tool for this analysis, especially when assuming that the Higgs boson decays into a pair of b-quarks. b and c-tagging algorithms developed for LEP and SLC experiments were adapted to TESLA and their performances studiedΒ [13] Β [14]. Recently, these tools were made available with the fast simulation of the detectorΒ [15]. Various algorithms are combined, including the SLD-ZVTOP vertex finder, in a neural network. One of the outputs is the b-probability of a jet.

4.4 Definition of the variables used in the analysis

4.4.1 Fox-Wolfram moments

The Fox-Wolfram moments Hlsubscript𝐻𝑙H_{l}, l=0,1,2,…𝑙012…l=0,1,2,\ldots, are defined by

Hl=βˆ‘i,j|𝐩i|​|𝐩j|Evis2​Pl​(cos⁑θi​j),subscript𝐻𝑙subscript𝑖𝑗subscript𝐩𝑖subscript𝐩𝑗superscriptsubscript𝐸vis2subscript𝑃𝑙subscriptπœƒπ‘–π‘—H_{l}=\sum_{i,j}\frac{|\mathbf{p}_{i}|\,|\mathbf{p}_{j}|}{E_{\mathrm{vis}}^{2}}\,P_{l}(\cos\theta_{ij}), (4.1)

where ΞΈi​jsubscriptπœƒπ‘–π‘—\theta_{ij} is the opening angle between hadrons i𝑖i and j𝑗j and Evissubscript𝐸visE_{\mathrm{vis}} the total visible energy of the event. The Pl​(x)subscript𝑃𝑙π‘₯P_{l}(x) are the Legendre polynomials. In this paper, the moments will be normalized to H0subscript𝐻0H_{0}, i.e. Hl​0=Hl/H0subscript𝐻𝑙0subscript𝐻𝑙subscript𝐻0H_{l0}=H_{l}/H_{0}.

4.4.2 Heavy and light jet masses

The particles of an event are divided into 2 classes and the invariant mass of each class is calculated. We obtain the heavy and light jet masses when the assignment of particles to the classes is such that the quadratic sum of the invariant mass of the 2 classes is minimised. In events with resonances (e.g. e+​eβˆ’β†’W+​Wβˆ’β†’superscript𝑒superscript𝑒superscriptπ‘Šsuperscriptπ‘Še^{+}e^{-}\rightarrow W^{+}W^{-}), these quantities tend to peak at their invariant mass.

4.4.3 Other variables

Em​a​x​(m​i​n)j​e​tsubscriptsuperscriptπΈπ‘—π‘’π‘‘π‘šπ‘Žπ‘₯π‘šπ‘–π‘›E^{jet}_{max(min)} is the energy of the most (least) energetic jet of an event. The minimum jet multiplicity is the number of objects (charged as well as neutral) in the jet which has the smallest multiplicity. Pbj​e​t​(i)subscriptsuperscript𝑃𝑗𝑒𝑑𝑏𝑖P^{jet}_{b}(i) is the probability of the it​hsuperscriptπ‘–π‘‘β„Ži^{th} jet to be a b-jet, the Pbj​e​t​(i)subscriptsuperscript𝑃𝑗𝑒𝑑𝑏𝑖P^{jet}_{b}(i) being sorted out in decreasing order, i.e. from the most b-like to the least b-like.

The other variables are self-explanatory.

4.5 Neural network analysis

A neural network is used to optimize the selection of events. We used the MLPfit program [16], a multi-layer perceptron with error backpropagation.

5 Study of the Hβ†’b​b¯→𝐻𝑏¯𝑏H\rightarrow b\overline{b} decay mode

5.1 Introduction

When the Higgs boson decays into b​b¯𝑏¯𝑏b\overline{b} pairs, 3 classes of final states occur. Among them, two can potentially allow to measure the Yukawa coupling well: the semileptonic final state (t​tΒ―β†’W+​b​Wβˆ’β€‹bΒ―β†’2​b​2​q​l​ν→𝑑¯𝑑superscriptπ‘Šπ‘superscriptπ‘ŠΒ―π‘β†’2𝑏2π‘žπ‘™πœˆt\overline{t}\rightarrow W^{+}bW^{-}\overline{b}\rightarrow 2b2ql\nu with BR(ttΒ―β†’2b2qlΞ½)β‰ˆ43.9%)BR(t\overline{t}\rightarrow 2b2ql\nu)\approx 43.9\%) and the hadronic final state (t​tΒ―β†’W+​b​Wβˆ’β€‹bΒ―β†’2​b​4​q→𝑑¯𝑑superscriptπ‘Šπ‘superscriptπ‘ŠΒ―π‘β†’2𝑏4π‘žt\overline{t}\rightarrow W^{+}bW^{-}\overline{b}\rightarrow 2b4q with BR(ttΒ―β†’2b4q)β‰ˆ45.6%)BR(t\overline{t}\rightarrow 2b4q)\approx 45.6\%). These two channels are characterized by a large particle and jet multiplicity and an isotropic topology. The presence of four b-jets will allow the construction of very discriminating variables. However, the event rate is really tiny in comparison with the background and the very crowded environnement will degrade clustering and b-tagging algorithms and will make invariant mass constraints less effective. Furthermore, hard gluon radiation combined with gluon splitting to b​b¯𝑏¯𝑏b\overline{b} will often allow the background events to fake the signal.

For both channels, a preselection sequential procedure is first applied in order to remove most of the background, while keeping a high selection efficiency for the signal. A neural network analysis will then be performed in order to optimally use the information contained in the distributions of the final state characteristics. The analysis will be repeated for the following Higgs boson masses: 120 GeV/c2, 130 GeV/c2, 140 GeV/c2 and 150 GeV/c2. As the distributions hardly change in this mass window, the same procedure will be applied for each value of the Higgs boson mass.

5.2 Semileptonic Channel

5.2.1 Introduction

The final state follows from the process:

e+​eβˆ’β†’t​t¯​Hβ†’W+​b​Wβˆ’β€‹b¯​b​bΒ―β†’4​b​2​q​l​ν→superscript𝑒superscript𝑒𝑑¯𝑑𝐻→superscriptπ‘Šπ‘superscriptπ‘ŠΒ―π‘π‘Β―π‘β†’4𝑏2π‘žπ‘™πœˆe^{+}e^{-}\rightarrow t\overline{t}H\rightarrow W^{+}bW^{-}\overline{b}b\overline{b}\rightarrow 4b2ql\nu.

This channel is thus characterized by 4 b-jets, 2 light quark jets, one prompt lepton and missing 4-momentum. It has a little less statistics than the hadronic channel but the final state is cleaner and the presence of an isolated lepton together with missing 4-momentum will allow to construct powerful selection variables. Notice that, here, the hadronic channel (t​t¯​Hβ†’4​b​4​q→𝑑¯𝑑𝐻4𝑏4π‘žt\overline{t}H\rightarrow 4b4q), the fully leptonic channel (t​t¯​Hβ†’4​b​2​l​2​ν→𝑑¯𝑑𝐻4𝑏2𝑙2𝜈t\overline{t}H\rightarrow 4b2l2\nu) and the channels where the Higgs boson doesn’t decay into b quarks act as background processes.

5.2.2 Sequential analysis

First, we require the presence in the event of at least one charged lepton (a ΞΌΒ±superscriptπœ‡plus-or-minus\mu^{\pm} or a eΒ±superscript𝑒plus-or-minuse^{\pm}). Then, we request (figureΒ 5 andΒ 6333 The figures 4 to 22 are placed after the references.):

  • β€’

    500 GeV/c2<< Total visible mass << 750 GeV/c2

  • β€’

    Total multiplicity β‰₯\geq 110

  • β€’

    Number of jets (including possible isolated leptons; JADE algorithm with yc​u​t=1.10βˆ’3subscript𝑦𝑐𝑒𝑑superscript1.103y_{cut}=1.10^{-3}) β‰₯\geq 7

  • β€’

    Thrust ≀\leq 0.85

  • β€’

    Light jet mass β‰₯\geq 50 GeV/c2

  • β€’

    Heavy jet mass β‰₯\geq 150 GeV/c2

  • β€’

    Fox-Wolfram moment h10 ≀\leq 0.2

  • β€’

    Fox-Wolfram moment h20 ≀\leq 0.6

  • β€’

    Fox-Wolfram moment h30 ≀\leq 0.4

  • β€’

    Fox-Wolfram moment h40 ≀\leq 0.5

Now, an energetic and isolated charged lepton has to be identified. Among all the charged leptons (ΞΌΒ±superscriptπœ‡plus-or-minus\mu^{\pm} and eΒ±superscript𝑒plus-or-minuse^{\pm}) reconstructed by the detector, the one which maximises : Elβˆ—(1βˆ’c​o​s​θ)subscript𝐸𝑙1π‘π‘œπ‘ πœƒE_{l}*(1-cos\theta), Elsubscript𝐸𝑙E_{l} being the energy of the lepton and ΞΈπœƒ\theta the angle between its direction and that of the closest jet when we force the rest of particles in a 6 jet configuration (with JADE), is chosen. This procedure allows to choose a lepton from a leptonic decay of a W rather than from a B (or D) -meson decay which tends to be less energetic and isolated.

Once the lepton is tagged, the remaining particles are forced into 6 jets with the JADE algorithm. We then flavour-tag the jets and finally we require (figureΒ 6):

  • β€’

    Mininum jet multiplicity β‰₯\geq 3

  • β€’

    βˆ‘i=14Pbj​e​t​(i)β‰₯superscriptsubscript𝑖14subscriptsuperscript𝑃𝑗𝑒𝑑𝑏𝑖absent\sum_{i=1}^{4}P^{jet}_{b}(i)\geq 1

The overall preselection efficiencies and corresponding effective cross-sections444The effective cross-section of a process X is defined as the remaining cross-section of this process after a selection procedure: ΟƒXe​f​f=ΟƒXt​o​tβˆ—Ο΅XsuperscriptsubscriptπœŽπ‘‹π‘’π‘“π‘“superscriptsubscriptπœŽπ‘‹π‘‘π‘œπ‘‘subscriptitalic-ϡ𝑋\sigma_{X}^{eff}=\sigma_{X}^{tot}*\epsilon_{X}; where Ο΅Xsubscriptitalic-ϡ𝑋\epsilon_{X} is the selection efficiency for the process X. are shown in tableΒ 4. Apart from hadronic t​t¯​H𝑑¯𝑑𝐻t\overline{t}H and t​t¯​H​(H↛b​bΒ―)𝑑¯𝑑𝐻↛𝐻𝑏¯𝑏t\overline{t}H(H\nrightarrow b\overline{b}) events, the backgrounds with the highest preselection efficiencies are, as expected, those of the t​t¯𝑑¯𝑑t\overline{t} and t​t¯​Z𝑑¯𝑑𝑍t\overline{t}Z productions. However, due to its relatively high cross-section, the main background after this preselection is by far the one due to the e+​eβˆ’β†’t​tΒ―β†’superscript𝑒superscript𝑒𝑑¯𝑑e^{+}e^{-}\rightarrow t\overline{t} process.

Final state MHsubscript𝑀𝐻M_{H} (GeV/c)2{}^{2}) Ο΅p​r​e​s​e​lsubscriptitalic-Ο΅π‘π‘Ÿπ‘’π‘ π‘’π‘™\epsilon_{presel} (%percent\%) Οƒe​f​f​(f​b)subscriptπœŽπ‘’π‘“π‘“π‘“π‘\sigma_{eff}(fb)
t​t¯​Hβ†’4​b​2​q​l​ν→𝑑¯𝑑𝐻4𝑏2π‘žπ‘™πœˆt\overline{t}H\rightarrow 4b2ql\nu 120 61.861.861.8 4.56β‹…10βˆ’1β‹…absentsuperscript101\cdot 10^{-1}
t​t¯​Hβ†’4​b​2​q​l​ν→𝑑¯𝑑𝐻4𝑏2π‘žπ‘™πœˆt\overline{t}H\rightarrow 4b2ql\nu 130 62.662.662.6 3.04β‹…10βˆ’1β‹…absentsuperscript101\cdot 10^{-1}
t​t¯​Hβ†’4​b​2​q​l​ν→𝑑¯𝑑𝐻4𝑏2π‘žπ‘™πœˆt\overline{t}H\rightarrow 4b2ql\nu 140 64.064.064.0 1.75β‹…10βˆ’1β‹…absentsuperscript101\cdot 10^{-1}
t​t¯​Hβ†’4​b​2​q​l​ν→𝑑¯𝑑𝐻4𝑏2π‘žπ‘™πœˆt\overline{t}H\rightarrow 4b2ql\nu 150 65.365.365.3 7.57β‹…10βˆ’2β‹…absentsuperscript102\cdot 10^{-2}
t​t¯𝑑¯𝑑t\overline{t} - 9.029.029.02 26.8
t​t¯​Z𝑑¯𝑑𝑍t\overline{t}Z - 23.523.523.5 1.01
W​Wπ‘Šπ‘ŠWW - 8.30β‹…10βˆ’3β‹…8.30superscript1038.30\cdot 10^{-3} 3.56β‹…10βˆ’1β‹…absentsuperscript101\cdot 10^{-1}
Z​Z𝑍𝑍ZZ - 7.27β‹…10βˆ’2β‹…7.27superscript1027.27\cdot 10^{-2} 1.74β‹…10βˆ’1β‹…absentsuperscript101\cdot 10^{-1}
q​qΒ―π‘žΒ―π‘žq\overline{q} - 6.25β‹…10βˆ’3β‹…6.25superscript1036.25\cdot 10^{-3} 9.77β‹…10βˆ’2β‹…absentsuperscript102\cdot 10^{-2}
t​t¯​Hβ†’4​b​4​q→𝑑¯𝑑𝐻4𝑏4π‘žt\overline{t}H\rightarrow 4b4q 120 40.340.340.3 3.08β‹…10βˆ’1β‹…absentsuperscript101\cdot 10^{-1}
t​t¯​Hβ†’4​b​4​q→𝑑¯𝑑𝐻4𝑏4π‘žt\overline{t}H\rightarrow 4b4q 130 40.640.640.6 2.05β‹…10βˆ’1β‹…absentsuperscript101\cdot 10^{-1}
t​t¯​Hβ†’4​b​4​q→𝑑¯𝑑𝐻4𝑏4π‘žt\overline{t}H\rightarrow 4b4q 140 40.240.240.2 1.14β‹…10βˆ’1β‹…absentsuperscript101\cdot 10^{-1}
t​t¯​Hβ†’4​b​4​q→𝑑¯𝑑𝐻4𝑏4π‘žt\overline{t}H\rightarrow 4b4q 150 40.440.440.4 4.86β‹…10βˆ’2β‹…absentsuperscript102\cdot 10^{-2}
t​t¯​Hβ†’4​b​2​l​2​ν→𝑑¯𝑑𝐻4𝑏2𝑙2𝜈t\overline{t}H\rightarrow 4b2l2\nu 120 7.287.287.28 1.34β‹…10βˆ’2β‹…absentsuperscript102\cdot 10^{-2}
t​t¯​Hβ†’4​b​2​l​2​ν→𝑑¯𝑑𝐻4𝑏2𝑙2𝜈t\overline{t}H\rightarrow 4b2l2\nu 130 8.218.218.21 9.54β‹…10βˆ’3β‹…absentsuperscript103\cdot 10^{-3}
t​t¯​Hβ†’4​b​2​l​2​ν→𝑑¯𝑑𝐻4𝑏2𝑙2𝜈t\overline{t}H\rightarrow 4b2l2\nu 140 9.449.449.44 6.18β‹…10βˆ’3β‹…absentsuperscript103\cdot 10^{-3}
t​t¯​Hβ†’4​b​2​l​2​ν→𝑑¯𝑑𝐻4𝑏2𝑙2𝜈t\overline{t}H\rightarrow 4b2l2\nu 150 10.710.710.7 2.97β‹…10βˆ’3β‹…absentsuperscript103\cdot 10^{-3}
t​t¯​H​(H↛2​b)𝑑¯𝑑𝐻↛𝐻2𝑏t\overline{t}H(H\nrightarrow 2b) 120 30.330.330.3 2.48β‹…10βˆ’1β‹…absentsuperscript101\cdot 10^{-1}
t​t¯​H​(H↛2​b)𝑑¯𝑑𝐻↛𝐻2𝑏t\overline{t}H(H\nrightarrow 2b) 130 31.931.931.9 3.36β‹…10βˆ’1β‹…absentsuperscript101\cdot 10^{-1}
t​t¯​H​(H↛2​b)𝑑¯𝑑𝐻↛𝐻2𝑏t\overline{t}H(H\nrightarrow 2b) 140 33.333.333.3 4.21β‹…10βˆ’1β‹…absentsuperscript101\cdot 10^{-1}
t​t¯​H​(H↛2​b)𝑑¯𝑑𝐻↛𝐻2𝑏t\overline{t}H(H\nrightarrow 2b) 150 33.533.533.5 4.65β‹…10βˆ’1β‹…absentsuperscript101\cdot 10^{-1}
Total background 120 4.52β‹…10βˆ’1β‹…4.52superscript1014.52\cdot 10^{-1} 28.9
Total background 130 4.52β‹…10βˆ’1β‹…4.52superscript1014.52\cdot 10^{-1} 28.9
Total background 140 4.51β‹…10βˆ’1β‹…4.51superscript1014.51\cdot 10^{-1} 28.9
Total background 150 4.51β‹…10βˆ’1β‹…4.51superscript1014.51\cdot 10^{-1} 28.9
Table 4: The Hβ†’b​b¯→𝐻𝑏¯𝑏H\rightarrow b\overline{b} semileptonic channel: preselection efficiencies (Ο΅p​r​e​s​e​lsubscriptitalic-Ο΅π‘π‘Ÿπ‘’π‘ π‘’π‘™\epsilon_{presel}) and corresponding effective cross-sections (Οƒe​f​fsubscriptπœŽπ‘’π‘“π‘“\sigma_{eff}) for various Higgs boson masses. The 4 top lines stand for the selected signal final state, while the next lines break down the different background components (including those due to t​t¯​H𝑑¯𝑑𝐻t\overline{t}H events with another Higgs decay channel).

5.2.3 Neural network analysis

The distributions used for the preselection procedure still contain unexploited information. Some of them are then used to train a neural network together with other variables related to b-tagging, to the charged lepton and including the missing momentum.

The complete list of variables is (figure 7 and 8):

  • β€’

    The total visible mass.

  • β€’

    The number of jets (including possible isolated leptons; JADE algorithm with yc​u​t=1.10βˆ’3subscript𝑦𝑐𝑒𝑑superscript1.103y_{cut}=1.10^{-3}).

  • β€’

    The thrust.

  • β€’

    The aplanarity.

  • β€’

    The second Fox-Wolfram moment h20.

  • β€’

    βˆ‘i=14Pbj​e​t​(i)superscriptsubscript𝑖14subscriptsuperscript𝑃𝑗𝑒𝑑𝑏𝑖\sum_{i=1}^{4}P^{jet}_{b}(i).

  • β€’

    Em​a​xj​e​tβˆ’Em​i​nj​e​tsubscriptsuperscriptπΈπ‘—π‘’π‘‘π‘šπ‘Žπ‘₯subscriptsuperscriptπΈπ‘—π‘’π‘‘π‘šπ‘–π‘›E^{jet}_{max}-E^{jet}_{min}.

  • β€’

    The energy of the tagged lepton.

  • β€’

    The invariant mass of the system made of the lepton and the missing momentum.

  • β€’

    The cosine of the angle between the tagged lepton and the closest jet directions.

Apart from the 5 first ones, all these variables were calculated once the event was forced to the lepton tagged plus 6 jet configuration.

Once the neural network is trained, its weights are optimized for the separation of signal from background events. The distribution of the neural network output for these 2 classes of events is shown in figureΒ 9 for the case where MH=120subscript𝑀𝐻120M_{H}=120 GeV/c2absentsuperscript𝑐2/c^{2}. From this figure, we observe that the separation is quite effective. However, due to the tiny cross-section of the signal process, the purity of the selected sample and the selection efficiency of the signal will be small and, eventually, the accuracy on the measurement of gt​t​Hsubscript𝑔𝑑𝑑𝐻g_{ttH} will be limited accordingly (see relations 3.1 and 3.2).

5.2.4 Results

Refer to caption
Refer to caption
Figure 3: The Hβ†’b​b¯→𝐻𝑏¯𝑏H\rightarrow b\overline{b} semileptonic channel: (left) selection efficiency, purity and their product, (right) statistical, systematic and total uncertainties on the measurement of gt​t​Hsubscript𝑔𝑑𝑑𝐻g_{ttH} as functions of the value of the cut on the neural network output for Δ​σB​Ge​f​fΟƒB​Ge​f​fΞ”superscriptsubscriptπœŽπ΅πΊπ‘’π‘“π‘“superscriptsubscriptπœŽπ΅πΊπ‘’π‘“π‘“\frac{\Delta\sigma_{BG}^{eff}}{\sigma_{BG}^{eff}} = 5%percent55\% and MH=120subscript𝑀𝐻120M_{H}=120 GeV/c2.

The next step consists to apply a cut on the output of the neural network to further separate the signal and the background. The cut value is chosen such that it minimises the quadratic sum of the statistical and systematic uncertainties. The value of this optimal cut depends on the assumption made for the value of the uncertainty on the residual background normalisation and on the number of signal events, which in turn depends on the Higgs boson mass.

The evolution of the selection efficiency of the signal Ο΅s​e​ls​i​g​n​a​lsuperscriptsubscriptitalic-Ο΅π‘ π‘’π‘™π‘ π‘–π‘”π‘›π‘Žπ‘™\epsilon_{sel}^{signal}, the purity of the selected sample ρs​e​ls​a​m​p​l​esuperscriptsubscriptπœŒπ‘ π‘’π‘™π‘ π‘Žπ‘šπ‘π‘™π‘’\rho_{sel}^{sample}, their products, the statistical, systematic and total uncertainties as a function of the cut on the neural network output are shown in figureΒ 3 for the case where MH=120subscript𝑀𝐻120M_{H}=120 GeV/c2 and Δ​σB​Ge​f​fΟƒB​Ge​f​f=5%Ξ”superscriptsubscriptπœŽπ΅πΊπ‘’π‘“π‘“superscriptsubscriptπœŽπ΅πΊπ‘’π‘“π‘“percent5\frac{\Delta\sigma_{BG}^{eff}}{\sigma_{BG}^{eff}}=5\%. As we increase the cut, the purity gets higher and its derivative is increasing. The systematic uncertainty behaves the same way as 1βˆ’Οs​e​ls​a​m​p​l​eρs​e​ls​a​m​p​l​e1superscriptsubscriptπœŒπ‘ π‘’π‘™π‘ π‘Žπ‘šπ‘π‘™π‘’superscriptsubscriptπœŒπ‘ π‘’π‘™π‘ π‘Žπ‘šπ‘π‘™π‘’\frac{1-\rho_{sel}^{sample}}{\rho_{sel}^{sample}}. It is a decreasing function of ρ𝜌\rho, which varies fast for values of ρ𝜌\rho close to 0 and less as ρ𝜌\rho increases. The evolution of the selection efficiency is opposite to the one of the purity. Their product has thus a small variation. It however increases until a particular cut value (0.92 for this case). The statistical uncertainty will thus slowly decrease until this cut value. A higher cut provokes a sharp drop of the efficiency and a degradation of the statistical uncertainty. Eventually, the optimal cut is about 0.95 for the case under study.

The selection efficiencies and the corresponding effective cross-sections are shown in table 5 for MH=120subscript𝑀𝐻120M_{H}=120 GeV/c2 and Δ​σB​Ge​f​fΟƒB​Ge​f​fΞ”superscriptsubscriptπœŽπ΅πΊπ‘’π‘“π‘“superscriptsubscriptπœŽπ΅πΊπ‘’π‘“π‘“\frac{\Delta\sigma_{BG}^{eff}}{\sigma_{BG}^{eff}} = 5%percent55\%. In this case, the number of selected events amounts to 107 for the signal and to 192 for the background. The main background after selection is due to top-pair production.

The uncertainties on gt​t​Hsubscript𝑔𝑑𝑑𝐻g_{ttH} are shown in tableΒ 6 and on the figure 4. They range from 9.1% (11.7%) to 48.7% (65.9%) for Δ​σB​Ge​f​fΟƒB​Ge​f​f=5%Ξ”superscriptsubscriptπœŽπ΅πΊπ‘’π‘“π‘“superscriptsubscriptπœŽπ΅πΊπ‘’π‘“π‘“percent5\frac{\Delta\sigma_{BG}^{eff}}{\sigma_{BG}^{eff}}=5\% (10%). The resolution degrades with increasing mass due to the reduction of the statistics of the signal.

Final state Ο΅s​e​lsubscriptitalic-ϡ𝑠𝑒𝑙\epsilon_{sel} (%percent\%) Οƒe​f​fsubscriptπœŽπ‘’π‘“π‘“\sigma_{eff} (f​b)𝑓𝑏(fb)
t​t¯​Hβ†’4​b​2​q​l​ν→𝑑¯𝑑𝐻4𝑏2π‘žπ‘™πœˆt\overline{t}H\rightarrow 4b2ql\nu 14.614.614.6 1.07β‹…10βˆ’1β‹…absentsuperscript101\cdot 10^{-1}
t​t¯𝑑¯𝑑t\overline{t} 4.26β‹…10βˆ’2β‹…4.26superscript1024.26\cdot 10^{-2} 1.27β‹…10βˆ’1β‹…absentsuperscript101\cdot 10^{-1}
t​t¯​Z𝑑¯𝑑𝑍t\overline{t}Z 9.36β‹…10βˆ’1β‹…absentsuperscript101\cdot 10^{-1} 4.01β‹…10βˆ’2β‹…absentsuperscript102\cdot 10^{-2}
W​Wπ‘Šπ‘ŠWW <3.7β‹…10βˆ’5absentβ‹…3.7superscript105<3.7\cdot 10^{-5} <1.6β‹…10βˆ’3absentβ‹…1.6superscript103<1.6\cdot 10^{-3}
Z​Z𝑍𝑍ZZ 5.77β‹…10βˆ’4β‹…5.77superscript1045.77\cdot 10^{-4} 1.38β‹…10βˆ’3β‹…absentsuperscript103\cdot 10^{-3}
q​qΒ―π‘žΒ―π‘žq\overline{q} <10βˆ’4absentsuperscript104<10^{-4} <1.6β‹…10βˆ’3absentβ‹…1.6superscript103<1.6\cdot 10^{-3}
t​t¯​Hβ†’4​b​4​q→𝑑¯𝑑𝐻4𝑏4π‘žt\overline{t}H\rightarrow 4b4q 1.821.821.82 1.40β‹…10βˆ’2β‹…absentsuperscript102\cdot 10^{-2}
t​t¯​Hβ†’4​b​2​l​2​ν→𝑑¯𝑑𝐻4𝑏2𝑙2𝜈t\overline{t}H\rightarrow 4b2l2\nu 1.321.321.32 2.33β‹…10βˆ’3β‹…absentsuperscript103\cdot 10^{-3}
t​t¯​H​(H↛2​b)𝑑¯𝑑𝐻↛𝐻2𝑏t\overline{t}H(H\nrightarrow 2b) 9.69.69.6β‹…10βˆ’1β‹…absentsuperscript101\cdot 10^{-1} 7.86β‹…10βˆ’3β‹…absentsuperscript103\cdot 10^{-3}
Total background 3.01β‹…10βˆ’3β‹…3.01superscript1033.01\cdot 10^{-3} 1.92β‹…10βˆ’1β‹…absentsuperscript101\cdot 10^{-1}
Table 5: The Hβ†’b​b¯→𝐻𝑏¯𝑏H\rightarrow b\overline{b} semileptonic channel: selection efficiencies (Ο΅s​e​lsubscriptitalic-ϡ𝑠𝑒𝑙\epsilon_{sel}) and corresponding effective cross-sections (Οƒe​f​fsubscriptπœŽπ‘’π‘“π‘“\sigma_{eff}) for Δ​σB​Ge​f​fΟƒB​Ge​f​fΞ”superscriptsubscriptπœŽπ΅πΊπ‘’π‘“π‘“superscriptsubscriptπœŽπ΅πΊπ‘’π‘“π‘“\frac{\Delta\sigma_{BG}^{eff}}{\sigma_{BG}^{eff}} = 5%percent55\% and MH=120subscript𝑀𝐻120M_{H}=120 GeV/c2.
MHsubscript𝑀𝐻M_{H} (GeV/c2) Δ​σB​Ge​f​fΟƒB​Ge​f​fΞ”superscriptsubscriptπœŽπ΅πΊπ‘’π‘“π‘“superscriptsubscriptπœŽπ΅πΊπ‘’π‘“π‘“\frac{\Delta\sigma_{BG}^{eff}}{\sigma_{BG}^{eff}} Ο΅s​e​ls​i​g​n​a​lsuperscriptsubscriptitalic-Ο΅π‘ π‘’π‘™π‘ π‘–π‘”π‘›π‘Žπ‘™\epsilon_{sel}^{signal} ρs​e​ls​a​m​p​l​esuperscriptsubscriptπœŒπ‘ π‘’π‘™π‘ π‘Žπ‘šπ‘π‘™π‘’\rho_{sel}^{sample} (Δ​gt​t​Hgt​t​H)s​t​a​tsubscriptΞ”subscript𝑔𝑑𝑑𝐻subscriptπ‘”π‘‘π‘‘π»π‘ π‘‘π‘Žπ‘‘\big{(}\frac{\Delta g_{ttH}}{g_{ttH}}\big{)}_{stat} (Δ​gt​t​Hgt​t​H)s​y​s​tsubscriptΞ”subscript𝑔𝑑𝑑𝐻subscript𝑔𝑑𝑑𝐻𝑠𝑦𝑠𝑑\big{(}\frac{\Delta g_{ttH}}{g_{ttH}}\big{)}_{syst} Δ​gt​t​Hgt​t​HΞ”subscript𝑔𝑑𝑑𝐻subscript𝑔𝑑𝑑𝐻\frac{\Delta g_{ttH}}{g_{ttH}}
120 5%percent55\% 14.6%percent14.614.6\% 36.0%percent36.036.0\% 8.0%percent8.08.0\% 4.5%percent4.54.5\% 9.1%percent9.19.1\%
10%percent1010\% 10.7%percent10.710.7\% 39.7%percent39.739.7\% 8.8%percent8.88.8\% 7.7%percent7.77.7\% 11.7%percent11.711.7\%
130 5%percent55\% 16.3%percent16.316.3\% 26.0%percent26.026.0\% 10.9%percent10.910.9\% 7.2%percent7.27.2\% 13.0%percent13.013.0\%
10%percent1010\% 12.9%percent12.912.9\% 28.8%percent28.828.8\% 11.6%percent11.611.6\% 12.5%percent12.512.5\% 17.1%percent17.117.1\%
140 5%percent55\% 17.4%percent17.417.4\% 17.1%percent17.117.1\% 17.5%percent17.517.5\% 12.2%percent12.212.2\% 21.3%percent21.321.3\%
10%percent1010\% 11.1%percent11.111.1\% 20.1%percent20.120.1\% 20.2%percent20.220.2\% 20.1%percent20.120.1\% 28.5%percent28.528.5\%
150 5%percent55\% 13.8%percent13.813.8\% 9.0%percent9.09.0\% 41.4%percent41.441.4\% 25.6%percent25.625.6\% 48.7%percent48.748.7\%
10%percent1010\% 13.8%percent13.813.8\% 9.0%percent9.09.0\% 41.4%percent41.441.4\% 51.2%percent51.251.2\% 65.9%percent65.965.9\%
Table 6: The Hβ†’b​b¯→𝐻𝑏¯𝑏H\rightarrow b\overline{b} semileptonic channel: expected uncertainty on the measurement of gt​t​Hsubscript𝑔𝑑𝑑𝐻g_{ttH} for various Higgs boson masses. Selection efficiency of the signal (Ο΅s​e​ls​i​g​n​a​lsuperscriptsubscriptitalic-Ο΅π‘ π‘’π‘™π‘ π‘–π‘”π‘›π‘Žπ‘™\epsilon_{sel}^{signal}) and purity of the selected sample (ρs​e​ls​a​m​p​l​esuperscriptsubscriptπœŒπ‘ π‘’π‘™π‘ π‘Žπ‘šπ‘π‘™π‘’\rho_{sel}^{sample}) are also shown.

5.2.5 Precision loss due to 6 fermion processes

In the case of the final state under study, the most contaminating 6 fermion processes are the ones made of at least 4 b-quarks. They were studied for MH=120subscript𝑀𝐻120M_{H}=120 GeV/c2. Their cross section and selection efficiency are shown in tableΒ 7 and the loss of resolution on the measurement of gt​t​Hsubscript𝑔𝑑𝑑𝐻g_{ttH} is shown in tableΒ 8. One observes that it can be neglected.

Final state σ​(f​b)πœŽπ‘“π‘\sigma(fb) Ο΅s​e​lsubscriptitalic-ϡ𝑠𝑒𝑙\epsilon_{sel}
b​b¯​b​b¯​b​b¯𝑏¯𝑏𝑏¯𝑏𝑏¯𝑏b\overline{b}b\overline{b}b\overline{b} 6.4β‹…10βˆ’3β‹…6.4superscript1036.4\cdot 10^{-3} 5.0%percent5.05.0\%
b​b¯​b​b¯​q​qΒ―π‘Β―π‘π‘Β―π‘π‘žΒ―π‘žb\overline{b}b\overline{b}q\overline{q} (q=u,d)π‘žπ‘’π‘‘(q=u,d) 1.2β‹…10βˆ’1β‹…1.2superscript1011.2\cdot 10^{-1} 1.0%percent1.01.0\%
b​b¯​b​b¯​s​s¯𝑏¯𝑏𝑏¯𝑏𝑠¯𝑠b\overline{b}b\overline{b}s\overline{s} 6.3β‹…10βˆ’2β‹…6.3superscript1026.3\cdot 10^{-2} 1.3%percent1.31.3\%
b​b¯​b​b¯​c​c¯𝑏¯𝑏𝑏¯𝑏𝑐¯𝑐b\overline{b}b\overline{b}c\overline{c} 5.1β‹…10βˆ’2β‹…5.1superscript1025.1\cdot 10^{-2} 2.0%percent2.02.0\%
b​b¯​b​b¯​t​t¯𝑏¯𝑏𝑏¯𝑏𝑑¯𝑑b\overline{b}b\overline{b}t\overline{t} 6.9β‹…10βˆ’3β‹…6.9superscript1036.9\cdot 10^{-3} 14.2%percent14.214.2\%
b​b¯​q​q¯​t​tΒ―π‘Β―π‘π‘žΒ―π‘žπ‘‘Β―π‘‘b\overline{b}q\overline{q}t\overline{t} (q=u,d,s)π‘žπ‘’π‘‘π‘ (q=u,d,s) 8.9β‹…10βˆ’3β‹…8.9superscript1038.9\cdot 10^{-3} 5.2%percent5.25.2\%
b​b¯​c​c¯​t​t¯𝑏¯𝑏𝑐¯𝑐𝑑¯𝑑b\overline{b}c\overline{c}t\overline{t} 3.5β‹…10βˆ’3β‹…3.5superscript1033.5\cdot 10^{-3} 6.6%percent6.66.6\%
b​b¯​t​b¯​d​u¯𝑏¯𝑏𝑑¯𝑏𝑑¯𝑒b\overline{b}t\overline{b}d\overline{u} βˆ— ∼1β‹…10βˆ’2similar-toabsentβ‹…1superscript102\sim 1\cdot 10^{-2} 5.4%percent5.45.4\%
b​b¯​t​bΒ―β€‹ΞΌβ€‹Ξ½Β―π‘Β―π‘π‘‘Β―π‘πœ‡Β―πœˆb\overline{b}t\overline{b}\mu\overline{\nu} βˆ— ∼3β‹…10βˆ’3similar-toabsentβ‹…3superscript103\sim 3\cdot 10^{-3} 14.2%percent14.214.2\%
Table 7: The Hβ†’b​b¯→𝐻𝑏¯𝑏H\rightarrow b\overline{b} semileptonic channel: cross section (ΟƒπœŽ\sigma) and selection efficiencies (Ο΅s​e​lsubscriptitalic-ϡ𝑠𝑒𝑙\epsilon_{sel}) of the 6 fermion processes for Δ​σB​Ge​f​fΟƒB​Ge​f​fΞ”superscriptsubscriptπœŽπ΅πΊπ‘’π‘“π‘“superscriptsubscriptπœŽπ΅πΊπ‘’π‘“π‘“\frac{\Delta\sigma_{BG}^{eff}}{\sigma_{BG}^{eff}} = 5%percent55\% and MH=120subscript𝑀𝐻120M_{H}=120 GeV/c2. For events marked with a βˆ—, some diagrams were removed from the calculation to avoid double counting.
Δ​σB​Ge​f​fΟƒB​Ge​f​fΞ”superscriptsubscriptπœŽπ΅πΊπ‘’π‘“π‘“superscriptsubscriptπœŽπ΅πΊπ‘’π‘“π‘“\frac{\Delta\sigma_{BG}^{eff}}{\sigma_{BG}^{eff}} Δ​gt​t​Hgt​t​HΞ”subscript𝑔𝑑𝑑𝐻subscript𝑔𝑑𝑑𝐻\frac{\Delta g_{ttH}}{g_{ttH}}(without 6f) Δ​gt​t​Hgt​t​HΞ”subscript𝑔𝑑𝑑𝐻subscript𝑔𝑑𝑑𝐻\frac{\Delta g_{ttH}}{g_{ttH}}(with 6f)
5%percent55\% 9.1%percent9.19.1\% 9.3%percent9.39.3\%
10%percent1010\% 11.7%percent11.711.7\% 12.1%percent12.112.1\%
Table 8: The Hβ†’b​b¯→𝐻𝑏¯𝑏H\rightarrow b\overline{b} semileptonic channel: expected uncertainty on the measurement of gt​t​Hsubscript𝑔𝑑𝑑𝐻g_{ttH} without and with inclusion of the 6 fermion processes in the analysis for MH=120subscript𝑀𝐻120M_{H}=120 GeV/c2.

5.3 Hadronic channel

5.3.1 Introduction

The final state follows from the process:

e+​eβˆ’β†’t​t¯​Hβ†’W+​b​Wβˆ’β€‹b¯​b​bΒ―β†’4​b​4​qβ†’superscript𝑒superscript𝑒𝑑¯𝑑𝐻→superscriptπ‘Šπ‘superscriptπ‘ŠΒ―π‘π‘Β―π‘β†’4𝑏4π‘že^{+}e^{-}\rightarrow t\overline{t}H\rightarrow W^{+}bW^{-}\overline{b}b\overline{b}\rightarrow 4b4q.

This channel is thus characterized by 4 b-jets and 4 light quark jets. It benefits from the highest branching ratio. However the environnement is still more crowded than in the semileptonic channel and the event reconstruction will be quite affected. Notice that, here, the semileptonic channel (t​t¯​Hβ†’4​b​2​q​l​ν→𝑑¯𝑑𝐻4𝑏2π‘žπ‘™πœˆt\overline{t}H\rightarrow 4b2ql\nu), the fully leptonic channel (t​t¯​Hβ†’4​b​2​l​2​ν→𝑑¯𝑑𝐻4𝑏2𝑙2𝜈t\overline{t}H\rightarrow 4b2l2\nu) and the channels where the Higgs boson doesn’t decay into b quarks act as background processes.

5.3.2 Sequential analysis

We first require:

  • β€’

    Total visible mass β‰₯\geq 560 GeV/c2.

  • β€’

    Total multiplicity β‰₯\geq 120.

  • β€’

    Number of jets (including possible isolated leptons; JADE algorithm with yc​u​t=1.10βˆ’3subscript𝑦𝑐𝑒𝑑superscript1.103y_{cut}=1.10^{-3}) β‰₯\geq 7.

  • β€’

    Thrust ≀\leq 0.85.

The events satisfying these requirements are forced in a 8 jet configuration (using JADE) and a second set of criteria is then applied:

  • β€’

    Minimum jet multiplicity >> 1.

  • β€’

    Minimum dijet invariant mass β‰₯\geq 15 GeV/c2.

  • β€’

    Em​i​nj​e​tsubscriptsuperscriptπΈπ‘—π‘’π‘‘π‘šπ‘–π‘›E^{jet}_{min} β‰₯\geq 20 GeV.

All these distributions are shown in figureΒ 10. The overall preselection efficiencies and the corresponding effective cross-sections are shown in tableΒ 9. The remarks made on the residual background in the semileptonic channel (see section 5.2.2) apply here as well.

Final state MHsubscript𝑀𝐻M_{H} GeV/c2 Ο΅p​r​e​s​e​lsubscriptitalic-Ο΅π‘π‘Ÿπ‘’π‘ π‘’π‘™\epsilon_{presel} (%percent\%) Οƒe​f​f​(f​b)subscriptπœŽπ‘’π‘“π‘“π‘“π‘\sigma_{eff}(fb)
t​t¯​Hβ†’4​b​4​q→𝑑¯𝑑𝐻4𝑏4π‘žt\overline{t}H\rightarrow 4b4q 120 63.263.263.2 4.85β‹…10βˆ’1β‹…absentsuperscript101\cdot 10^{-1}
t​t¯​Hβ†’4​b​4​q→𝑑¯𝑑𝐻4𝑏4π‘žt\overline{t}H\rightarrow 4b4q 130 64.064.064.0 3.26β‹…10βˆ’1β‹…absentsuperscript101\cdot 10^{-1}
t​t¯​Hβ†’4​b​4​q→𝑑¯𝑑𝐻4𝑏4π‘žt\overline{t}H\rightarrow 4b4q 140 64.364.364.3 1.81β‹…10βˆ’1β‹…absentsuperscript101\cdot 10^{-1}
t​t¯​Hβ†’4​b​4​q→𝑑¯𝑑𝐻4𝑏4π‘žt\overline{t}H\rightarrow 4b4q 150 64.664.664.6 7.84β‹…10βˆ’2β‹…absentsuperscript102\cdot 10^{-2}
t​t¯𝑑¯𝑑t\overline{t} - 7.377.377.37 21.9
t​t¯​Z𝑑¯𝑑𝑍t\overline{t}Z - 22.822.822.8 9.74β‹…10βˆ’1β‹…absentsuperscript101\cdot 10^{-1}
W​Wπ‘Šπ‘ŠWW - 1.10β‹…10βˆ’1β‹…absentsuperscript101\cdot 10^{-1} 4.74
Z​Z𝑍𝑍ZZ - 2.56β‹…10βˆ’1β‹…absentsuperscript101\cdot 10^{-1} 6.14β‹…10βˆ’1β‹…absentsuperscript101\cdot 10^{-1}
q​qΒ―π‘žΒ―π‘žq\overline{q} - 6.93β‹…10βˆ’2β‹…6.93superscript1026.93\cdot 10^{-2} 1.08
t​t¯​Hβ†’4​b​2​q​l​ν→𝑑¯𝑑𝐻4𝑏2π‘žπ‘™πœˆt\overline{t}H\rightarrow 4b2ql\nu 120 14.114.114.1 1.04β‹…10βˆ’1β‹…absentsuperscript101\cdot 10^{-1}
t​t¯​Hβ†’4​b​2​q​l​ν→𝑑¯𝑑𝐻4𝑏2π‘žπ‘™πœˆt\overline{t}H\rightarrow 4b2ql\nu 130 14.714.714.7 7.20β‹…10βˆ’2β‹…absentsuperscript102\cdot 10^{-2}
t​t¯​Hβ†’4​b​2​q​l​ν→𝑑¯𝑑𝐻4𝑏2π‘žπ‘™πœˆt\overline{t}H\rightarrow 4b2ql\nu 140 16.016.016.0 4.32β‹…10βˆ’2β‹…absentsuperscript102\cdot 10^{-2}
t​t¯​Hβ†’4​b​2​q​l​ν→𝑑¯𝑑𝐻4𝑏2π‘žπ‘™πœˆt\overline{t}H\rightarrow 4b2ql\nu 150 16.416.416.4 1.91β‹…10βˆ’2β‹…absentsuperscript102\cdot 10^{-2}
t​t¯​Hβ†’4​b​2​l​2​ν→𝑑¯𝑑𝐻4𝑏2𝑙2𝜈t\overline{t}H\rightarrow 4b2l2\nu 120 3.603.603.60β‹…10βˆ’1β‹…absentsuperscript101\cdot 10^{-1} 6.66β‹…10βˆ’4β‹…absentsuperscript104\cdot 10^{-4}
t​t¯​Hβ†’4​b​2​l​2​ν→𝑑¯𝑑𝐻4𝑏2𝑙2𝜈t\overline{t}H\rightarrow 4b2l2\nu 130 3.603.603.60β‹…10βˆ’1β‹…absentsuperscript101\cdot 10^{-1} 4.42β‹…10βˆ’4β‹…absentsuperscript104\cdot 10^{-4}
t​t¯​Hβ†’4​b​2​l​2​ν→𝑑¯𝑑𝐻4𝑏2𝑙2𝜈t\overline{t}H\rightarrow 4b2l2\nu 140 5.205.205.20β‹…10βˆ’1β‹…absentsuperscript101\cdot 10^{-1} 3.52β‹…10βˆ’4β‹…absentsuperscript104\cdot 10^{-4}
t​t¯​Hβ†’4​b​2​l​2​ν→𝑑¯𝑑𝐻4𝑏2𝑙2𝜈t\overline{t}H\rightarrow 4b2l2\nu 150 6.856.856.85β‹…10βˆ’1β‹…absentsuperscript101\cdot 10^{-1} 2.00β‹…10βˆ’4β‹…absentsuperscript104\cdot 10^{-4}
t​t¯​H​(H↛2​b)𝑑¯𝑑𝐻↛𝐻2𝑏t\overline{t}H(H\nrightarrow 2b) 120 26.426.426.4 2.16β‹…10βˆ’1β‹…absentsuperscript101\cdot 10^{-1}
t​t¯​H​(H↛2​b)𝑑¯𝑑𝐻↛𝐻2𝑏t\overline{t}H(H\nrightarrow 2b) 130 29.529.529.5 3.14β‹…10βˆ’1β‹…absentsuperscript101\cdot 10^{-1}
t​t¯​H​(H↛2​b)𝑑¯𝑑𝐻↛𝐻2𝑏t\overline{t}H(H\nrightarrow 2b) 140 30.630.630.6 3.85β‹…10βˆ’1β‹…absentsuperscript101\cdot 10^{-1}
t​t¯​H​(H↛2​b)𝑑¯𝑑𝐻↛𝐻2𝑏t\overline{t}H(H\nrightarrow 2b) 150 31.931.931.9 4.39β‹…10βˆ’1β‹…absentsuperscript101\cdot 10^{-1}
Total background 120 4.46β‹…10βˆ’1β‹…4.46superscript1014.46\cdot 10^{-1} 28.6
Total background 130 4.47β‹…10βˆ’1β‹…4.47superscript1014.47\cdot 10^{-1} 28.6
Total background 140 4.48β‹…10βˆ’1β‹…4.48superscript1014.48\cdot 10^{-1} 28.7
Total background 150 4.49β‹…10βˆ’1β‹…4.49superscript1014.49\cdot 10^{-1} 28.7
Table 9: The Hβ†’b​b¯→𝐻𝑏¯𝑏H\rightarrow b\overline{b} hadronic channel: preselection efficiencies (Ο΅p​r​e​s​e​lsubscriptitalic-Ο΅π‘π‘Ÿπ‘’π‘ π‘’π‘™\epsilon_{presel}) and corresponding effective cross-sections (Οƒe​f​fsubscriptπœŽπ‘’π‘“π‘“\sigma_{eff}) for various Higgs boson masses. The 4 top lines stand for the selected signal final state, while the next lines break down the different background components (including those due to t​t¯​H𝑑¯𝑑𝐻t\overline{t}H events with another Higgs decay channel)

5.3.3 Neural network analysis

We then train a neural network to use the information contained in the distributions in a more powerful way. The variables used are:

  • β€’

    The total visible mass.

  • β€’

    The number of jets (including possible isolated leptons; JADE algorithm with yc​u​t=1.10βˆ’3subscript𝑦𝑐𝑒𝑑superscript1.103y_{cut}=1.10^{-3}).

  • β€’

    The thrust.

  • β€’

    The aplanarity.

  • β€’

    The light jet mass.

  • β€’

    The heavy jet mass.

  • β€’

    The second Fox-Wolfram moment h20.

  • β€’

    βˆ‘i=14Pbj​e​t​(i)superscriptsubscript𝑖14subscriptsuperscript𝑃𝑗𝑒𝑑𝑏𝑖\sum_{i=1}^{4}P^{jet}_{b}(i).

  • β€’

    Em​a​xj​e​tβˆ’Em​i​nj​e​tsubscriptsuperscriptπΈπ‘—π‘’π‘‘π‘šπ‘Žπ‘₯subscriptsuperscriptπΈπ‘—π‘’π‘‘π‘šπ‘–π‘›E^{jet}_{max}-E^{jet}_{min}.

Em​a​x​(m​i​n)j​e​tsubscriptsuperscriptπΈπ‘—π‘’π‘‘π‘šπ‘Žπ‘₯π‘šπ‘–π‘›E^{jet}_{max(min)} and the Pbj​e​t​(i)subscriptsuperscript𝑃𝑗𝑒𝑑𝑏𝑖P^{jet}_{b}(i) are calculated once the event is forced into 8 jets. The distributions of these variables (after the preselection) are shown in figuresΒ 11 andΒ 12.

5.3.4 Results

The result of the training is shown in figureΒ 13. We apply the same procedure as for the semileptonic channel (see section 5.2.4). An example of the values of the selection efficiencies and of the corresponding effective cross-sections is shown in tableΒ 10. As for the semileptonic channel, the main background is due to top pair production. The resolutions on gt​t​Hsubscript𝑔𝑑𝑑𝐻g_{ttH} are shown in tableΒ 11 and on figure 4. They range from 8.3% (10.1%) to 42.7% (51.2%) for Δ​σB​Ge​f​fΟƒB​Ge​f​f=5%Ξ”superscriptsubscriptπœŽπ΅πΊπ‘’π‘“π‘“superscriptsubscriptπœŽπ΅πΊπ‘’π‘“π‘“percent5\frac{\Delta\sigma_{BG}^{eff}}{\sigma_{BG}^{eff}}=5\% (10%). As in the case of the semileptonic channel, the resolution degrades with increasing mass due to the reduction of the statistics of the signal.

Final state Ο΅s​e​lsubscriptitalic-ϡ𝑠𝑒𝑙\epsilon_{sel} (%percent\%) Οƒe​f​f​(f​b)subscriptπœŽπ‘’π‘“π‘“π‘“π‘\sigma_{eff}(fb)
t​t¯​Hβ†’4​b​4​q→𝑑¯𝑑𝐻4𝑏4π‘žt\overline{t}H\rightarrow 4b4q 14.814.814.8 1.14β‹…10βˆ’1β‹…absentsuperscript101\cdot 10^{-1}
t​t¯𝑑¯𝑑t\overline{t} 3.10β‹…10βˆ’2β‹…3.10superscript1023.10\cdot 10^{-2} 9.29β‹…10βˆ’2β‹…absentsuperscript102\cdot 10^{-2}
t​t¯​Z𝑑¯𝑑𝑍t\overline{t}Z 1.111.111.11 4.74β‹…10βˆ’2β‹…absentsuperscript102\cdot 10^{-2}
W​Wπ‘Šπ‘ŠWW <3.7β‹…10βˆ’5absentβ‹…3.7superscript105<3.7\cdot 10^{-5} <1.6β‹…10βˆ’3absentβ‹…1.6superscript103<1.6\cdot 10^{-3}
Z​Z𝑍𝑍ZZ 8.71β‹…10βˆ’4β‹…8.71superscript1048.71\cdot 10^{-4} 2.08β‹…10βˆ’3β‹…absentsuperscript103\cdot 10^{-3}
q​qΒ―π‘žΒ―π‘žq\overline{q} <10βˆ’4absentsuperscript104<10^{-4} <1.6β‹…10βˆ’3absentβ‹…1.6superscript103<1.6\cdot 10^{-3}
t​t¯​Hβ†’4​b​2​q​l​ν→𝑑¯𝑑𝐻4𝑏2π‘žπ‘™πœˆt\overline{t}H\rightarrow 4b2ql\nu 2.442.442.44 1.80β‹…10βˆ’2β‹…absentsuperscript102\cdot 10^{-2}
t​t¯​Hβ†’4​b​2​l​2​ν→𝑑¯𝑑𝐻4𝑏2𝑙2𝜈t\overline{t}H\rightarrow 4b2l2\nu 3.14β‹…10βˆ’2β‹…3.14superscript1023.14\cdot 10^{-2} 5.55β‹…10βˆ’5β‹…absentsuperscript105\cdot 10^{-5}
t​t¯​H​(H↛2​b)𝑑¯𝑑𝐻↛𝐻2𝑏t\overline{t}H(H\nrightarrow 2b) 7.9β‹…10βˆ’1β‹…absentsuperscript101\cdot 10^{-1} 6.47β‹…10βˆ’3β‹…absentsuperscript103\cdot 10^{-3}
Total background 2.61β‹…10βˆ’3β‹…2.61superscript1032.61\cdot 10^{-3} 1.67β‹…10βˆ’1β‹…absentsuperscript101\cdot 10^{-1}
Table 10: The Hβ†’b​b¯→𝐻𝑏¯𝑏H\rightarrow b\overline{b} hadronic channel: selection efficiencies (Ο΅s​e​lsubscriptitalic-ϡ𝑠𝑒𝑙\epsilon_{sel}) and corresponding effective cross-sections (Οƒe​f​fsubscriptπœŽπ‘’π‘“π‘“\sigma_{eff}) for Δ​σB​Ge​f​fΟƒB​Ge​f​fΞ”superscriptsubscriptπœŽπ΅πΊπ‘’π‘“π‘“superscriptsubscriptπœŽπ΅πΊπ‘’π‘“π‘“\frac{\Delta\sigma_{BG}^{eff}}{\sigma_{BG}^{eff}} = 5%percent55\% and MH=120subscript𝑀𝐻120M_{H}=120 GeV/c2.
MHsubscript𝑀𝐻M_{H} (GeV/c2) Δ​σB​Ge​f​fΟƒB​Ge​f​fΞ”superscriptsubscriptπœŽπ΅πΊπ‘’π‘“π‘“superscriptsubscriptπœŽπ΅πΊπ‘’π‘“π‘“\frac{\Delta\sigma_{BG}^{eff}}{\sigma_{BG}^{eff}} Ο΅s​e​ls​i​g​n​a​lsuperscriptsubscriptitalic-Ο΅π‘ π‘’π‘™π‘ π‘–π‘”π‘›π‘Žπ‘™\epsilon_{sel}^{signal} ρs​e​ls​a​m​p​l​esuperscriptsubscriptπœŒπ‘ π‘’π‘™π‘ π‘Žπ‘šπ‘π‘™π‘’\rho_{sel}^{sample} (Δ​gt​t​Hgt​t​H)s​t​a​tsubscriptΞ”subscript𝑔𝑑𝑑𝐻subscriptπ‘”π‘‘π‘‘π»π‘ π‘‘π‘Žπ‘‘\big{(}\frac{\Delta g_{ttH}}{g_{ttH}}\big{)}_{stat} (Δ​gt​t​Hgt​t​H)s​y​s​tsubscriptΞ”subscript𝑔𝑑𝑑𝐻subscript𝑔𝑑𝑑𝐻𝑠𝑦𝑠𝑑\big{(}\frac{\Delta g_{ttH}}{g_{ttH}}\big{)}_{syst} Δ​gt​t​Hgt​t​HΞ”subscript𝑔𝑑𝑑𝐻subscript𝑔𝑑𝑑𝐻\frac{\Delta g_{ttH}}{g_{ttH}}
120 5%percent55\% 14.8%percent14.814.8\% 40.5%percent40.540.5\% 7.4%percent7.47.4\% 3.7%percent3.73.7\% 8.3%percent8.38.3\%
10%percent1010\% 12.0%percent12.012.0\% 44.7%percent44.744.7\% 7.9%percent7.97.9\% 6.3%percent6.36.3\% 10.1%percent10.110.1\%
130 5%percent55\% 15.6%percent15.615.6\% 27.5%percent27.527.5\% 10.8%percent10.810.8\% 6.7%percent6.76.7\% 12.7%percent12.712.7\%
10%percent1010\% 9.5%percent9.59.5\% 35.5%percent35.535.5\% 12.2%percent12.212.2\% 9.2%percent9.29.2\% 15.3%percent15.315.3\%
140 5%percent55\% 13.7%percent13.713.7\% 19.9%percent19.919.9\% 18.3%percent18.318.3\% 10.2%percent10.210.2\% 20.9%percent20.920.9\%
10%percent1010\% 8.9%percent8.98.9\% 23.7%percent23.723.7\% 20.7%percent20.720.7\% 16.3%percent16.316.3\% 26.4%percent26.426.4\%
150 5%percent55\% 12.4%percent12.412.4\% 11.7%percent11.711.7\% 38.2%percent38.238.2\% 19.1%percent19.119.1\% 42.7%percent42.742.7\%
10%percent1010\% 8.8%percent8.88.8\% 14.2%percent14.214.2\% 41.1%percent41.141.1\% 30.5%percent30.530.5\% 51.2%percent51.251.2\%
Table 11: The Hβ†’b​b¯→𝐻𝑏¯𝑏H\rightarrow b\overline{b} hadronic channel: expected uncertainty on the measurement of gt​t​Hsubscript𝑔𝑑𝑑𝐻g_{ttH} for various Higgs boson masses. Selection efficiency of the signal (Ο΅s​e​ls​i​g​n​a​lsuperscriptsubscriptitalic-Ο΅π‘ π‘’π‘™π‘ π‘–π‘”π‘›π‘Žπ‘™\epsilon_{sel}^{signal}) and purity of the selected sample (ρs​e​ls​a​m​p​l​esuperscriptsubscriptπœŒπ‘ π‘’π‘™π‘ π‘Žπ‘šπ‘π‘™π‘’\rho_{sel}^{sample}) are also shown.

5.3.5 Precision loss due to 6 fermion processes

The 6 fermion processes which may degrade the resolution on gt​t​Hsubscript𝑔𝑑𝑑𝐻g_{ttH} in this channel are the same as in the Hβ†’b​b¯→𝐻𝑏¯𝑏H\rightarrow b\overline{b} semileptonic channel and they were also studied for MH=120subscript𝑀𝐻120M_{H}=120 GeV/c2. Their cross sections and selection efficiencies are shown in table 12. The precisions obtained on gt​t​Hsubscript𝑔𝑑𝑑𝐻g_{ttH} when the 6 fermion background is included are shown in tableΒ 13. As in the semileptonic channel, the degradation of the measurement due to the 6 fermion background is negligible.

Final state σ​(f​b)πœŽπ‘“π‘\sigma(fb) Ο΅s​e​lsubscriptitalic-ϡ𝑠𝑒𝑙\epsilon_{sel}
b​b¯​b​b¯​b​b¯𝑏¯𝑏𝑏¯𝑏𝑏¯𝑏b\overline{b}b\overline{b}b\overline{b} 6.4β‹…10βˆ’3β‹…6.4superscript1036.4\cdot 10^{-3} 5.8%percent5.85.8\%
b​b¯​b​b¯​q​qΒ―π‘Β―π‘π‘Β―π‘π‘žΒ―π‘žb\overline{b}b\overline{b}q\overline{q} (q=u,d)π‘žπ‘’π‘‘(q=u,d) 1.2β‹…10βˆ’1β‹…1.2superscript1011.2\cdot 10^{-1} 1.6%percent1.61.6\%
b​b¯​b​b¯​s​s¯𝑏¯𝑏𝑏¯𝑏𝑠¯𝑠b\overline{b}b\overline{b}s\overline{s} 6.3β‹…10βˆ’2β‹…6.3superscript1026.3\cdot 10^{-2} 1.8%percent1.81.8\%
b​b¯​b​b¯​c​c¯𝑏¯𝑏𝑏¯𝑏𝑐¯𝑐b\overline{b}b\overline{b}c\overline{c} 5.1β‹…10βˆ’2β‹…5.1superscript1025.1\cdot 10^{-2} 2.0%percent2.02.0\%
b​b¯​b​b¯​t​t¯𝑏¯𝑏𝑏¯𝑏𝑑¯𝑑b\overline{b}b\overline{b}t\overline{t} 6.9β‹…10βˆ’3β‹…6.9superscript1036.9\cdot 10^{-3} 31.8%percent31.831.8\%
b​b¯​q​q¯​t​tΒ―π‘Β―π‘π‘žΒ―π‘žπ‘‘Β―π‘‘b\overline{b}q\overline{q}t\overline{t} (q=u,d,s)π‘žπ‘’π‘‘π‘ (q=u,d,s) 8.9β‹…10βˆ’3β‹…8.9superscript1038.9\cdot 10^{-3} 12.5%percent12.512.5\%
b​b¯​c​c¯​t​t¯𝑏¯𝑏𝑐¯𝑐𝑑¯𝑑b\overline{b}c\overline{c}t\overline{t} 3.5β‹…10βˆ’3β‹…3.5superscript1033.5\cdot 10^{-3} 17.2%percent17.217.2\%
b​b¯​t​b¯​d​u¯𝑏¯𝑏𝑑¯𝑏𝑑¯𝑒b\overline{b}t\overline{b}d\overline{u} βˆ— ∼1β‹…10βˆ’2similar-toabsentβ‹…1superscript102\sim 1\cdot 10^{-2} 14.0%percent14.014.0\%
b​b¯​t​bΒ―β€‹ΞΌβ€‹Ξ½Β―π‘Β―π‘π‘‘Β―π‘πœ‡Β―πœˆb\overline{b}t\overline{b}\mu\overline{\nu} βˆ— ∼3β‹…10βˆ’3similar-toabsentβ‹…3superscript103\sim 3\cdot 10^{-3} 1.2%percent1.21.2\%
Table 12: The Hβ†’b​b¯→𝐻𝑏¯𝑏H\rightarrow b\overline{b} hadronic channel: cross section (ΟƒπœŽ\sigma) and selection efficiencies (Ο΅s​e​lsubscriptitalic-ϡ𝑠𝑒𝑙\epsilon_{sel}) of the 6 fermion processes for Δ​σB​Ge​f​fΟƒB​Ge​f​fΞ”superscriptsubscriptπœŽπ΅πΊπ‘’π‘“π‘“superscriptsubscriptπœŽπ΅πΊπ‘’π‘“π‘“\frac{\Delta\sigma_{BG}^{eff}}{\sigma_{BG}^{eff}} = 5%percent55\% and MH=120subscript𝑀𝐻120M_{H}=120 GeV/c2. For events marked with a βˆ—, some diagrams were removed from the calculation to avoid double counting.
Δ​σB​Ge​f​fΟƒB​Ge​f​fΞ”superscriptsubscriptπœŽπ΅πΊπ‘’π‘“π‘“superscriptsubscriptπœŽπ΅πΊπ‘’π‘“π‘“\frac{\Delta\sigma_{BG}^{eff}}{\sigma_{BG}^{eff}} Δ​gt​t​Hgt​t​HΞ”subscript𝑔𝑑𝑑𝐻subscript𝑔𝑑𝑑𝐻\frac{\Delta g_{ttH}}{g_{ttH}}(without 6f) Δ​gt​t​Hgt​t​HΞ”subscript𝑔𝑑𝑑𝐻subscript𝑔𝑑𝑑𝐻\frac{\Delta g_{ttH}}{g_{ttH}}(with 6f)
5%percent55\% 8.3%percent8.38.3\% 8.5%percent8.58.5\%
10%percent1010\% 10.1%percent10.110.1\% 10.5%percent10.510.5\%
Table 13: The Hβ†’b​b¯→𝐻𝑏¯𝑏H\rightarrow b\overline{b} hadronic channel: expected uncertainty on the measurement of gt​t​Hsubscript𝑔𝑑𝑑𝐻g_{ttH} without and with inclusion of the 6 fermion processes in the analysis for MH=120subscript𝑀𝐻120M_{H}=120 GeV/c2.

6 Study of the Hβ†’W+​Wβˆ’β†’π»superscriptπ‘Šsuperscriptπ‘ŠH\rightarrow W^{+}W^{-} decay mode

6.1 Introduction

As we can see from the previous section, the measurement of gt​t​Hsubscript𝑔𝑑𝑑𝐻g_{ttH} in the Hβ†’b​b¯→𝐻𝑏¯𝑏H\rightarrow b\overline{b} decay mode degrades quite rapidly as the Higgs boson mass increases. The reasons are the drop of the cross-section and even more, the decrease of the branching ratio of the Higgs boson into b​b¯𝑏¯𝑏b\overline{b} for the benefit of the Hβ†’W+​Wβˆ’β†’π»superscriptπ‘Šsuperscriptπ‘ŠH\rightarrow W^{+}W^{-} decay. We will thus try to exploit this latter mode when the Higgs boson is heavier than 140 GeV/c2, and see whether it also improves the accuracy on gt​t​Hsubscript𝑔𝑑𝑑𝐻g_{ttH} for lighter Higgs boson masses.

In this decay mode, four intermediate W bosons are present, leading to several classes of final states. Unlike the final states where the Higgs boson decays into a pair of b-quarks, there are only two b-jets in the event, thus the b-tagging is no longer an essential point of the analysis. Therefore, particular final states have to be identified which can allow good signal and background separation and which have enough statistics. Two such channels were found: the β€œ2 like sign lepton plus 6 jet channel”, when two W bosons of the same sign decay leptonically whereas the two remaining ones decay hadronically, and the β€œsingle lepton plus 8 jet channel” when only one of the W’s decays leptonically. As for channels where the Higgs boson decays into pairs of b-quarks, these final states have large particle and jet multiplicities, an isotropic topology and a tiny event rate. For each channel, the same analysis will be repeated for 4 values of the Higgs boson mass within the range 130 GeV/c2 - 200 GeV/c2.

6.2 The 2 like sign lepton plus 6 jet channel

6.2.1 Introduction

The final state follows from the process:
e+​eβˆ’β†’t​t¯​Hβ†’W+​b​Wβˆ’β€‹b¯​W+​Wβˆ’β†’2​l±​2​ν​2​b​4​qβ†’superscript𝑒superscript𝑒𝑑¯𝑑𝐻→superscriptπ‘Šπ‘superscriptπ‘ŠΒ―π‘superscriptπ‘Šsuperscriptπ‘Šβ†’2superscript𝑙plus-or-minus2𝜈2𝑏4π‘že^{+}e^{-}\rightarrow t\overline{t}H\rightarrow W^{+}bW^{-}\overline{b}W^{+}W^{-}\rightarrow 2l^{\pm}2\nu 2b4q

Its branching ratio is:

B​R​(t​t¯​Hβ†’2​l±​2​ν​2​b​4​q)𝐡𝑅→𝑑¯𝑑𝐻2superscript𝑙plus-or-minus2𝜈2𝑏4π‘ž\displaystyle BR(t\overline{t}H\rightarrow 2l^{\pm}2\nu 2b4q) =\displaystyle= B​R​(Hβ†’W+​Wβˆ’)𝐡𝑅→𝐻superscriptπ‘Šsuperscriptπ‘Š\displaystyle BR(H\rightarrow W^{+}W^{-})
βˆ—B​R​(W±​WΒ±β†’4​q)βˆ—B​R​(W±​WΒ±β†’2​l​2​ν)βˆ—2absent𝐡𝑅→superscriptπ‘Šplus-or-minussuperscriptπ‘Šplus-or-minus4π‘žπ΅π‘…β†’superscriptπ‘Šplus-or-minussuperscriptπ‘Šplus-or-minus2𝑙2𝜈2\displaystyle*BR(W^{\pm}W^{\pm}\rightarrow 4q)*BR(W^{\pm}W^{\pm}\rightarrow 2l2\nu)*2
β‰ˆ\displaystyle\approx 9.6%βˆ—B​R​(Hβ†’W+​Wβˆ’)percent9.6𝐡𝑅→𝐻superscriptπ‘Šsuperscriptπ‘Š\displaystyle 9.6\%*BR(H\rightarrow W^{+}W^{-})

This channel is thus characterized by a missing 4-momentum, two energetic and isolated charged leptons of the same sign, 4 light quark jets and 2 b-jets. In comparison with the case where no restriction on the charged lepton signs is made, requiring the two leptons to have the same sign divides the branching ratio of the signal by a factor 3 but the background can be very effectively suppressed.

Here, t​t¯​H​(Hβ†’W​W)↛2​l±​2​ν​2​b​4​qβ†›π‘‘Β―π‘‘π»β†’π»π‘Šπ‘Š2superscript𝑙plus-or-minus2𝜈2𝑏4π‘žt\overline{t}H(H\rightarrow WW)\nrightarrow 2l^{\pm}2\nu 2b4q and t​t¯​H​(H↛W​W)π‘‘Β―π‘‘π»β†›π»π‘Šπ‘Št\overline{t}H(H\nrightarrow WW) act as background processes. The analysis will be purely sequential, no neural network being applied.

6.2.2 Analysis

We first apply a set of criteria related to topological variables (figureΒ 14):

  • β€’

    400 GeV/c<2{}^{2}< Total visible mass << 700 GeV/c2.

  • β€’

    85 << Total multiplicity << 160.

  • β€’

    Number of jets (including possible isolated leptons; JADE algorithm with yc​u​t=1.10βˆ’3subscript𝑦𝑐𝑒𝑑superscript1.103y_{cut}=1.10^{-3}) >> 6.

  • β€’

    Light jet mass >> 100 GeV/c2.

  • β€’

    Heavy jet mass >> 150 GeV/c2.

  • β€’

    Fox-Wolfram moment h10 << 0.2.

  • β€’

    Fox-Wolfram moment h20 << 0.45.

  • β€’

    Fox-Wolfram moment h30 << 0.3.

  • β€’

    Fox-Wolfram moment h40 << 0.3.

The particles (discarding the charged leptons) of the surviving events are forced to a 6 jet configuration (using JADE) and the jets are flavour-tagged. The events are then required to fulfill the following criteria (figureΒ 14):

  • β€’

    Minimum dijet invariant mass >> 15 GeV/c2.

  • β€’

    Pbj​e​t​(1)>subscriptsuperscript𝑃𝑗𝑒𝑑𝑏1absentP^{jet}_{b}(1)> 0.2.

The request of only one b-jet allows to preserve a high selection efficiency. Now, we make use of the lepton content of the signal events to further eliminate the background. For each charged lepton reconstructed in the event, we calculate the transverse momentum with respect to the closest jet. Next, we classify the leptons from the most isolated to the least isolated according to this quantity. In the event, there should be 2 and only 2 isolated leptons. Moreover, they should have the same sign. As they come from the primary vertex, the significance of their impact parameter555For a charged track, the impact parameter is the distance of closest approach between this track and the primary vertex and the significance of the impact parameter is the ratio between the impact parameter and its estimated uncertainty. should be small in comparison with the one of a lepton coming from a b- or c-meson decay. Therefore, we require (figureΒ 15):

  • β€’

    The 2 most isolated leptons have the same sign.

  • β€’

    A ptsubscript𝑝𝑑p_{t} between the most isolated lepton and the other jets β‰₯\geq 5 GeV/c.

  • β€’

    A ptsubscript𝑝𝑑p_{t} between the second most isolated lepton and the other jets β‰₯\geq 5 GeV/c.

  • β€’

    A ptsubscript𝑝𝑑p_{t} between the third most isolated lepton and the other jets ≀\leq 5 GeV/c.

  • β€’

    -0.001 << Significance of most isolated lepton impact parameter << 0.001.

  • β€’

    -0.001 << Significance of second most isolated lepton impact parameter << 0.001.

The overall selection efficiencies and the corresponding effective cross-sections are shown in tableΒ 14. The main background is again due to top pair production. As the number of signal events is small in this channel but the purity high, the total uncertainty on gt​t​Hsubscript𝑔𝑑𝑑𝐻g_{ttH} is dominated by the statistical uncertainty. Therefore, the relative uncertainty on the residual background normalisation has only a modest influence on the total uncertainty. As a matter of fact, the procedure is not reoptimised for each value of the relative uncertainty on the residual background normalisation.

Final state Ο΅s​e​lsubscriptitalic-ϡ𝑠𝑒𝑙\epsilon_{sel} (%percent\%) Οƒe​f​f​(f​b)subscriptπœŽπ‘’π‘“π‘“π‘“π‘\sigma_{eff}(fb)
t​t¯​Hβ†’2​l±​2​ν​2​b​4​q→𝑑¯𝑑𝐻2superscript𝑙plus-or-minus2𝜈2𝑏4π‘žt\overline{t}H\rightarrow 2l^{\pm}2\nu 2b4q; MH=130subscript𝑀𝐻130M_{H}=130 GeV/c2 20.220.220.2 1.26 β‹…10βˆ’2β‹…absentsuperscript102\cdot 10^{-2}
t​t¯​Hβ†’2​l±​2​ν​2​b​4​q→𝑑¯𝑑𝐻2superscript𝑙plus-or-minus2𝜈2𝑏4π‘žt\overline{t}H\rightarrow 2l^{\pm}2\nu 2b4q; MH=150subscript𝑀𝐻150M_{H}=150 GeV/c2 24.624.624.6 2.72 β‹…10βˆ’2β‹…absentsuperscript102\cdot 10^{-2}
t​t¯​Hβ†’2​l±​2​ν​2​b​4​q→𝑑¯𝑑𝐻2superscript𝑙plus-or-minus2𝜈2𝑏4π‘žt\overline{t}H\rightarrow 2l^{\pm}2\nu 2b4q; MH=170subscript𝑀𝐻170M_{H}=170 GeV/c2 25.525.525.5 2.96 β‹…10βˆ’2β‹…absentsuperscript102\cdot 10^{-2}
t​t¯​Hβ†’2​l±​2​ν​2​b​4​q→𝑑¯𝑑𝐻2superscript𝑙plus-or-minus2𝜈2𝑏4π‘žt\overline{t}H\rightarrow 2l^{\pm}2\nu 2b4q; MH=200subscript𝑀𝐻200M_{H}=200 GeV/c2 26.326.326.3 1.47 β‹…10βˆ’2β‹…absentsuperscript102\cdot 10^{-2}
t​t¯𝑑¯𝑑t\overline{t} 4.40β‹…10βˆ’3β‹…4.40superscript1034.40\cdot 10^{-3} 1.31β‹…10βˆ’2β‹…absentsuperscript102\cdot 10^{-2}
t​t¯​Z𝑑¯𝑑𝑍t\overline{t}Z 7.33β‹…10βˆ’2β‹…absentsuperscript102\cdot 10^{-2} 3.14β‹…10βˆ’3β‹…absentsuperscript103\cdot 10^{-3}
W​Wπ‘Šπ‘ŠWW 7.41β‹…10βˆ’5β‹…7.41superscript1057.41\cdot 10^{-5} 3.18β‹…10βˆ’3β‹…absentsuperscript103\cdot 10^{-3}
Z​Z𝑍𝑍ZZ 1.02β‹…10βˆ’3β‹…1.02superscript1031.02\cdot 10^{-3} 2.44β‹…10βˆ’3β‹…absentsuperscript103\cdot 10^{-3}
q​qΒ―π‘žΒ―π‘žq\overline{q} <8.33β‹…10βˆ’5absentβ‹…8.33superscript105<8.33\cdot 10^{-5} <<1.30β‹…10βˆ’3β‹…absentsuperscript103\cdot 10^{-3}
t​t¯​H​(Hβ†’W​W)↛2​l±​2​ν​2​b​4​qβ†›π‘‘Β―π‘‘π»β†’π»π‘Šπ‘Š2superscript𝑙plus-or-minus2𝜈2𝑏4π‘žt\overline{t}H(H\rightarrow WW)\nrightarrow 2l^{\pm}2\nu 2b4q; MH=150subscript𝑀𝐻150M_{H}=150 GeV/c2 2.65β‹…10βˆ’1β‹…2.65superscript1012.65\cdot 10^{-1} 2.77β‹…10βˆ’3β‹…absentsuperscript103\cdot 10^{-3}
t​t¯​H​(H↛W​W)π‘‘Β―π‘‘π»β†›π»π‘Šπ‘Št\overline{t}H(H\nrightarrow WW); MH=150subscript𝑀𝐻150M_{H}=150 GeV/c2 8.0β‹…10βˆ’2β‹…absentsuperscript102\cdot 10^{-2} 3.94β‹…10βˆ’4β‹…absentsuperscript104\cdot 10^{-4}
Total background ; MH=150subscript𝑀𝐻150M_{H}=150 GeV/c2 3.84β‹…10βˆ’4β‹…3.84superscript1043.84\cdot 10^{-4} 2.46β‹…10βˆ’2β‹…absentsuperscript102\cdot 10^{-2}
Table 14: The two like sign lepton plus 6 jet channel: selection efficiencies (Ο΅s​e​lsubscriptitalic-ϡ𝑠𝑒𝑙\epsilon_{sel}) and corresponding effective cross-sections (Οƒe​f​fsubscriptπœŽπ‘’π‘“π‘“\sigma_{eff}) for various Higgs boson masses. The 4 top lines stand for the selected signal final state, while the next lines break down the different background components (including those due to t​t¯​H𝑑¯𝑑𝐻t\overline{t}H events with another Higgs decay channel).

6.2.3 Results

The resolutions on the measurement of gt​t​Hsubscript𝑔𝑑𝑑𝐻g_{ttH} are shown in tableΒ 15 and on figure 4. They range from 12.8% (13.4%) to 24.9% (26.3%) for Δ​σB​Ge​f​fΟƒB​Ge​f​f=5%Ξ”superscriptsubscriptπœŽπ΅πΊπ‘’π‘“π‘“superscriptsubscriptπœŽπ΅πΊπ‘’π‘“π‘“percent5\frac{\Delta\sigma_{BG}^{eff}}{\sigma_{BG}^{eff}}=5\% (10%). For the lowest values of the Higgs mass range, the resolution is not good as the branching ratio of the Higgs into pairs of W’s is very small. For MHβ‰ˆsubscript𝑀𝐻absentM_{H}\approx 170 GeV/c2, the resolution curve has a minimum which corresponds to the maximum of the branching ratio. Then, for higher mass values, the resolution degrades due to the decrease of the cross section and of the branching ratio.

MHsubscript𝑀𝐻M_{H} (GeV/c2) Δ​σB​Ge​f​fΟƒB​Ge​f​fΞ”superscriptsubscriptπœŽπ΅πΊπ‘’π‘“π‘“superscriptsubscriptπœŽπ΅πΊπ‘’π‘“π‘“\frac{\Delta\sigma_{BG}^{eff}}{\sigma_{BG}^{eff}} Ο΅s​e​ls​i​g​n​a​lsuperscriptsubscriptitalic-Ο΅π‘ π‘’π‘™π‘ π‘–π‘”π‘›π‘Žπ‘™\epsilon_{sel}^{signal} ρs​e​ls​a​m​p​l​esuperscriptsubscriptπœŒπ‘ π‘’π‘™π‘ π‘Žπ‘šπ‘π‘™π‘’\rho_{sel}^{sample} (Δ​gt​t​Hgt​t​H)s​t​a​tsubscriptΞ”subscript𝑔𝑑𝑑𝐻subscriptπ‘”π‘‘π‘‘π»π‘ π‘‘π‘Žπ‘‘\big{(}\frac{\Delta g_{ttH}}{g_{ttH}}\big{)}_{stat} (Δ​gt​t​Hgt​t​H)s​y​s​tsubscriptΞ”subscript𝑔𝑑𝑑𝐻subscript𝑔𝑑𝑑𝐻𝑠𝑦𝑠𝑑\big{(}\frac{\Delta g_{ttH}}{g_{ttH}}\big{)}_{syst} Δ​gt​t​Hgt​t​HΞ”subscript𝑔𝑑𝑑𝐻subscript𝑔𝑑𝑑𝐻\frac{\Delta g_{ttH}}{g_{ttH}}
130 5%percent55\% 20.2%percent20.220.2\% 33.9%percent33.933.9\% 24.4%percent24.424.4\% 4.9%percent4.94.9\% 24.9%percent24.924.9\%
10%percent1010\% 20.2%percent20.220.2\% 33.9%percent33.933.9\% 24.4%percent24.424.4\% 9.9%percent9.99.9\% 26.3%percent26.326.3\%
150 5%percent55\% 24.6%percent24.624.6\% 52.1%percent52.152.1\% 13.4%percent13.413.4\% 2.3%percent2.32.3\% 13.6%percent13.613.6\%
10%percent1010\% 24.6%percent24.624.6\% 52.1%percent52.152.1\% 13.4%percent13.413.4\% 4.6%percent4.64.6\% 14.2%percent14.214.2\%
170 5%percent55\% 25.5%percent25.525.5\% 54.0%percent54.054.0\% 12.7%percent12.712.7\% 2.2%percent2.22.2\% 12.8%percent12.812.8\%
10%percent1010\% 25.5%percent25.525.5\% 54.0%percent54.054.0\% 12.7%percent12.712.7\% 4.3%percent4.34.3\% 13.4%percent13.413.4\%
200 5%percent55\% 26.3%percent26.326.3\% 37.3%percent37.337.3\% 21.6%percent21.621.6\% 4.3%percent4.34.3\% 22.0%percent22.022.0\%
10%percent1010\% 26.3%percent26.326.3\% 37.3%percent37.337.3\% 21.6%percent21.621.6\% 8.5%percent8.58.5\% 23.2%percent23.223.2\%
Table 15: The two like sign lepton plus 6 jet channel: expected uncertainty on the measurement of gt​t​Hsubscript𝑔𝑑𝑑𝐻g_{ttH} for various Higgs boson masses. Selection efficiency of the signal (Ο΅s​e​ls​i​g​n​a​lsuperscriptsubscriptitalic-Ο΅π‘ π‘’π‘™π‘ π‘–π‘”π‘›π‘Žπ‘™\epsilon_{sel}^{signal}) and purity of the selected sample (ρs​e​ls​a​m​p​l​esuperscriptsubscriptπœŒπ‘ π‘’π‘™π‘ π‘Žπ‘šπ‘π‘™π‘’\rho_{sel}^{sample}) are also shown.

6.2.4 Precision loss due to 6 fermion processes

The 6 fermion processes which may degrade the resolution on gt​t​Hsubscript𝑔𝑑𝑑𝐻g_{ttH} in this channel are listed in tableΒ 16 with their cross section and selection efficiency for MH=150subscript𝑀𝐻150M_{H}=150 GeV/c2. The loss of resolution on gt​t​Hsubscript𝑔𝑑𝑑𝐻g_{ttH} when the 6 fermion background is included in the analysis is shown in tableΒ 17, showing that it may be neglected.

Final state σ​(f​b)πœŽπ‘“π‘\sigma(fb) Ο΅s​e​lsubscriptitalic-ϡ𝑠𝑒𝑙\epsilon_{sel}
b​b¯​u​d¯​eβˆ’β€‹Ξ½Β―e𝑏¯𝑏𝑒¯𝑑superscript𝑒subscriptΒ―πœˆπ‘’b\overline{b}u\overline{d}e^{-}\overline{\nu}_{e} βˆ— ∼1.5similar-toabsent1.5\sim 1.5 8.4β‹…10βˆ’3%β‹…8.4percentsuperscript1038.4\cdot 10^{-3}\%
b​b¯​t​b¯​d​u¯𝑏¯𝑏𝑑¯𝑏𝑑¯𝑒b\overline{b}t\overline{b}d\overline{u} βˆ— ∼6β‹…10βˆ’3similar-toabsentβ‹…6superscript103\sim 6\cdot 10^{-3} <0.2%absentpercent0.2<0.2\%
b​b¯​t​bΒ―β€‹ΞΌβ€‹Ξ½Β―π‘Β―π‘π‘‘Β―π‘πœ‡Β―πœˆb\overline{b}t\overline{b}\mu\overline{\nu} βˆ— ∼1.5β‹…10βˆ’3similar-toabsentβ‹…1.5superscript103\sim 1.5\cdot 10^{-3} 0.4%percent0.40.4\%
t​t¯​q​q¯​q′​qΒ―β€²π‘‘Β―π‘‘π‘žΒ―π‘žsuperscriptπ‘žβ€²superscriptΒ―π‘žβ€²t\overline{t}q\overline{q}q^{\prime}\overline{q}^{\prime} (q,qβ€²=u,d,s)formulae-sequenceπ‘žsuperscriptπ‘žβ€²π‘’π‘‘π‘ (q,q^{\prime}=u,d,s) 1.2β‹…10βˆ’2β‹…1.2superscript1021.2\cdot 10^{-2} 0.2%percent0.20.2\%
q​q¯​t​b¯​l​ν¯lπ‘žΒ―π‘žπ‘‘Β―π‘π‘™subscriptΒ―πœˆπ‘™q\overline{q}t\overline{b}l\overline{\nu}_{l} (q=u,d,s,c(q=u,d,s,c; l=eβˆ’,ΞΌβˆ’)l=e^{-},\mu^{-}) βˆ— ∼7.6β‹…10βˆ’2similar-toabsentβ‹…7.6superscript102\sim 7.6\cdot 10^{-2} 0.2%percent0.20.2\%
q​q¯​t​b¯​d​uΒ―π‘žΒ―π‘žπ‘‘Β―π‘π‘‘Β―π‘’q\overline{q}t\overline{b}d\overline{u} (q=u,d,s,c)π‘žπ‘’π‘‘π‘ π‘(q=u,d,s,c) βˆ— ∼1.3β‹…10βˆ’1similar-toabsentβ‹…1.3superscript101\sim 1.3\cdot 10^{-1} 0.05%percent0.050.05\%
Table 16: The two like sign lepton plus 6 jet channel: cross section (ΟƒπœŽ\sigma) and selection efficiencies (Ο΅s​e​lsubscriptitalic-ϡ𝑠𝑒𝑙\epsilon_{sel}) of the 6 fermion processes for Δ​σB​Ge​f​fΟƒB​Ge​f​fΞ”superscriptsubscriptπœŽπ΅πΊπ‘’π‘“π‘“superscriptsubscriptπœŽπ΅πΊπ‘’π‘“π‘“\frac{\Delta\sigma_{BG}^{eff}}{\sigma_{BG}^{eff}} = 5%percent55\% and MH=150subscript𝑀𝐻150M_{H}=150 GeV/c2. For events marked with a βˆ—, some diagrams were removed from the calculation to avoid double counting.
Δ​σB​Ge​f​fΟƒB​Ge​f​fΞ”superscriptsubscriptπœŽπ΅πΊπ‘’π‘“π‘“superscriptsubscriptπœŽπ΅πΊπ‘’π‘“π‘“\frac{\Delta\sigma_{BG}^{eff}}{\sigma_{BG}^{eff}} Δ​gt​t​Hgt​t​HΞ”subscript𝑔𝑑𝑑𝐻subscript𝑔𝑑𝑑𝐻\frac{\Delta g_{ttH}}{g_{ttH}}(without 6f) Δ​gt​t​Hgt​t​HΞ”subscript𝑔𝑑𝑑𝐻subscript𝑔𝑑𝑑𝐻\frac{\Delta g_{ttH}}{g_{ttH}}(with 6f)
5%percent55\% 13.6%percent13.613.6\% 13.9%percent13.913.9\%
10%percent1010\% 14.2%percent14.214.2\% 14.5%percent14.514.5\%
Table 17: The two like sign lepton plus 6 jet channel: expected uncertainty on the measurement of gt​t​Hsubscript𝑔𝑑𝑑𝐻g_{ttH} without and with inclusion of the 6 fermion processes in the analysis for MH=150subscript𝑀𝐻150M_{H}=150 GeV/c2.

6.3 The single lepton plus 8 jet channel

6.3.1 Introduction

The final state follows from the process:

e+​eβˆ’β†’t​t¯​Hβ†’W+​b​Wβˆ’β€‹b¯​W+​Wβˆ’β†’l​ν​2​b​6​qβ†’superscript𝑒superscript𝑒𝑑¯𝑑𝐻→superscriptπ‘Šπ‘superscriptπ‘ŠΒ―π‘superscriptπ‘Šsuperscriptπ‘Šβ†’π‘™πœˆ2𝑏6π‘že^{+}e^{-}\rightarrow t\overline{t}H\rightarrow W^{+}bW^{-}\overline{b}W^{+}W^{-}\rightarrow l\nu 2b6q

Its branching ratio is:

B​R​(t​t¯​Hβ†’l​ν​2​b​6​q)π΅π‘…β†’π‘‘Β―π‘‘π»π‘™πœˆ2𝑏6π‘ž\displaystyle BR(t\overline{t}H\rightarrow l\nu 2b6q) =\displaystyle= 4βˆ—B​R​(Hβ†’W+​Wβˆ’)βˆ—B​R​(Wβ†’l​ν)βˆ—(B​R​(Wβ†’2​q))34𝐡𝑅→𝐻superscriptπ‘Šsuperscriptπ‘Šπ΅π‘…β†’π‘Šπ‘™πœˆsuperscriptπ΅π‘…β†’π‘Š2π‘ž3\displaystyle 4*BR(H\rightarrow W^{+}W^{-})*BR(W\rightarrow l\nu)*(BR(W\rightarrow 2q))^{3}
β‰ˆ\displaystyle\approx 40%βˆ—B​R​(Hβ†’W+​Wβˆ’)percent40𝐡𝑅→𝐻superscriptπ‘Šsuperscriptπ‘Š\displaystyle 40\%*BR(H\rightarrow W^{+}W^{-})

This channel is thus characterized by a missing 4-momentum, one prompt charged lepton, 6 light quark jets and 2 b-jets. This signature is less singular than the one of the previous channel but the branching ratio is about 4 times larger. This final state is close to the one of the Hβ†’b​b¯→𝐻𝑏¯𝑏H\rightarrow b\overline{b} semileptonic channel, the analysis will thus be very similar. Notice that, here, t​t¯​H​(Hβ†’W​W)↛l​ν​2​b​6​qβ†›π‘‘Β―π‘‘π»β†’π»π‘Šπ‘Šπ‘™πœˆ2𝑏6π‘žt\overline{t}H(H\rightarrow WW)\nrightarrow l\nu 2b6q and t​t¯​H​(H↛W​W)π‘‘Β―π‘‘π»β†›π»π‘Šπ‘Št\overline{t}H(H\nrightarrow WW) act as background processes.

6.3.2 Sequential analysis

We first request the presence in the event of at least one charged lepton (a ΞΌΒ±superscriptπœ‡plus-or-minus\mu^{\pm} or a eΒ±superscript𝑒plus-or-minuse^{\pm}). Then, we require (figureΒ 16 andΒ 17):

  • β€’

    500 GeV/c2<< Total visible mass << 750 GeV/c2.

  • β€’

    Total multiplicity β‰₯\geq 110.

  • β€’

    Number of jets (including possible isolated leptons; JADE algorithm with yc​u​t=1.10βˆ’3subscript𝑦𝑐𝑒𝑑superscript1.103y_{cut}=1.10^{-3}) β‰₯\geq 8.

  • β€’

    Thrust ≀\leq 0.8

  • β€’

    Fox-Wolfram moment h10 ≀\leq 0.1.

  • β€’

    Fox-Wolfram moment h20 ≀\leq 0.5.

  • β€’

    Fox-Wolfram moment h30 ≀\leq 0.3.

  • β€’

    Fox-Wolfram moment h40 ≀\leq 0.3.

  • β€’

    Light jet mass β‰₯\geq 100 GeV/c2.

  • β€’

    Heavy jet mass β‰₯\geq 150 GeV/c2.

To identify an energetic and isolated charged lepton, we proceed as in the Hβ†’b​b¯→𝐻𝑏¯𝑏H\rightarrow b\overline{b} semileptonic channel. The only difference is that, here, to tag the lepton as well as when it has been tagged, the remaining particles are forced to a 8 jet configuration (with the JADE algorithm). Then, the jets are flavour-tagged and finally, we require (figureΒ 17):

  • β€’

    Mininum jet multiplicity β‰₯\geq 3.

  • β€’

    βˆ‘i=12Pbj​e​t​(i)β‰₯superscriptsubscript𝑖12subscriptsuperscript𝑃𝑗𝑒𝑑𝑏𝑖absent\sum_{i=1}^{2}P^{jet}_{b}(i)\geq 0.2.

The overall preselection efficiencies and the corresponding effective cross-sections are shown in tableΒ 18. The main background after this preselection comes from the t​t¯𝑑¯𝑑t\overline{t} production.

Final state Ο΅p​r​e​s​e​lsubscriptitalic-Ο΅π‘π‘Ÿπ‘’π‘ π‘’π‘™\epsilon_{presel} (%percent\%) Οƒe​f​f​(f​b)subscriptπœŽπ‘’π‘“π‘“π‘“π‘\sigma_{eff}(fb)
t​t¯​Hβ†’l​ν​2​b​6​qβ†’π‘‘Β―π‘‘π»π‘™πœˆ2𝑏6π‘žt\overline{t}H\rightarrow l\nu 2b6q; MH=130subscript𝑀𝐻130M_{H}=130 GeV/c2 50.350.350.3 1.31β‹…10βˆ’1β‹…absentsuperscript101\cdot 10^{-1}
t​t¯​Hβ†’l​ν​2​b​6​qβ†’π‘‘Β―π‘‘π»π‘™πœˆ2𝑏6π‘žt\overline{t}H\rightarrow l\nu 2b6q; MH=150subscript𝑀𝐻150M_{H}=150 GeV/c2 55.655.655.6 2.57β‹…10βˆ’1β‹…absentsuperscript101\cdot 10^{-1}
t​t¯​Hβ†’l​ν​2​b​6​qβ†’π‘‘Β―π‘‘π»π‘™πœˆ2𝑏6π‘žt\overline{t}H\rightarrow l\nu 2b6q; MH=170subscript𝑀𝐻170M_{H}=170 GeV/c2 58.358.358.3 2.83β‹…10βˆ’1β‹…absentsuperscript101\cdot 10^{-1}
t​t¯​Hβ†’l​ν​2​b​6​qβ†’π‘‘Β―π‘‘π»π‘™πœˆ2𝑏6π‘žt\overline{t}H\rightarrow l\nu 2b6q; MH=200subscript𝑀𝐻200M_{H}=200 GeV/c2 60.860.860.8 1.42β‹…10βˆ’1β‹…absentsuperscript101\cdot 10^{-1}
t​t¯𝑑¯𝑑t\overline{t} 2.762.762.76 8.22
t​t¯​Z𝑑¯𝑑𝑍t\overline{t}Z 13.813.813.8 5.91β‹…10βˆ’1β‹…absentsuperscript101\cdot 10^{-1}
W​Wπ‘Šπ‘ŠWW 1.73β‹…10βˆ’2β‹…absentsuperscript102\cdot 10^{-2} 7.45β‹…10βˆ’1β‹…absentsuperscript101\cdot 10^{-1}
Z​Z𝑍𝑍ZZ 6.55β‹…10βˆ’2β‹…absentsuperscript102\cdot 10^{-2} 1.60β‹…10βˆ’1β‹…absentsuperscript101\cdot 10^{-1}
q​qΒ―π‘žΒ―π‘žq\overline{q} 2.33β‹…10βˆ’3β‹…2.33superscript1032.33\cdot 10^{-3} 3.63β‹…10βˆ’2β‹…absentsuperscript102\cdot 10^{-2}
t​t¯​H​(Hβ†’W​W)↛l​ν​2​b​6​qβ†›π‘‘Β―π‘‘π»β†’π»π‘Šπ‘Šπ‘™πœˆ2𝑏6π‘žt\overline{t}H(H\rightarrow WW)\nrightarrow l\nu 2b6q; MH=150subscript𝑀𝐻150M_{H}=150 GeV/c2 18.918.918.9 1.31β‹…10βˆ’1β‹…absentsuperscript101\cdot 10^{-1}
t​t¯​H​(H↛W​W)π‘‘Β―π‘‘π»β†›π»π‘Šπ‘Št\overline{t}H(H\nrightarrow WW); MH=150subscript𝑀𝐻150M_{H}=150 GeV/c2 26.526.526.5 1.30β‹…10βˆ’1β‹…absentsuperscript101\cdot 10^{-1}
Total background; MH=150subscript𝑀𝐻150M_{H}=150 GeV/c2 1.54β‹…10βˆ’1β‹…1.54superscript1011.54\cdot 10^{-1} 10.0
Table 18: The single lepton plus 8 jet channel: preselection efficiencies (Ο΅p​r​e​s​e​lsubscriptitalic-Ο΅π‘π‘Ÿπ‘’π‘ π‘’π‘™\epsilon_{presel}) and corresponding effective cross-sections (Οƒe​f​fsubscriptπœŽπ‘’π‘“π‘“\sigma_{eff}) for various Higgs boson masses. The 4 top lines stand for the selected signal final state, while the next lines break down the different background components (including those due to t​t¯​H𝑑¯𝑑𝐻t\overline{t}H events with another Higgs decay channel)

6.3.3 Neural network analysis

The distributions of some of the preselection variables still contain unused information. They are recycled to train a neural network together with other variables related to b-tagging, to the prompt lepton and to the missing momentum.

The complete list of variables used in the network is (figureΒ 18 andΒ 19):

  • β€’

    The total visible mass.

  • β€’

    The number of jets (including possible isolated leptons; JADE algorithm with yc​u​t=1.10βˆ’3subscript𝑦𝑐𝑒𝑑superscript1.103y_{cut}=1.10^{-3}).

  • β€’

    The thrust.

  • β€’

    The aplanarity.

  • β€’

    The energy of the tagged lepton.

  • β€’

    The invariant mass of the system made of the lepton and the missing momentum.

  • β€’

    The cosine of the angle between the tagged lepton and the closest jet directions.

  • β€’

    Em​a​xj​e​tβˆ’Em​i​nj​e​tsubscriptsuperscriptπΈπ‘—π‘’π‘‘π‘šπ‘Žπ‘₯subscriptsuperscriptπΈπ‘—π‘’π‘‘π‘šπ‘–π‘›E^{jet}_{max}-E^{jet}_{min}.

  • β€’

    Maximum dijet invariant massβˆ’-minimum dijet invariant mass.

  • β€’

    The second Fox-Wolfram moment h20.

  • β€’

    The light jet mass.

  • β€’

    The heavy jet mass.

The lepton related variables are calculated once the event has been forced to the 1 lepton plus 8 jet configuration, as well as the variables Em​a​xj​e​tsubscriptsuperscriptπΈπ‘—π‘’π‘‘π‘šπ‘Žπ‘₯E^{jet}_{max}, Em​i​nj​e​tsubscriptsuperscriptπΈπ‘—π‘’π‘‘π‘šπ‘–π‘›E^{jet}_{min}, maximum dijet invariant mass and minimum dijet invariant mass.

6.3.4 Results

Final state Ο΅s​e​lsubscriptitalic-ϡ𝑠𝑒𝑙\epsilon_{sel} (%percent\%) Οƒe​f​f​(f​b)subscriptπœŽπ‘’π‘“π‘“π‘“π‘\sigma_{eff}(fb)
t​t¯​Hβ†’l​ν​2​b​6​qβ†’π‘‘Β―π‘‘π»π‘™πœˆ2𝑏6π‘žt\overline{t}H\rightarrow l\nu 2b6q 16.716.716.7 7.71β‹…10βˆ’2β‹…absentsuperscript102\cdot 10^{-2}
t​t¯𝑑¯𝑑t\overline{t} 5.65β‹…10βˆ’2β‹…absentsuperscript102\cdot 10^{-2} 1.68β‹…10βˆ’1β‹…absentsuperscript101\cdot 10^{-1}
t​t¯​Z𝑑¯𝑑𝑍t\overline{t}Z 4.77β‹…10βˆ’1β‹…absentsuperscript101\cdot 10^{-1} 2.04β‹…10βˆ’2β‹…absentsuperscript102\cdot 10^{-2}
W​Wπ‘Šπ‘ŠWW 1.48β‹…10βˆ’4β‹…1.48superscript1041.48\cdot 10^{-4} 6.37β‹…10βˆ’3β‹…absentsuperscript103\cdot 10^{-3}
Z​Z𝑍𝑍ZZ 3.02β‹…10βˆ’3β‹…3.02superscript1033.02\cdot 10^{-3} 7.25β‹…10βˆ’3β‹…absentsuperscript103\cdot 10^{-3}
q​qΒ―π‘žΒ―π‘žq\overline{q} <10βˆ’4absentsuperscript104<10^{-4} <1.6β‹…10βˆ’3absentβ‹…1.6superscript103<1.6\cdot 10^{-3}
t​t¯​H​(Hβ†’W​W)↛l​ν​2​b​6​qβ†›π‘‘Β―π‘‘π»β†’π»π‘Šπ‘Šπ‘™πœˆ2𝑏6π‘žt\overline{t}H(H\rightarrow WW)\nrightarrow l\nu 2b6q 1.241.241.24 8.59β‹…10βˆ’3β‹…absentsuperscript103\cdot 10^{-3}
t​t¯​H​(H↛W​W)π‘‘Β―π‘‘π»β†›π»π‘Šπ‘Št\overline{t}H(H\nrightarrow WW) 2.352.352.35 1.16β‹…10βˆ’2β‹…absentsuperscript102\cdot 10^{-2}
Total background 3.30β‹…10βˆ’3β‹…3.30superscript1033.30\cdot 10^{-3} 2.22β‹…10βˆ’1β‹…absentsuperscript101\cdot 10^{-1}
Table 19: The single lepton plus 8 jet channel: selection efficiencies (Ο΅s​e​lsubscriptitalic-ϡ𝑠𝑒𝑙\epsilon_{sel}) and corresponding effective cross-sections (Οƒe​f​fsubscriptπœŽπ‘’π‘“π‘“\sigma_{eff}) for Δ​σB​Ge​f​fΟƒB​Ge​f​fΞ”superscriptsubscriptπœŽπ΅πΊπ‘’π‘“π‘“superscriptsubscriptπœŽπ΅πΊπ‘’π‘“π‘“\frac{\Delta\sigma_{BG}^{eff}}{\sigma_{BG}^{eff}} = 5%percent55\% and MH=150subscript𝑀𝐻150M_{H}=150 GeV/c2.

The result of the training session is shown in figureΒ 20. We apply the same procedure as for the Hβ†’b​b¯→𝐻𝑏¯𝑏H\rightarrow b\overline{b} semileptonic channel (see section 5.2.4) and an example of the values of the selection efficiencies and the corresponding effective cross-sections are shown in tableΒ 19. The main background after selection is again due to top-pair production. The precisions we get for gt​t​Hsubscript𝑔𝑑𝑑𝐻g_{ttH} are shown in tableΒ 20 and on figure 4. They range from 10.2% (12.1%) to 35.2% (47.2%) for Δ​σB​Ge​f​fΟƒB​Ge​f​f=5%Ξ”superscriptsubscriptπœŽπ΅πΊπ‘’π‘“π‘“superscriptsubscriptπœŽπ΅πΊπ‘’π‘“π‘“percent5\frac{\Delta\sigma_{BG}^{eff}}{\sigma_{BG}^{eff}}=5\% (10%). The remarks made for the previous channel apply here as well. For the lowest values of the Higgs mass range, the resolution is not good as the branching ratio of the Higgs into pairs of W’s is very small. For MHβ‰ˆsubscript𝑀𝐻absentM_{H}\approx 170 GeV/c2, the resolution curve has a minimum which corresponds to the maximum of the branching ratio. Then, for higher mass values, the resolution degrades due to the decrease of the cross section and of the branching ratio.

MHsubscript𝑀𝐻M_{H} (GeV/c2) Δ​σB​Ge​f​fΟƒB​Ge​f​fΞ”superscriptsubscriptπœŽπ΅πΊπ‘’π‘“π‘“superscriptsubscriptπœŽπ΅πΊπ‘’π‘“π‘“\frac{\Delta\sigma_{BG}^{eff}}{\sigma_{BG}^{eff}} Ο΅s​e​ls​i​g​n​a​lsuperscriptsubscriptitalic-Ο΅π‘ π‘’π‘™π‘ π‘–π‘”π‘›π‘Žπ‘™\epsilon_{sel}^{signal} ρs​e​ls​a​m​p​l​esuperscriptsubscriptπœŒπ‘ π‘’π‘™π‘ π‘Žπ‘šπ‘π‘™π‘’\rho_{sel}^{sample} (Δ​gt​t​Hgt​t​H)s​t​a​tsubscriptΞ”subscript𝑔𝑑𝑑𝐻subscriptπ‘”π‘‘π‘‘π»π‘ π‘‘π‘Žπ‘‘\big{(}\frac{\Delta g_{ttH}}{g_{ttH}}\big{)}_{stat} (Δ​gt​t​Hgt​t​H)s​y​s​tsubscriptΞ”subscript𝑔𝑑𝑑𝐻subscript𝑔𝑑𝑑𝐻𝑠𝑦𝑠𝑑\big{(}\frac{\Delta g_{ttH}}{g_{ttH}}\big{)}_{syst} Δ​gt​t​Hgt​t​HΞ”subscript𝑔𝑑𝑑𝐻subscript𝑔𝑑𝑑𝐻\frac{\Delta g_{ttH}}{g_{ttH}}
130 5%percent55\% 8.9%percent8.98.9\% 12.2%percent12.212.2\% 30.1%percent30.130.1\% 18.2%percent18.218.2\% 35.2%percent35.235.2\%
10%percent1010\% 8.9%percent8.98.9\% 12.2%percent12.212.2\% 30.1%percent30.130.1\% 36.4%percent36.436.4\% 47.2%percent47.247.2\%
150 5%percent55\% 16.7%percent16.716.7\% 25.8%percent25.825.8\% 11.3%percent11.311.3\% 7.3%percent7.37.3\% 13.5%percent13.513.5\%
10%percent1010\% 9.3%percent9.39.3\% 33.4%percent33.433.4\% 13.4%percent13.413.4\% 10.1%percent10.110.1\% 16.8%percent16.816.8\%
170 5%percent55\% 15.9%percent15.915.9\% 38.0%percent38.038.0\% 9.3%percent9.39.3\% 4.1%percent4.14.1\% 10.2%percent10.210.2\%
10%percent1010\% 12.5%percent12.512.5\% 42.5%percent42.542.5\% 10.0%percent10.010.0\% 6.8%percent6.86.8\% 12.1%percent12.112.1\%
200 5%percent55\% 16.0%percent16.016.0\% 27.5%percent27.527.5\% 15.7%percent15.715.7\% 6.6%percent6.66.6\% 17.1%percent17.117.1\%
10%percent1010\% 12.5%percent12.512.5\% 32.2%percent32.232.2\% 16.5%percent16.516.5\% 10.6%percent10.610.6\% 19.6%percent19.619.6\%
Table 20: The single lepton plus 8 jet channel: expected uncertainty on the measurement of gt​t​Hsubscript𝑔𝑑𝑑𝐻g_{ttH} for various Higgs boson masses. Selection efficiency of the signal (Ο΅s​e​ls​i​g​n​a​lsuperscriptsubscriptitalic-Ο΅π‘ π‘’π‘™π‘ π‘–π‘”π‘›π‘Žπ‘™\epsilon_{sel}^{signal}) and purity of the selected sample (ρs​e​ls​a​m​p​l​esuperscriptsubscriptπœŒπ‘ π‘’π‘™π‘ π‘Žπ‘šπ‘π‘™π‘’\rho_{sel}^{sample}) are also shown.

6.3.5 Precision loss due to 6 fermion processes

Final state σ​(f​b)πœŽπ‘“π‘\sigma(fb) Ο΅s​e​lsubscriptitalic-ϡ𝑠𝑒𝑙\epsilon_{sel}
b​b¯​u​d¯​eβˆ’β€‹Ξ½Β―e𝑏¯𝑏𝑒¯𝑑superscript𝑒subscriptΒ―πœˆπ‘’b\overline{b}u\overline{d}e^{-}\overline{\nu}_{e} βˆ— ∼1.5similar-toabsent1.5\sim 1.5 0.04%percent0.040.04\%
b​b¯​t​b¯​d​u¯𝑏¯𝑏𝑑¯𝑏𝑑¯𝑒b\overline{b}t\overline{b}d\overline{u} βˆ— ∼6β‹…10βˆ’3similar-toabsentβ‹…6superscript103\sim 6\cdot 10^{-3} 2.4%percent2.42.4\%
b​b¯​t​bΒ―β€‹ΞΌβ€‹Ξ½Β―π‘Β―π‘π‘‘Β―π‘πœ‡Β―πœˆb\overline{b}t\overline{b}\mu\overline{\nu} βˆ— ∼1.5β‹…10βˆ’3similar-toabsentβ‹…1.5superscript103\sim 1.5\cdot 10^{-3} 3.4%percent3.43.4\%
t​t¯​q​q¯​q′​qΒ―β€²π‘‘Β―π‘‘π‘žΒ―π‘žsuperscriptπ‘žβ€²superscriptΒ―π‘žβ€²t\overline{t}q\overline{q}q^{\prime}\overline{q}^{\prime} (q,qβ€²=u,d,s)formulae-sequenceπ‘žsuperscriptπ‘žβ€²π‘’π‘‘π‘ (q,q^{\prime}=u,d,s) 1.2β‹…10βˆ’2β‹…1.2superscript1021.2\cdot 10^{-2} 7.6%percent7.67.6\%
q​q¯​t​b¯​lβ€‹Ξ½Β―π‘žΒ―π‘žπ‘‘Β―π‘π‘™Β―πœˆq\overline{q}t\overline{b}l\overline{\nu} (q=u,d,s,c;(q=u,d,s,c; l=eβˆ’,ΞΌβˆ’π‘™superscript𝑒superscriptπœ‡l=e^{-},\mu^{-}) βˆ— ∼7.6β‹…10βˆ’2similar-toabsentβ‹…7.6superscript102\sim 7.6\cdot 10^{-2} 1.7%percent1.71.7\%
q​q¯​t​b¯​d​uΒ―π‘žΒ―π‘žπ‘‘Β―π‘π‘‘Β―π‘’q\overline{q}t\overline{b}d\overline{u} (q=u,d,s,c)π‘žπ‘’π‘‘π‘ π‘(q=u,d,s,c) βˆ— ∼1.3β‹…10βˆ’1similar-toabsentβ‹…1.3superscript101\sim 1.3\cdot 10^{-1} 1.2%percent1.21.2\%
Table 21: The single lepton plus 8 jet channel: cross section (ΟƒπœŽ\sigma) and selection efficiencies (Ο΅s​e​lsubscriptitalic-ϡ𝑠𝑒𝑙\epsilon_{sel}) of the 6 fermion processes for Δ​σB​Ge​f​fΟƒB​Ge​f​fΞ”superscriptsubscriptπœŽπ΅πΊπ‘’π‘“π‘“superscriptsubscriptπœŽπ΅πΊπ‘’π‘“π‘“\frac{\Delta\sigma_{BG}^{eff}}{\sigma_{BG}^{eff}} = 5%percent55\% and MH=150subscript𝑀𝐻150M_{H}=150 GeV/c2. For events marked with a βˆ—, some diagrams were removed from the calculation to avoid double counting.

The 6 fermion processes which may degrade the resolution on gt​t​Hsubscript𝑔𝑑𝑑𝐻g_{ttH} in this channel are the same than in the previous channel. They are listed in tableΒ 21 with their cross section and selection efficiency for MH=150subscript𝑀𝐻150M_{H}=150 GeV/c2. The loss of resolution on gt​t​Hsubscript𝑔𝑑𝑑𝐻g_{ttH} when the 6 fermion background is included in the analysis is shown in tableΒ 22. This channel is slightly more affected by the 6 fermion background than the previous ones because its signature is less distinctive. The loss of resolution is however still very small.

Δ​σB​Ge​f​fΟƒB​Ge​f​fΞ”superscriptsubscriptπœŽπ΅πΊπ‘’π‘“π‘“superscriptsubscriptπœŽπ΅πΊπ‘’π‘“π‘“\frac{\Delta\sigma_{BG}^{eff}}{\sigma_{BG}^{eff}} Δ​gt​t​Hgt​t​HΞ”subscript𝑔𝑑𝑑𝐻subscript𝑔𝑑𝑑𝐻\frac{\Delta g_{ttH}}{g_{ttH}}(without 6f) Δ​gt​t​Hgt​t​HΞ”subscript𝑔𝑑𝑑𝐻subscript𝑔𝑑𝑑𝐻\frac{\Delta g_{ttH}}{g_{ttH}}(with 6f)
5%percent55\% 13.5%percent13.513.5\% ∼14%similar-toabsentpercent14\sim 14\%
10%percent1010\% 16.8%percent16.816.8\% ∼17.5%similar-toabsentpercent17.5\sim 17.5\%
Table 22: The single lepton plus 8 jet channel: expected uncertainty on the measurement of gt​t​Hsubscript𝑔𝑑𝑑𝐻g_{ttH} without and with inclusion of the 6 fermion processes in the analysis for MH=150subscript𝑀𝐻150M_{H}=150 GeV/c2.

7 Influence of the limited knowledge on the SM input parameters

The results presented in this note were obtained for fixed values of the SM input parameters. The question was addressed whether the present limited knowledge on these values has any significant influence on the expected precision on gt​t​Hsubscript𝑔𝑑𝑑𝐻g_{ttH}.

The largest effect, if any, is expected from the present experimental uncertainty on the top quark mass (which is of the order of 5 GeV/c2). A change in mtsubscriptπ‘šπ‘‘m_{t} modifies several ingredients of the analysis: the selection efficiencies for signal and background, the top-pair production cross-section (Οƒt​tΒ―subscriptπœŽπ‘‘Β―π‘‘\sigma_{t\overline{t}}), the signal cross-section (Οƒt​t¯​HsubscriptπœŽπ‘‘Β―π‘‘π»\sigma_{t\overline{t}H}) and the function F​(MH,mt,s)𝐹subscript𝑀𝐻subscriptπ‘šπ‘‘π‘ F(M_{H},m_{t},s) entering equation 3.5 and 3.6, a.s.o.

The study presented here was performed by moving mtsubscriptπ‘šπ‘‘m_{t} from its central value of 175 GeV/c2 to 170 and 180 GeV/c2. The change in Οƒt​t¯​HsubscriptπœŽπ‘‘Β―π‘‘π»\sigma_{t\overline{t}H} was observed to be largest for low values of MHsubscript𝑀𝐻M_{H} (i.e. 120 GeV/c2), where it amounted to Β±plus-or-minus\pm 5 %, while the main background cross-section (Οƒt​tΒ―subscriptπœŽπ‘‘Β―π‘‘\sigma_{t\overline{t}}) varied by Β±plus-or-minus\pm 1 % only. Signal events were generated with mtsubscriptπ‘šπ‘‘m_{t} = 170 and 180 GeV/c2, MHsubscript𝑀𝐻M_{H} being fixed to 120 GeV/c2, and the analysis of the Higgs decay into b-quark pairs was repeated for the so-called semileptonic channel (see section 5.2). The distributions of several variables entering the event selection are displayed on figure 21 and 22 for each value of mtsubscriptπ‘šπ‘‘m_{t}. The changes observed are tiny, illustrating that the preselection and selection efficiencies remain essentially unchanged. Overall, the study demonstrated that the precision on gt​t​Hsubscript𝑔𝑑𝑑𝐻g_{ttH} varies by a negligible amount when moving mtsubscriptπ‘šπ‘‘m_{t} from 170 to 180 GeV/c2. The conclusion is therefore that the present accuracy on the SM input parameters has no significant influence on the predicted accuracy on gt​t​Hsubscript𝑔𝑑𝑑𝐻g_{ttH}.

8 Conclusion and outlook

The process e+​eβˆ’β†’t​t¯​Hβ†’superscript𝑒superscript𝑒𝑑¯𝑑𝐻e^{+}e^{-}\rightarrow t\overline{t}H allows in principle a direct measurement of the top-Higgs Yukawa coupling. We presented a realistic feasability study in the context of a future e+​eβˆ’superscript𝑒superscript𝑒e^{+}e^{-} Linear Collider such as TESLA, that takes into account all dominant physical backgrounds, the main radiative effects (initial and final state radiation and beamstrahlung) as well as detector and event reconstruction effects. A rough estimate of the loss of precision due to 6 fermion background processes was presented. The effect of the uncertainty on the top quark mass was also addressed. The e+​eβˆ’β†’e+​eβˆ’β€‹Ξ³β€‹Ξ³β†’e+​eβˆ’β†’superscript𝑒superscript𝑒superscript𝑒superscript𝑒𝛾𝛾→superscript𝑒superscript𝑒e^{+}e^{-}\rightarrow e^{+}e^{-}\gamma\gamma\rightarrow e^{+}e^{-}hadrons events, which may superimpose on physics events, were neglected. However, the impact of this background was studied for the e+​eβˆ’β†’W+​Wβˆ’β€‹Ξ½β€‹Ξ½β†’H​ν​ν→superscript𝑒superscript𝑒superscriptπ‘Šsuperscriptπ‘Šπœˆπœˆβ†’π»πœˆπœˆe^{+}e^{-}\rightarrow W^{+}W^{-}\nu\nu\rightarrow H\nu\nu process and found negligible [18]. Four channels were studied and the analysis repeated for several values of the Higgs boson mass ranging from 120 GeV/c2 to 200 GeV/c2. A collision energy of 800 GeV and an integrated luminosity of 1000 fb-1 were assumed. The accuracies which are obtained account for the statistical uncertainty and for the systematic uncertainty arising from a limited knowledge of the background normalisation.

For Higgs boson masses under β‰ˆ\approx 135 GeV/c2, the main decay mode is Hβ†’b​b¯→𝐻𝑏¯𝑏H\rightarrow b\overline{b}. Two channels were analysed - the hadronic and the semileptonic channels - and we presented the results for the Higgs mass range: 120 GeV/c2 - 150 GeV/c2. The measurement precision found for a mass of 120120120 GeV/c2 in the Hβ†’b​b¯→𝐻𝑏¯𝑏H\rightarrow b\overline{b} mode is slightly worse than inΒ [4], due to refinements of the present analysis which make it more realistic. The resolution degrades with increasing mass, due to the reduced event rate. In this decay mode, the ability to identify b-jets is of major importance.

For Higgs boson masses above β‰ˆ\approx 140 GeV/c2, the Hβ†’W+​Wβˆ’β†’π»superscriptπ‘Šsuperscriptπ‘ŠH\rightarrow W^{+}W^{-} decay mode yields higher precision than the Hβ†’b​b¯→𝐻𝑏¯𝑏H\rightarrow b\overline{b} one as the number of signal events in the latter mode becomes too tiny. Two channels were analysed - the 2 like sign lepton plus 6 jet channel and the single lepton plus 8 jet channel - and we presented the results for the Higgs mass range: 130 GeV/c2 - 200 GeV/c2.

We showed that the 6 fermion background has a very modest influence on the measurement of the coupling, and that the present limited knowledge on the Standard Model input parameters has no significant influence on the predicted accuracy on gt​t​Hsubscript𝑔𝑑𝑑𝐻g_{ttH}.

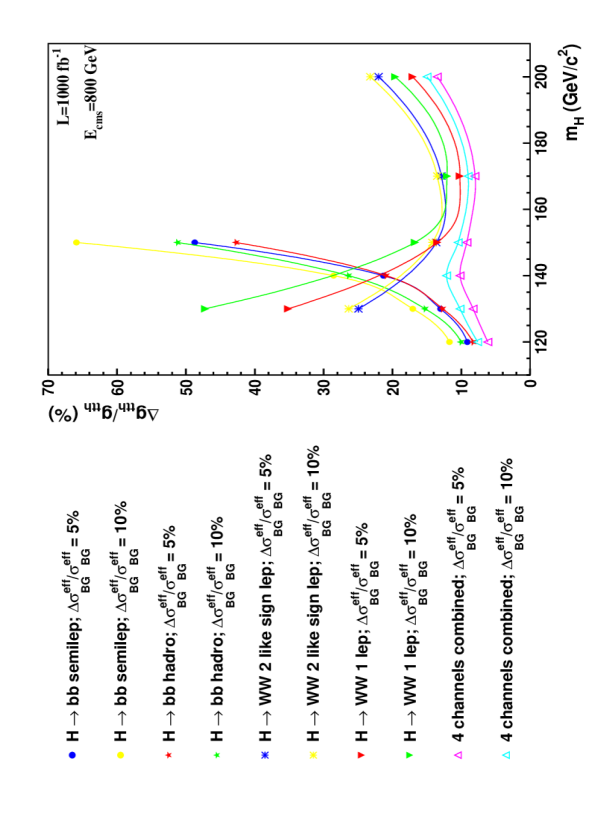
As a final result, the four channels studied in this paper are combined666We combine the uncertainties found without inclusion of 6 fermion processes as the degradation due to them has only been roughly estimated and is anyway small. to get the global precision and these results are shown in tableΒ 23 and on figureΒ 4.

The expected accuracy on gt​t​Hsubscript𝑔𝑑𝑑𝐻g_{ttH} is better than β‰ˆ10%absentpercent10\approx 10\% over most of the mass range (up to MHβ‰ˆsubscript𝑀𝐻absentM_{H}\approx 180 GeV/c2), even if the knowledge of the background normalisation is only at the 10%percent1010\% level. In the most favourable case (MHsubscript𝑀𝐻M_{H}= 120 GeV/c2 and Δ​σB​Ge​f​fΟƒB​Ge​f​fΞ”superscriptsubscriptπœŽπ΅πΊπ‘’π‘“π‘“superscriptsubscriptπœŽπ΅πΊπ‘’π‘“π‘“\frac{\Delta\sigma_{BG}^{eff}}{\sigma_{BG}^{eff}} = 5%percent\%), the accuracy is about 6%percent\%. It is also good (8 to 9%) for MHβ‰ˆsubscript𝑀𝐻absentM_{H}\approx 170 GeV/c2, corresponding to the maximum of the branching ratio of the Higgs boson into pairs of W’s. For the less favourable case (MHsubscript𝑀𝐻M_{H}= 200 GeV/c2), the accuracy is however still better than 15%percent\% even if Δ​σB​Ge​f​fΟƒB​Ge​f​fΞ”superscriptsubscriptπœŽπ΅πΊπ‘’π‘“π‘“superscriptsubscriptπœŽπ΅πΊπ‘’π‘“π‘“\frac{\Delta\sigma_{BG}^{eff}}{\sigma_{BG}^{eff}} = 10%percent\%.

We observe that the best resolutions are obtained for the lowest Higgs mass values, which are the most likely as predicted by precision measurements.

At the LHC, under some conditions which make the analysis more model-dependent, the expected accuracy on gt​t​Hsubscript𝑔𝑑𝑑𝐻g_{ttH} with 300 fb-1 lies in the range 10%βˆ’20%percent10percent2010\%-20\% for MH∈subscript𝑀𝐻absentM_{H}\in [100 GeV/c2-200 GeV/c2] Β [19]. The precise measurements of the Higgs branching ratios available already at a low energy run of the Linear Collider will allow to remove the model-dependence of the LHC results [20]. The achievable accuracies are however not as good as those expected at a high energy run of the Linear Collider.

Finally, it should be stressed that there is certainly room for substantial improvement of the study exposed in this note. For instance, the b-tagging does not include all observables (e.g. vertex charge), more efficient jet reconstruction and particle flow algorithms could improve the reconstruction, other final states could be included, the reconstruction of Ο„πœ\tau’s could enhance the number of signal events in leptonic channels and the analysis itself (selection criteria, neural network inputs, training and architecture) can also be optimized. Moreover, the analysis may be extended above MHsubscript𝑀𝐻M_{H}=200 GeV/c2 in order to cover the full Higgs mass range allowed by precision measurements.

MHsubscript𝑀𝐻M_{H} (GeV/c2) Δ​σB​Ge​f​fΟƒB​Ge​f​fΞ”superscriptsubscriptπœŽπ΅πΊπ‘’π‘“π‘“superscriptsubscriptπœŽπ΅πΊπ‘’π‘“π‘“\frac{\Delta\sigma_{BG}^{eff}}{\sigma_{BG}^{eff}} Δ​gt​t​Hgt​t​HΞ”subscript𝑔𝑑𝑑𝐻subscript𝑔𝑑𝑑𝐻\frac{\Delta g_{ttH}}{g_{ttH}}
120 5%percent55\% 6.1%percent6.16.1\%
10%percent1010\% 7.6%percent7.67.6\%
130 5%percent55\% 8.3%percent8.38.3\%
10%percent1010\% 10.2%percent10.210.2\%
150 5%percent55\% 9.2%percent9.29.2\%
10%percent1010\% 10.5%percent10.510.5\%
170 5%percent55\% 8.0%percent8.08.0\%
10%percent1010\% 9.0%percent9.09.0\%
200 5%percent55\% 13.5%percent13.513.5\%
10%percent1010\% 15.0%percent15.015.0\%
Table 23: Expected relative uncertainty on the measurement of gt​t​Hsubscript𝑔𝑑𝑑𝐻g_{ttH} via the process e+​eβˆ’β†’t​t¯​Hβ†’superscript𝑒superscript𝑒𝑑¯𝑑𝐻e^{+}e^{-}\rightarrow t\overline{t}H for the combination of the 4 channels studied, for various Higgs boson masses and for two values of the relative uncertainty on the residual background normalisation.

Acknowledgements

I thank Marc Winter and Iouri Gornouchkine for valuable discussions.

References

  • [1] ALEPH, DELPHI, L3 and OPAL collaborations, The LEP Working Group for Higgs Boson searches, ”Search for the Standard Model Higgs Boson at LEP”, CERN-EP/2003-011.
  • [2] The LEP Electroweak Working Group: http://lepewwg.web.cern.ch/LEPEWWG/
  • [3] H.Β Baer, S.Β Dawson and L.Β Reina, ”Measuring the top quark Yukawa coupling at a linear e+​eβˆ’superscript𝑒superscript𝑒e^{+}e^{-} collider”, Phys.Β Rev.Β D 61 (2000), 013002
  • [4] A.Β Juste and G.Β Merino, ”Top-Higgs Yukawa coupling measurement at a linear e+​eβˆ’superscript𝑒superscript𝑒e^{+}e^{-} collider”, hep-ph/9910301.
  • [5] A.Β Djouadi, J.Β Kalinowski and M.Β Spira, ”HDECAY: A program for Higgs boson decays in the Standard Model and its supersymmetric extension,” Comput.Β Phys.Β Commun.Β  108 (1998) 56
  • [6] A.Β Pukhov et al., ”CompHEP: A package for evaluation of Feynman diagrams and integration over multi-particle phase space”, hep-ph/9908288.
  • [7] S. Dittmaier, M. Kramer, Y. Liao, M. Spira and P. Zerwas, Phys. Lett. B441 (1998) 383.
    S. Dawson and L. Reina, Phys. Rev. D59 (1999) 054012.
    G. BΓ©langer et al., hep-ph/0307029.
    C. Farrell, A. Hoang, Phys. Rev. D72 (2005) 014007.
  • [8] T.Β Sjostrand, L.Β Lonnblad and S.Β Mrenna, ”PYTHIA 6.2: Physics and manual”, hep-ph/0108264.
  • [9] T.Β Ohl, ”CIRCE version 1.0: Beam spectra for simulating Linear Collider physics,” Comput.Β Phys.Β Commun.Β  101 (1997) 269.
  • [10] W. Kilian, Linear Collider Note LC-TOOL-2001-039.
  • [11] M.Β Pohl and H.Β J.Β Schreiber, ”SIMDET - version 4, a parametric Monte Carlo for a TESLA detector”, DESY 02-061, LC-DET-2002-005.
  • [12] TESLA Technical Design Report, DESY 2001-011, ECFA 2001-209, March 2001.
  • [13] Richard Hawkings, ”Vertex detector and flavour tagging studies for the TESLA Linear Collider”, LC-PHSM-2000-021-TESLA.
  • [14] S.M. Xella Hansen, D.J. Jackson, R. Hawkings, C. Damerell, ”Flavour tagging studies for the TESLA Linear Collider”, LC-PHSM-2001-024.
  • [15] http://flc25.desy.de/flc/science/analysis__\_ntuple/index.html
  • [16] http://schwind.home.cern.ch/schwind/MLPfit.html
  • [17] S. Heinemeyer, S. Kraml, W. Porod, G. Weiglein, ”Physics Impact of a Precise Determination of the Top Quark Mass at a e+ e- Linear Collider”, LC-TH-2003-052.
  • [18] M. Battaglia and D.Schulte, Study of gamma gamma Background in e+​eβˆ’β†’W+​Wβˆ’β€‹Ξ½β€‹Ξ½β†’H​ν​ν→superscript𝑒superscript𝑒superscriptπ‘Šsuperscriptπ‘Šπœˆπœˆβ†’π»πœˆπœˆe^{+}e^{-}\rightarrow W^{+}W^{-}\nu\nu\rightarrow H\nu\nu at the Tesla e+e- Linear Collider, LC-PHSM-2000-052.
  • [19] M. DΓΌhrssen et al., hep-ph/0406323.
  • [20] LHC/LC Study Group (G. Weiglein et al.), Physics interplay of the LHC and the ILC, hep-ph/0410364
Refer to caption
Figure 4: Expected relative uncertainty on the measurement of gt​t​Hsubscript𝑔𝑑𝑑𝐻g_{ttH} via the process e+​eβˆ’β†’t​t¯​Hβ†’superscript𝑒superscript𝑒𝑑¯𝑑𝐻e^{+}e^{-}\rightarrow t\overline{t}H for various channels and their combination, for various Higgs boson masses and for two values of the relative uncertainty on the residual background normalisation.
Refer to caption
Figure 5: The Hβ†’b​b¯→𝐻𝑏¯𝑏H\rightarrow b\overline{b} semileptonic channel: preselection variables (I). The signal (solid line) and the background (dashed line) are normalised to 1. The signal is shown for MH=120subscript𝑀𝐻120M_{H}=120 GeV/c2.
Refer to caption
Figure 6: The Hβ†’b​b¯→𝐻𝑏¯𝑏H\rightarrow b\overline{b} semileptonic channel: preselection variables (II). The signal (solid line) and the background (dashed line) are normalised to 1. The signal is shown for MH=120subscript𝑀𝐻120M_{H}=120 GeV/c2.
Refer to caption
Figure 7: The Hβ†’b​b¯→𝐻𝑏¯𝑏H\rightarrow b\overline{b} semileptonic channel: variables (after preselection) used for the neural network analysis (I). The signal (solid line) and the background (dashed line) are normalised to 1. The signal is shown for MH=120subscript𝑀𝐻120M_{H}=120 GeV/c2.
Refer to caption
Figure 8: The Hβ†’b​b¯→𝐻𝑏¯𝑏H\rightarrow b\overline{b} semileptonic channel: variables (after preselection) used for the neural network analysis (II). The signal (solid line) and the background (dashed line) are normalised to 1. The signal is shown for MH=120subscript𝑀𝐻120M_{H}=120 GeV/c2.
Refer to caption
Figure 9: The Hβ†’b​b¯→𝐻𝑏¯𝑏H\rightarrow b\overline{b} semileptonic channel: neural network output. Top, the signal (solid line) and the background (dashed line) are normalised to 1. Bottom, the signal (solid line) and the background (dashed line) are normalised to the expected number of events. The signal is shown for MH=120subscript𝑀𝐻120M_{H}=120 GeV/c2.
Refer to caption
Figure 10: The Hβ†’b​b¯→𝐻𝑏¯𝑏H\rightarrow b\overline{b} hadronic channel: preselection variables. The signal (solid line) and the background (dashed line) are normalised to 1. The signal is shown for MH=120subscript𝑀𝐻120M_{H}=120 GeV/c2.
Refer to caption
Figure 11: The Hβ†’b​b¯→𝐻𝑏¯𝑏H\rightarrow b\overline{b} hadronic channel: variables (after preselection) used for the neural network analysis (I). The signal (solid line) and the background (dashed line) are normalised to 1. The signal is shown for MH=120subscript𝑀𝐻120M_{H}=120 GeV/c2.
Refer to caption
Figure 12: The Hβ†’b​b¯→𝐻𝑏¯𝑏H\rightarrow b\overline{b} hadronic channel: variables (after preselection) used for the neural network analysis (II). The signal (solid line) and the background (dashed line) are normalised to 1. The signal is shown for MH=120subscript𝑀𝐻120M_{H}=120 GeV/c2.
Refer to caption
Figure 13: The Hβ†’b​b¯→𝐻𝑏¯𝑏H\rightarrow b\overline{b} hadronic channel: neural network output. Top, the signal (solid line) and the background (dashed line) are normalised to 1. Bottom, the signal (solid line) and the background (dashed line) are normalised to the expected number of events. The signal is shown for MH=120subscript𝑀𝐻120M_{H}=120 GeV/c2.
Refer to caption
Figure 14: The two like sign lepton plus 6 jet channel: selection variables (I). The signal (solid line) and the background (dashed line) are normalised to 1. The signal is shown for MH=150subscript𝑀𝐻150M_{H}=150 GeV/c2.
Refer to caption
Figure 15: The two like sign lepton plus 6 jet channel: selection variables (II). The signal (solid line) and the background (dashed line) are normalised to 1. The signal is shown for MH=150subscript𝑀𝐻150M_{H}=150 GeV/c2.
Refer to caption
Figure 16: The single lepton plus 8 jet channel: preselection variables (I). The signal (solid line) and the background (dashed line) are normalised to 1. The signal is shown for MH=150subscript𝑀𝐻150M_{H}=150 GeV/c2.
Refer to caption
Figure 17: The single lepton plus 8 jet channel: preselection variables (II). The signal (solid line) and the background (dashed line) are normalised to 1. The signal is shown for MH=150subscript𝑀𝐻150M_{H}=150 GeV/c2.
Refer to caption
Figure 18: The single lepton plus 8 jet channel: variables (after preselection) used for the neural network analysis (I). The signal (solid line) and the background (dashed line) are normalised to 1. The signal is shown for MH=150subscript𝑀𝐻150M_{H}=150 GeV/c2.
Refer to caption
Figure 19: The single lepton plus 8 jet channel: variables (after preselection) used for the neural network analysis (II). The signal (solid line) and the background (dashed line) are normalised to 1. The signal is shown for MH=150subscript𝑀𝐻150M_{H}=150 GeV/c2.
Refer to caption
Figure 20: The single lepton plus 8 jet channel: neural network output. Top, the signal (solid line) and the background (dashed line) are normalised to 1. Bottom, the signal (solid line) and the background (dashed line) are normalised to the expected number of events. The signal is shown for MH=150subscript𝑀𝐻150M_{H}=150 GeV/c2.
Refer to caption
Figure 21: The Hβ†’b​b¯→𝐻𝑏¯𝑏H\rightarrow b\overline{b} semileptonic channel: variables used in the analysis for three different top mass values: 170, 175 and 180 GeV/c2 (MH=120subscript𝑀𝐻120M_{H}=120 GeV/c2) (I).
Refer to caption
Figure 22: The Hβ†’b​b¯→𝐻𝑏¯𝑏H\rightarrow b\overline{b} semileptonic channel: variables used in the analysis for three different top mass values: 170, 175 and 180 GeV/c2 (MH=120subscript𝑀𝐻120M_{H}=120 GeV/c2) (II).