1Instituto de Física, Universidad Nacional Autónoma de México,
Apartado Postal 20364, 01000, México D.F., México
2 Institut de Physique Théorique, Université catholique de Louvain
B-1348 Louvain-la-Neuve, Belgium
Abstract
We apply the quasi-elastic assumption of the strong final state interactions to describe the and branching ratios and CP asymmetries and derive bounds on . We find that small electroweak penguins contributions and values of larger than in standard fit results are favored by data.
1 Introduction
The strong phases of the and decay amplitudes have been usually treated assuming that the strong interactions are dominated by short distance perturbative effects. According to this the
strong phases can be obtained perturbatively from penguin and tree
diagrams and are then generalized to describe hadronic strong
phases to all orders. However, in [1] it was shown the lack of compatibility between the strong phases calculated perturbatively, and those of the isospin basis, where phases are contemplated at all scales (soft and hard).
The isospin symmetry is a very good approximation of the hadronic world. For example, the decay amplitudes are treated on the basis of this symmetry of the strong interactions. For decays we still have isospin invariance but now there are many modes apart from the elastic ones that can be reached with rescattering of final states (FSI). However, for the case of mesons inelasticity is not expected to be significant as far as it becomes important for large angular momentum waves. Therefore we will work in the quasi-elastic limit, where inelastic channels are neglected in rescattering.
The Regge model predicts that the quasi-elastic strong phases are small, and so the CP asymmetries must be necessarily small. Experimentally, the asymmetry turns out to be large, in contradiction with the hypothesis. Nevertheless, this mode involves a charged pion and
corrections due to radiation of photons can play an important role in
quoting precise results from experiments.
In this paper we use the quasi-elastic predictions for FSI in to derive bounds on the angle of the unitary triangle. We give an overview of the Watson Theorem and on the concepts of bare and rescattered
amplitudes, then apply these principles to parameterize the decay
amplitudes in terms of the quark and isospin amplitudes. Using the
experimental branching ratios, which are more precisely measured than the
CP asymmetries, we give an estimate for the range of and of the electroweak penguins contribution, then we give predictions for the asymmetries. We
finally present our conclusions.
2 Hadronic strong phases
The Watson Theorem [2], [3] tell us that the decay amplitudes factorize into the product of the direct or “bare” weak amplitudes, , and the rescattering factors, ,
where as usual the conjugated amplitude is given the same strong
phase which denotes here the matrix element of the
strong interaction. If we factorize the weak phase in the amplitude , we do not have other strong phases induced by perturbative calculations, and the complete hadronic phases to
all orders are included in the factors.
If we were in the elastic case, would be diagonal in the isospin basis:
Thus, for the case of decay amplitudes, we would have
or in the physical basis
with analogous expressions for the other channels and that are reached by decays.
At the mass, however, we have the more general inelastic case, which
is described in the isospin symmetric case as
where we have replaced for the
elastic FSI and have also incorporated the inelastic channels (). The elastic parameters and
, can be calculated using the Regge model of strong
interactions.
In the Regge model, the high energy amplitudes in the -channel can be parametrized in terms of trajectories exchanges in the small region. A
Regge Model to describe decays was
proposed in [4] and [5], but this assumed the complete
elasticity of FSI as it was later remarked in [6]. Taking
into account this remark and using the
relations between the isospin amplitudes in the and channels
we now find:
For these results we made a fit of nucleon-nucleon and pion-nucleon total
cross sections and made use of factorization. and trajectories were considered in t channel in addition to the Pomeron exchange, for both, and modes. and trajectories were neglected in the small region in the case of , because of their small size.
The equality of the factors in each mode follows from the pomeron
dominance over the rest of trajectories contributing to the
amplitude at the mass scale.
As a consequence the strong phases are almost the same (and close to
zero because the pomeron is almost imaginary), so that the differences of
the strong phases would be very tiny and it becomes difficult to give its
value with accuracy.
Since the factors are close to unity, we
can take the quasi-elastic assumption [7], that consists
in the cancellation of the inelastic channels, which means that
.
3 Amplitudes decomposition
Let us consider the decay amplitudes. Once we absorb the elastic
parameters into the definitions of physical amplitudes, they can be
written in terms of the isospin amplitudes as follows
where we have defined the isospin amplitudes
On the other hand, we can express the bare or direct weak amplitudes in terms of the leading (tree), (QCD-penguin), (color suppressed) and (EW-penguin) quark diagrams as follows
where we have defined and
, with
in the Wolfenstein parameterization.
When the strong phases are turned off in the isospin amplitudes, we can identify the
following relations between the quark and the isospin amplitudes,
Thus, using such identities we find the physical amplitudes (including FSI) in
terms of quark diagrams
where the strong phase was absorbed into the definitions of the
amplitudes and .
In the case of decays, we follow the same steps. Here, the physical amplitudes in terms of the isospin amplitudes are given by
where
In terms of the leading quark diagrams, the bare weak amplitudes are
where and , with .
In the absence of the strong phases, we have the following relations between the isospin and quark amplitudes:
Using these relations, the total rescattered amplitudes in terms of quarks
diagrams are
where .
Measurements of the and branching ratios have been
reported in refs. [8]-[14] (expressed in units of
in Table 1).
Corresponding measurements of the CP asymmetries are much less precise
[11]-[19] and are summarized in Table 2.
There are some noticeable differences between BaBar and Belle results, namely the differences of the branching ratios and are and away, respectively, while the differences of the asymmetries , and differs by , and . Therefore, we prefer to do a separated analysis for both sets of data.
4 Constraints from the branching ratios
We define the following independent ratios of the CP-averaged branching ratios
where [20] is the ratio of the and lifetimes. and were already introduced in [21].
From Table 1 we obtain the following table
where CLEO data has been included in the average.
From we can obtain the tree (color allowed and suppressed) to penguin ratio. Defining
is written as
(1)
where the ratio gives an estimate of the size of the symmetry breaking. Using the experimental value of and we find . This result is obtained by neglecting the FSI corrections to .
The next step is to find the ratio by adding the information of the modes. In the quasi-elastic case
the final state interactions in and cancel each other in their ratio and we have
using the sine law ( and ) we can express the ratio in terms of and as follows
(3)
where
In Figure (1) we plot as a function of , using the experimental value , [22]. We
observe that in order to have the naive expectation from BaBar data we require , namely a value that is above the upper limit of the standard fit, which taken at its interval reads [22].
Figure 1: vs extracted from ratios of B decay widths.
We can obtain additional information about using the ratios of the
branching fractions. Inclusion of the diagrams is required in
this case. Defining
and
can be expressed as follows
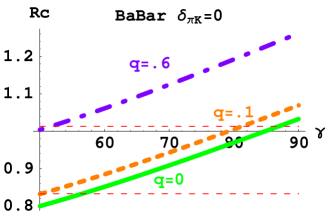
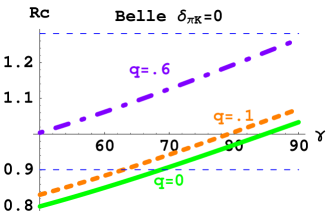
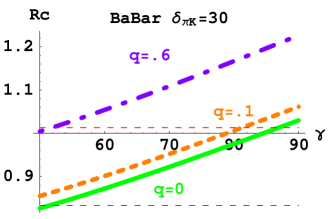
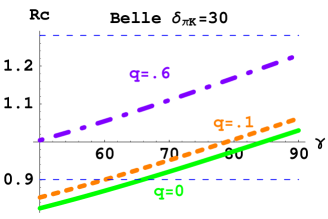
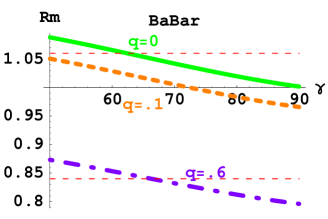
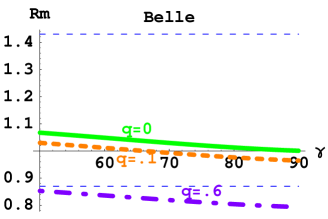
In Figure 2 we plot as a function of for different
values of and for two values of the difference of final strong phases ( and ). The dependence upon the strong phase
is irrelevant but is enough to be confused with the effect of a small change in
when is small. From Figure 2 we see
that the expectation [23] is excluded
by the BaBar data. Small values of , as we would expect from the
naive ratio , namely , are preferred by data. Thus, assuming that at least , BaBar
data puts a limit of .
Figure 2: vs for and and for different values of . The horizontal bands represent the experimental value
with limits.
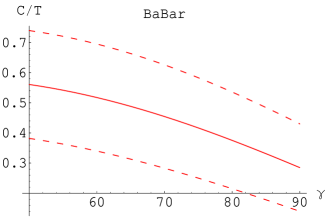
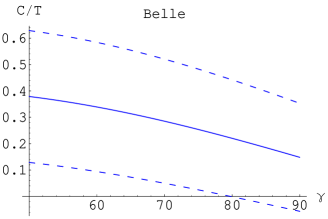
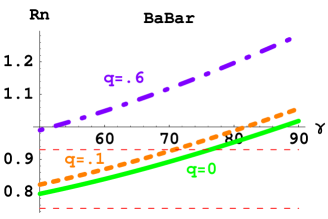
Let us consider now the information provided by :
The dependence upon the strong phase is less important than in and we consider
the analysis only for . From figure (3) we observe that is
not favored by data. Using the value , BaBar puts the limit
and Belle .
Figure 3: vs for and for different values of . The horizontal bands represent the experimental value
with limits.
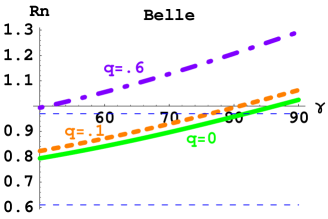
Finally, we consider the ratio ,
From Figure (4) we observe that is ruled out by Belle data, but neither of the
two experiments puts a relevant constrain on for small values of .
Figure 4: vs for different values of . The horizontal bands represent the experimental value
with limits.
When more accurate measurements become available, we will be able to determine ,
in addition to . At present we observe that large values are clearly disfavored by data and are inconsistent with the ratio
displayed in Figure (1). Clearly, small values of are preferred by
data.
5 Constraints from the CP asymmetries
Final state interactions can receive contributions from rescattering of
several intermediate states. In the
framework of the Regge model FSI are dominated by the quasi-elastic modes, so we expect small strong phases. Since the CP asymmetries are proportional to the
interference term , , the inclusion of
is negligible for any , and we will neglect it.
The direct asymmetries, in two-pion decays are
given by
Using Equation (2) and the sine law relation ,
we obtain
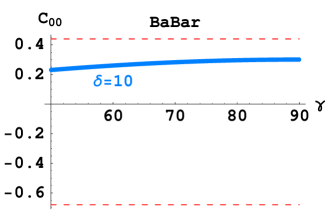
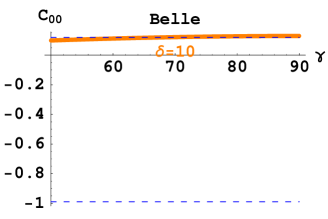
From Figure (5) we observe that the CP asymmetry coefficient
measured by Belle disfavors large strong phase difference,
while that measured by BaBar prefers small strong phases. Therefore, we can not infer any physical conclusion from this
CP asymmetry. On the other hand present data on are
consistent with a small strong phase difference. Note that we expect a CP
asymmetry of opposite sign to , though the data seems to
favor a negative asymmetry.
Figure 5: and vs for two
choices of the strong phase difference. The horizontal band represents the
experimental value with its limits.
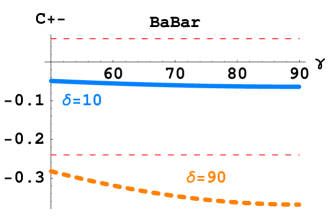
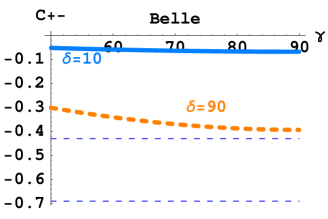
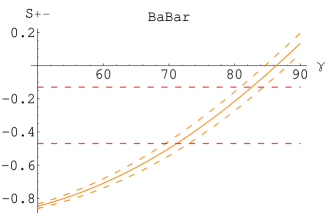
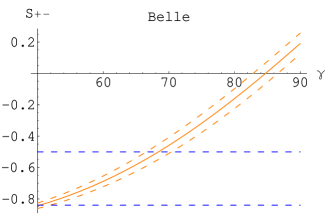
The expression for the asymmetry coefficient is:
where , and . Making use of equations (2),
(3) and , we obtain Figure
(6) where we have plotted as a function of
when .
From this plot we derive the following allowed intervals for :
(BaBar) and
(Belle).
Figure 6: vs . The horizontal bands represents the
experimental values with its bounds.
In the case of decays, we have the following expression for the
direct CP asymmetry coefficient:
then
From Table 2 we have consistency of both experiments and a large asymmetry
. Note however that in this case photonic radiated corrections should be taken more carefully in the Montecarlo simulations.
If forthcoming
measurements confirm a large asymmetry, we should conclude that the
quasi-elastic assumption it is not enough to explain data. In that case
other final state interactions which we are neglecting in our analysis,
like , would be required.
The situation with the other asymmetries is not clear at present. For
example, the sign of differs for BaBar and Belle and
for both experiments favor a positive asymmetry, while
we expect (and some other models [23]-[25] do) a negative value. Therefore, we consider
that use of the branching ratios provides at present a more reliable source to
derive bounds on .
6 Conclusions
We have used the quasi-elastic approximation to hadronic final state
rescattering in in order to extract information about the
CP-violating angle from experimental data of these decays. The
values used for the rescattering parameters within our approach were
obtained using the Regge model.
Given the better uncertainty attained in experimental data of the
branching ratios for these decays, they are at present a better source of
information on than the corresponding CP asymmetries.
Note however that using the world average from BaBar and Belle data for
the mixing induced asymmetry coefficient the result
is obtained.
Using the information about the six independent branching ratios of decays, we can also get bounds on . Present data on
these observables do not offer a problem to our approach since required
electroweak penguin contributions turns out to be small and the
ratio is non negligible. In this case, the value is preferred.
If a large direct CP asymmetry for decays is confirmed by
forthcoming measurements, the quasi-elastic approximation may require
some corrections. The most viable candidate could be the inclusion of the
inelastic channel .
7 Acknowledgments
We thank Germán Calderón, Jean-Marc Gérard, Matías Moreno and Jacques Weyers for their valuable comments on this work. We are especially grateful to Gabriel López Castro for useful discussions and important observations in its final stage.
Erika Alvarez acknowledges the financial support from CONACyT and DGAPA (México) under projects G42026-F and IN-120602.
After completion of this work, we came to know the preprint hep-ph/0508083 [26]. Let us comment similarities and differences between their papers and ours.
1. We obtain the absorptive elastic factors ’s quantitatively similar to the ones obtained in ref. [26], but using a different approach.
2. In ref.[26], the inelastic channel is considered in the context of Watson theorem. But this theorem requires stable particles with respect to strong interactions as in- and out-states. It is not the case for . Therefore 4 stable pions should replace the two unstable ’s. It is difficult to have a precise estimate of 4- pions to 2-pions scattering. However a rough estimate indicates this channel should have a negligible effect in the strong phase computation.
3. In ref. [26], charmed intermediate states are estimated to have a negligible effect on strong phases.We agree with this point even if the argument is rather qualitative.. This seems reasonable
4. The main differences between the two works are (a) that in [26] strong phases are found to be large due to the questionable inclusion of ’s in contradistinction with our paper concluding strong phases are small, and (b) contrary to [26], we treat not only modes but also modes.
References
[1]J.M. Gérard and J. Weyers, Eur. Phys. J. C7 1 (1999), (hep-ph/9711469)
[2]M. Suzuki and L. Wolfenstein, Phys. Rev. D60 074019 (1999), (hep-ph/9903477)
[3]C. Smith, Eur. Phys. J. C10, 639 (1999), (hep-ph/9808376)
[4]J.M. Gerard, J. Pestieau and J. Weyers, Phys. Lett. B436, 363 (1998), (hep-ph/9803328)
[5]D. Delepine, J.M. Gerard, J. Pestieau and J. Weyers, Phys. Lett. B429, 106 (1998), (hep-ph/9802361)
[6]L. Wolfenstein, hep-ph/0407344
[7]G. Calderon, J.M. Gerard, J. Pestieau and J. Weyers, Phys. Lett. B588, 81 (2004), (hep-ph/031163)
[8]A. Bornheim et al [CLEO Collaboration], Phys. Rev. D68, 052002 (2003), (hep-ex/0302026)
[9] Y. Chao et al [Belle Collaboration], Phys. Rev. D69, 111102 (2004), (hep-ex/0311061)
[10]B. Aubert et al [BaBar Collaboration], hep-ex/0508046
[11]B. Aubert et al [BaBar Collaboration], hep-ex/0408081
[12]B. Aubert et al [BaBar Collaboration], hep-ex/0408080
[13]B. Aubert et al [BaBar Collaboration], Phys. Rev. D71, 111102 (2005), (hep-ex/0503011)
[14] Y. Chao et al [Belle Collaboration], Phys. Rev. Lett. 94, 181803 (2005), (hep-ex/0408101)
[15]B. Aubert et al [BaBar Collaboration], Phys. Rev. Lett. 93, 131801 (2004), (hep-ex/0407057)
[16]S. Chen et al [CLEO Collaboration], Phys. Rev. Lett. 85, 525 (2000), (hep-ex/0001009)
[17] K. Abe et al [Belle Collaboration], hep-ex/0409049; hep-ex/0507045
[18]B. Aubert et al [BaBar Collaboration], Phys. Rev. Lett. 95, 151803 (2005), (hep-ex/0501071)
[19] K. Abe et al [Belle Collaboration], Phys. Rev. Lett. 95, 101801 (2005), (hep-ex/0502035)
[20]Heavy Flavor Averaging Group (HFAG), http://www.slac.standford.edu/xorg/hfag/ (hep-ex/0505100)
[21]A.J. Buras and R. Fleischer, Eur. Phys. J. C11, 93 (1999), (hep-ph/9810260)