Advantage of U+U over Au+Au collisions at constant beam energy
Abstract
Collisions of deformed uranium nuclei are studied in a Monte-Carlo Glauber model. For U+U at zero impact parameter () in the most favorable orientation (tip-to-tip), the transverse particle density (charged-particle rapidity density per weighted transverse area of the initial participant zone) increases by about 35% compared to Au+Au at . To estimate the advantage of U+U over Au+Au in the context of real experiments at the Relativistic Heavy Ion Collider, we examine the effect of a range of centrality cuts on the event sample. In terms of the transverse particle density, the predicted advantage of U+U is about 16%.
pacs:
25.75.-q,25.75.Ld,24.85.+pI Introduction
Large space-time volumes with the highest energy density to date, over 15 GeV/fm3 in typical estimatesGyulassy:2004zy , have been produced in GeV Au+Au collisions at the Relativistic Heavy Ion Collider (RHIC) Arsene:2004fa ; Adcox:2004mh ; Back:2004je ; Adams:2005dq . At such high energy densities, strongly interacting matter is predicted to be in a phase commonly referred to as quark-gluon plasma (QGP) Karsch:2004ti . A goal of the RHIC program is to study this phase in the extended systems created in relativistic collisions of heavy nuclei.
The presence of QGP manifests itself in the equation of state, which (together with the initial conditions) determines various measured properties and serves as an input to fluid-dynamical calculations. It is reasonable to expect that, barring calculational problems, the main features of the equation of state can be probed by comparing fluid-dynamically calculated quantities to data. It has been argued recently that the quark-gluon matter produced in 200 GeV central Au+Au collisions behaves as a perfect fluid with negligible viscosityHirano:2005wx ; Tannenbaum:2006ch . This conclusion was based in part on the agreement Adams:2005dq of the flow quantity (see Eqs. (1) and (2) for a definition) in central Au+Au with the prediction of an ideal-fluid calculation Kolb:2000sd . The data seem to indicate that the systems produced in 200 GeV central Au+Au collisions have just reached a large enough energy density in a sufficient space-time volume for the approximate agreement with the fluid-dynamical results. If energy density could be increased even further, a crucial test would be whether continues to grow, or whether it saturates at the value for an ideal fluid.
A promising avenue to increase the energy density and/or increase the volume of high-density matter without any increase in beam energy is to collide heavy deformed (prolate) nuclei. This has been proposed by several theorists Shuryak:1999by ; Li:1999be ; Heinz:2005xd . Central collisions with the long axes aligned with the beam (we call this the tip-to-tip configuration, as in Ref. Li:1999be ) would be the most desired configuration. However, as long as no beams of aligned deformed nuclei are available Fick:1981hq , the desired configurations have to be selected by experimenters using some combination of triggering and offline event selection. Recently, Heinz and Kuhlman advocated the use of full-overlap collisions between deformed uranium nuclei Heinz:2005xd . The selection of full-overlap collisions using Zero-Degree Calorimeters (ZDCs) was examined in Ref. Kuhlman:2005ts . However, various fluctuations and background signals in the detectors mean that an event sample with the lowest ZDC signal will still include a substantial fraction of collisions in which full overlap did not occur. In this work, we address these issues with the help of data on the relevant performance of the STAR detector STAR-NIM .
II Background and Calculational framework
The elliptic flow anisotropy , defined as the second Fourier coefficient in the expansion
| (1) |
of the azimuthal distribution of final state particles is a sensitive measure of the success of fluid-dynamical models. Based on suggestions in Refs. Heiselberg:1998es ; Sorge:1998mk ; Voloshin:1999gs it has become customary to consider , the elliptic flow scaled by the initial spatial eccentricity Voloshin:1999gs
| (2) |
The normalization by emphasizes that the final momentum anisotropy is driven by the initial geometry. One advantage of using is that the impact-parameter dependence is largely removed from its fluid-dynamically calculated value. This quantity is frequently plotted against the transverse particle density , where is the multiplicity of charged particles per unit rapidity and
| (3) |
is the transverse area of the overlap zone weighted by the number of wounded nucleons Heiselberg:1998es ; Alt:2003ab ; Adams:2005dq . The transverse particle density can be interpreted as a measure of the initial entropy density in the transverse plane Heinz:2005xd . An increase in this quantity means increased particle production, and is thus associated with an increase in energy density in the system. The charged particle multiplicity per unit rapidity can be increased by increasing the number of binary collisions, achievable by tip-to-tip collisions of heavy deformed nuclei. Furthermore, the U+U tip-to-tip configuration has about the same overlap area as Au+Au collisions at , and thus contributes to a further increase in beyond what would be obtained with hypothetical spherical nuclei of the same mass as uranium. On the other hand, for collisions, increases by 24% between Au+Au and U+U when the latter are in the body-to-body orientation, i.e., when the long axes of the nuclei are parallel to each other, but perpendicular to the beam. Thus it can be concluded that even in the experimentally unrealistic limit where full-overlap U+U collisions can be isolated, it is necessary to also distinguish between different full-overlap configurations in order to realize the full potential advantage of U+U collisions.
The RHIC data as a function of reach the perfect-fluid value of in the most central 200 GeV Au+Au collisions at around fm-2. Since viscosity would decrease the predicted , it would be difficult for a fluid-dynamical model to be reconciled with any further increase in the observed ratio . Thus, the behavior of this ratio at significantly larger should prove informative in assessing the applicability of fluid dynamics in central collisions at RHIC.
Uranium (238U) beams have been proposed as a way to increase Shuryak:1999by ; Li:1999be ; Heinz:2005xd . We assume in this study that, in order to isolate a sample of U+U collisions with the maximum possible , the best available experimental procedure is to select events where the fewest possible spectator neutrons are detected (low ZDC signal) in coincidence with the highest observed multiplicity of produced particles in a broad region centered on mid-rapidity. Available data from the STAR experiment STAR-NIM describe this correlation and its fluctuation from event to event, and allow the output from the Monte-Carlo Glauber model described below to be filtered appropriately to simulate the relevant experimental limitations.
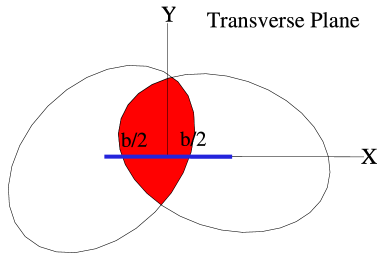
We represent the quadrupole deformation of the ground-state uranium nucleus in the standard Bohr:1969 way: we take a Saxon-Woods density distribution with surface thickness fm and with , where is the polar angle relative to the symmetry axis of the nucleus and fm Bohr:1969 . The small hexadecapole moment of the uranium nucleus is neglected. This yields Kolb:2000sd ; Shuryak:1999by ; Heinz:2005xd . The orientation of the first and second nucleus in the colliding pair is fixed by the two angles (, ) and (, ), respectively. The angles and describe the orientation of the symmetry axis relative to the beam direction, and they are uniformly distributed in [0, ]. The azimuthal angles and describe rotations about the beam direction, and they are uniformly distributed in [0, 2]. A schematic view of a cut in the transverse plane illustrates the collision geometry in Fig. 1, where the lines represent equivalent sharp surfaces, and the shaded area corresponds to the overlap region in a collision at impact parameter with fixed orientations of both nuclei.
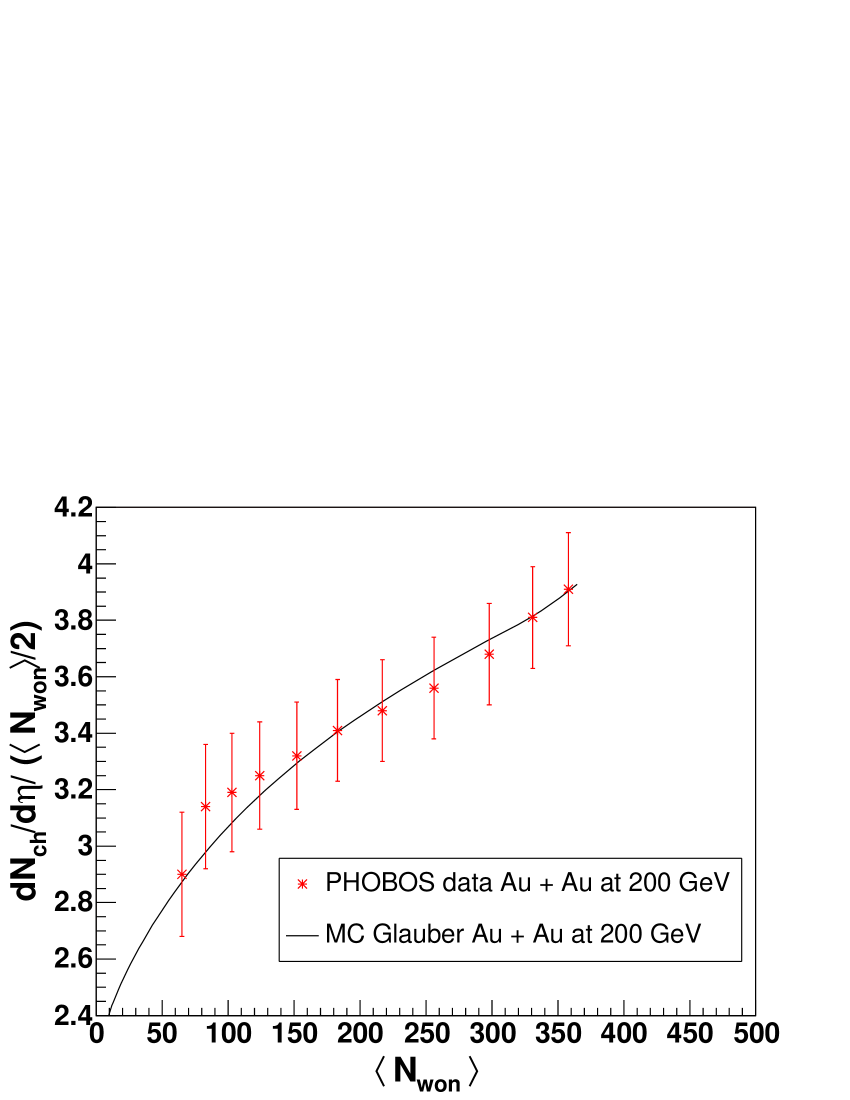
To simulate a uranium nucleus, 238 nucleons are selected randomly according to the appropriate Saxon-Woods distributions with distances between any two nucleons satisfying fm. In the collision process, nucleons are considered wounded if the transverse distance between them becomes fm, where we use 4.2 fm2 for the nucleon-nucleon cross section at 200 GeV. To convert between track densities in rapidity and in pseudorapidity , we use the approximation Adler:2002pu , and apply the parameterization
| (4) |
where is the numbers of binary collisions and is the number of wounded nucleons Kharzeev:2000ph . The values of the parameters used are and at 200 GeV. These values provide a reasonable fit to the PHOBOS data Back:2002uc as shown in Fig. 2.
III Results without and with detector smearing
III.1 No smearing
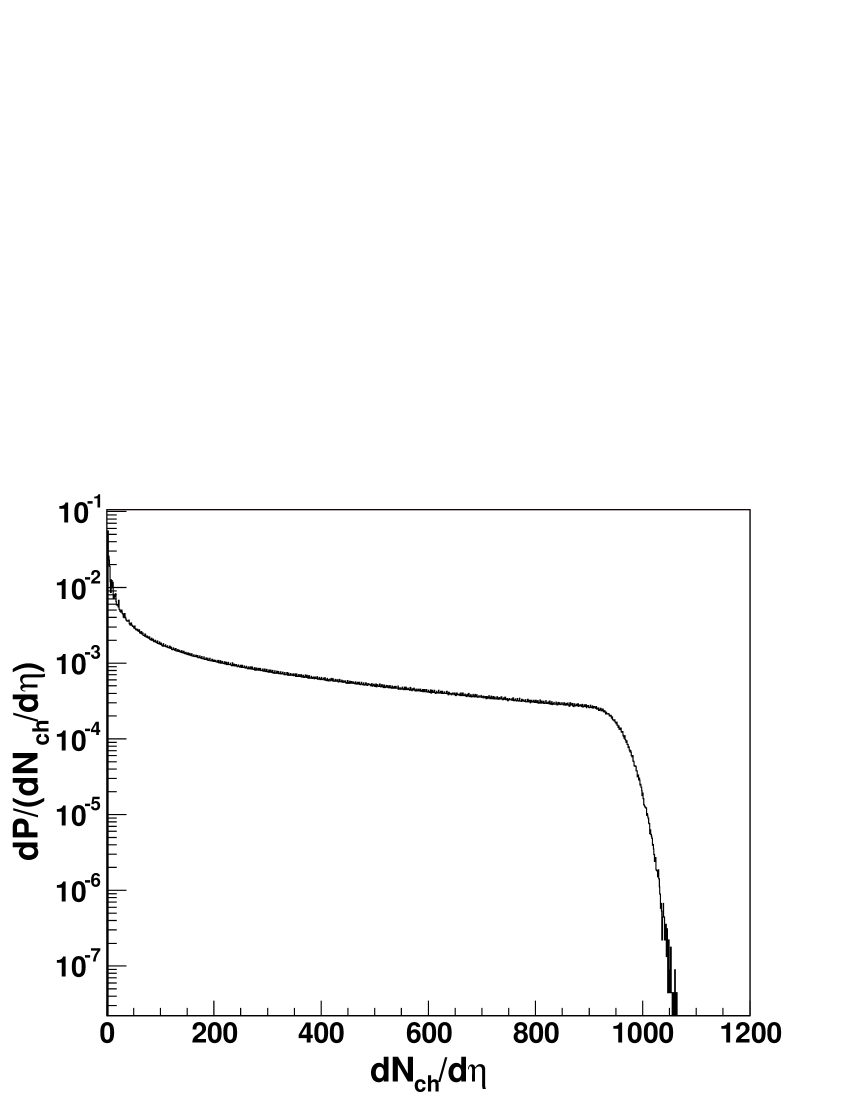
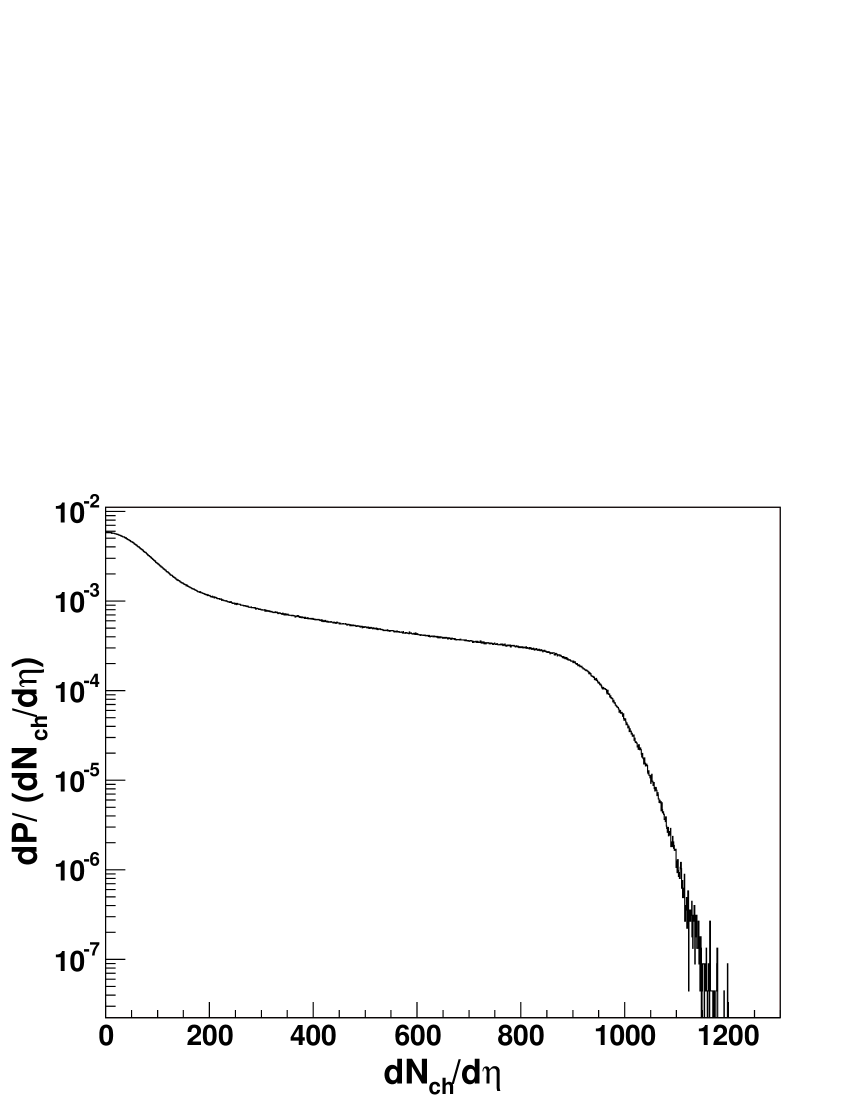
Figure 3 displays the charged multiplicity distribution for U+U collisions. Since we average over all possible orientations, this distribution is similar to that obtained for hypothetical spherical nuclei with mass 238.
For ideal tip-to-tip U+U collisions ( fm, = 0, = 0) we obtain 42.6 fm-2. For body-to-body collisions () we have 31.7 fm-2, surprisingly close to 31.5 fm-2, the value for Au+Au at fm.
Although is larger for U+U than for Au+Au, the larger overlap area for body-to-body collisions offsets the increase and results in a value of close to that for Au+Au. The approximately 35% increase in in tip-to-tip U+U collisions compared to Au+Au is due to the increase in , since the overlap areas are similar in these cases.
Under the best of circumstances, an experiment can hope to select certain ranges of angles and impact parameter. For illustrative purposes, we choose a somewhat arbitrary range of definitions for near tip-to-tip configurations: 1 or 2 fm, with and both within or , and for simplicity we keep throughout.
Even if we impose the strictest definition above for near tip-to-tip events ( and fm) and a similarly restrictive definition for near body-to-body collisions, almost all of the near tip-to-tip and near body-to-body events lie in the top 3% of the (or, equivalently ) distribution. For Au+Au collisions with in the top 3% of the event sample, the additional requirement that the number of spectator nucleons lie in the bottom 1% of its parent distribution leads to little or no further change in . For near tip-to-tip U+U configurations, there are significant increases of 32–36% over central Au+Au. Details related to various near tip-to-tip U+U selection conditions can be found in Table I, and as before, a spectator cut has negligible additional effect on . If a near body-to-body configuration is defined as fm, , and , then the mean value of comes out to be 31.3 fm-2, very close to the ideal body-to-body case mentioned above, and still negligibly different from the value for central Au+Au.
| spectator | 0 b 1 fm | 0 b 2 fm | |||
| count | evt | evt | |||
| any | 0.174 | 42.25 | 0.687 | 41.59 | |
| any | 0.707 | 41.75 | 2.756 | 41.13 | |
| lowest 1 | 0.173 | 42.26 | 0.478 | 41.95 | |
| lowest 1 | 0.704 | 41.76 | 1.903 | 41.50 | |
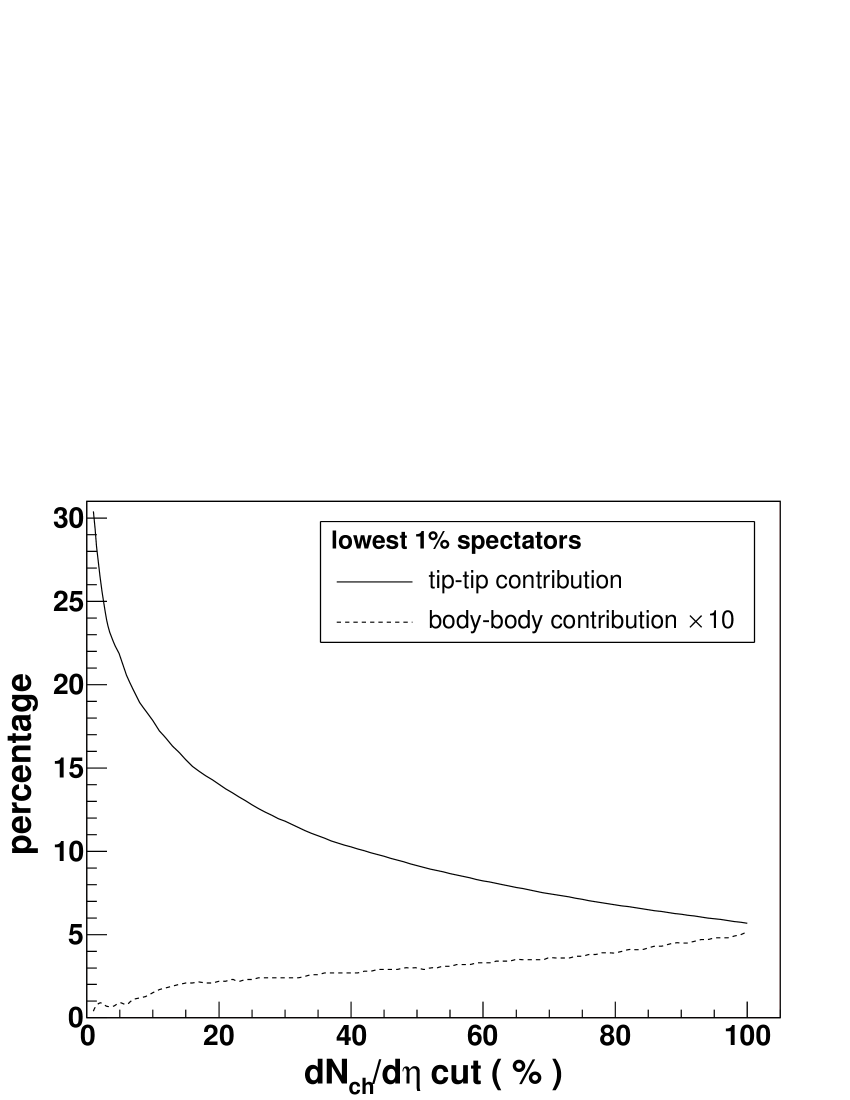
In the discussion above, central collisions were selected primarily via their high multiplicity. Next, we use a low spectator count as the initial centrality criterion, and explore the effect of an additional cut on total multiplicity. Results are presented in Fig. 4, and it is evident that the ratio of near tip-to-tip to near body-to-body events increases very substantially as more central collisions are selected. However, even for the 5% of collisions with highest multiplicity, the near tip-to-tip category remains only about 21% of the events with a low spectator count (the latter being defined as the lowest 1% of all collisions, regardless of multiplicity).
III.2 With smearing
In the previous section, we defined ranges of U+U collision configurations termed “near tip-to-tip” and “near body-to-body”. These ranges were defined for illustrative purposes only; in this section, we estimate the characteristics of a class of events intended to have the highest experimentally obtainable enrichment of the desired tip-to-tip configurations. We assume that this is carried out by selecting events with the highest charged particle multiplicity in a broad region centered on midrapidity, and simultaneously cutting to select events with a low signal in both Zero Degree Calorimeters.
The measured in a detector like STAR is linearly correlated with the true , but is subject to random event-to-event fluctuations in the efficiency for detecting tracks as well as random variations in the inclusion rate for tracks that do not originate from the primary collision vertex. Similarly, the ZDC signals have a component that is proportional to the number of emitted spectator neutrons as well as a component from various sources of background. Furthermore, the RHIC intersection regions are arranged such that the ZDCs have acceptance for only free neutrons and an insignificantly small fraction of neutron-rich charged spectator fragments. Thus while we compute the total number of spectator nucleons in a given event using our Monte Carlo Glauber model, in real collisions at STAR, only a subset of the spectators are detected by the ZDCs, and so events with a small ZDC signal include a high background level of collisions with incomplete overlap.
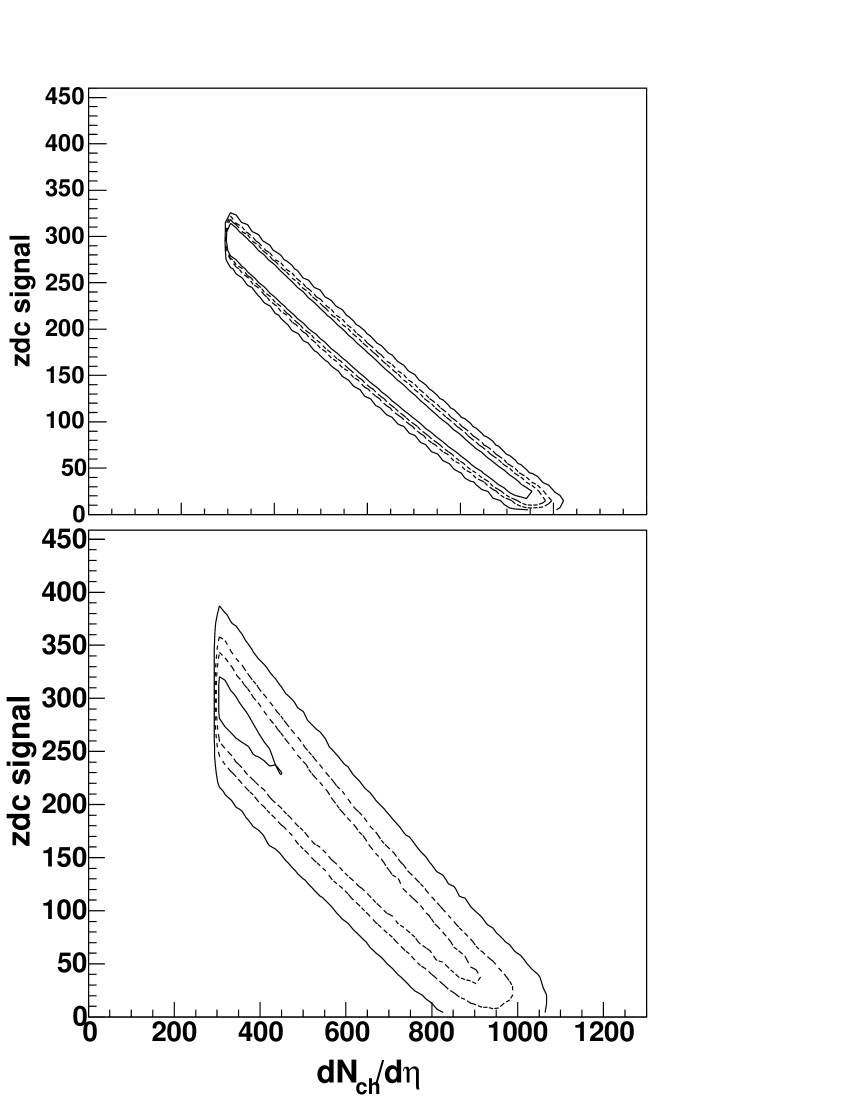
The upper panel of Fig. 5 shows contours of event density in the plane of spectator count versus from our Monte Carlo Glauber model without any detector simulation. The resulting correlation is much narrower than what is observed in experiment STAR-NIM , an expected outcome given the simplicity of the model and the neglect of the experimental effects discussed above. To make a realistic estimate of the best enrichment of tip-to-tip U+U collisions that might be achieved, it is necessary to smear out the narrow ridge in the upper panel of Fig. 5 so that a pattern resembling the experimental distribution is obtained. For this purpose, a Gaussian-distributed random number is first added to for each event, such that the steeply dropping upper tail of the distribution in Fig. 3 is smeared out to the point where it resembles the experimental distribution from STAR. The smeared multiplicity distribution is shown in Fig. 6. Note that we are concerned here with the upper end of the multiplicity distribution (highest values of ), and the variation of the smearing at lower multiplicities is not of interest.
Next, another Gaussian-distributed random number (with non-zero mean) is added to the spectator count and the result is used as the simulated ZDC signal. The Gaussian mean and width are adjusted to produce a ridge near the lower right part of the lower panel of Fig. 5 that resembles the observed data from STAR STAR-NIM . This procedure has a small effect on the agreement of the calculation with the PHOBOS data shown in Fig. 2, and while the effect is minimal, we corrected for the difference.
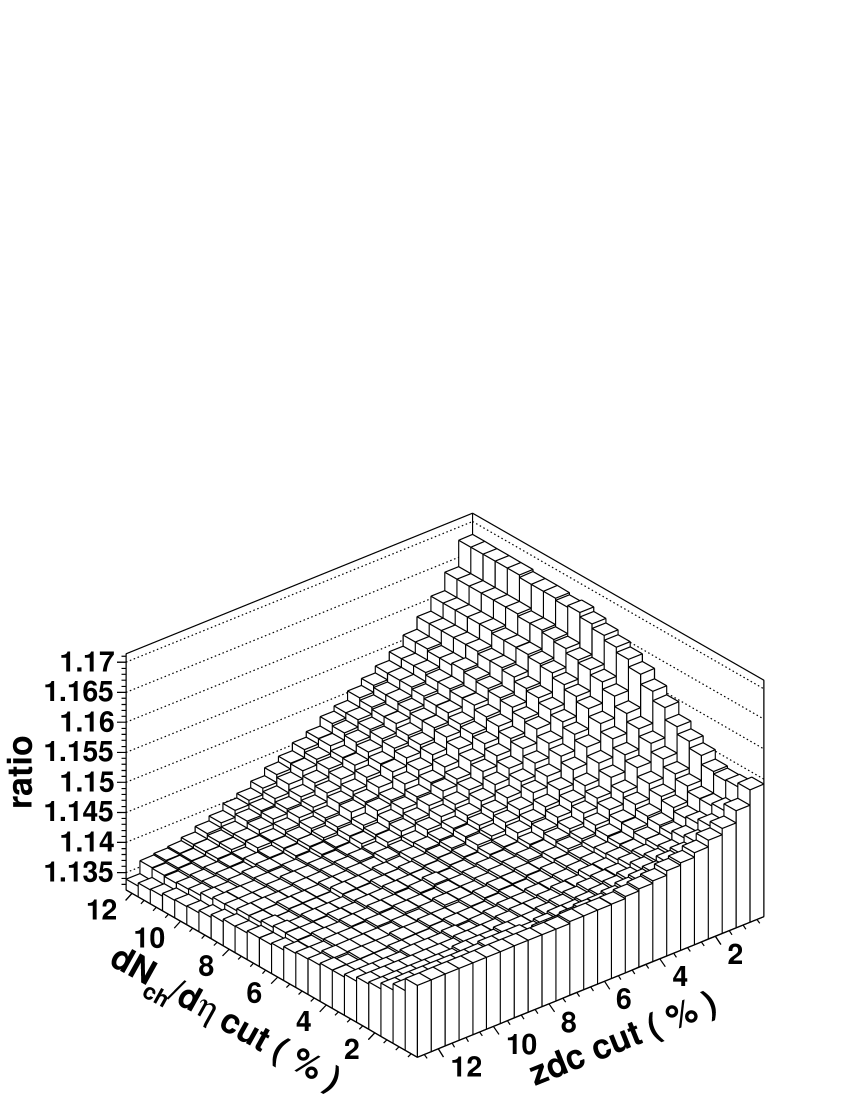
Various combinations of cuts in and in ZDC signal have been applied to the simulated U+U data plotted in the lower panel of Fig. 5 with the objective of maximizing the transverse particle density . Because the quantity we seek to maximize is trivially correlated with one of our cut variables, we assess the maximum particle density in U+U collisions relative to Au+Au collisions with the same cuts on a percentage basis.
The vertical axis in Fig. 7 shows the ratio as a function of independent scans across both cut variables. Note the zero-suppressed vertical axis; we conclude that no further increase in beyond about 18% relative to Au+Au can be reached in the context of our simulation, even searching beyond the plotted combinations of cuts on and ZDC signal. In the region of the most selective combination of centrality cuts, the advantage of U+U is about 16%.
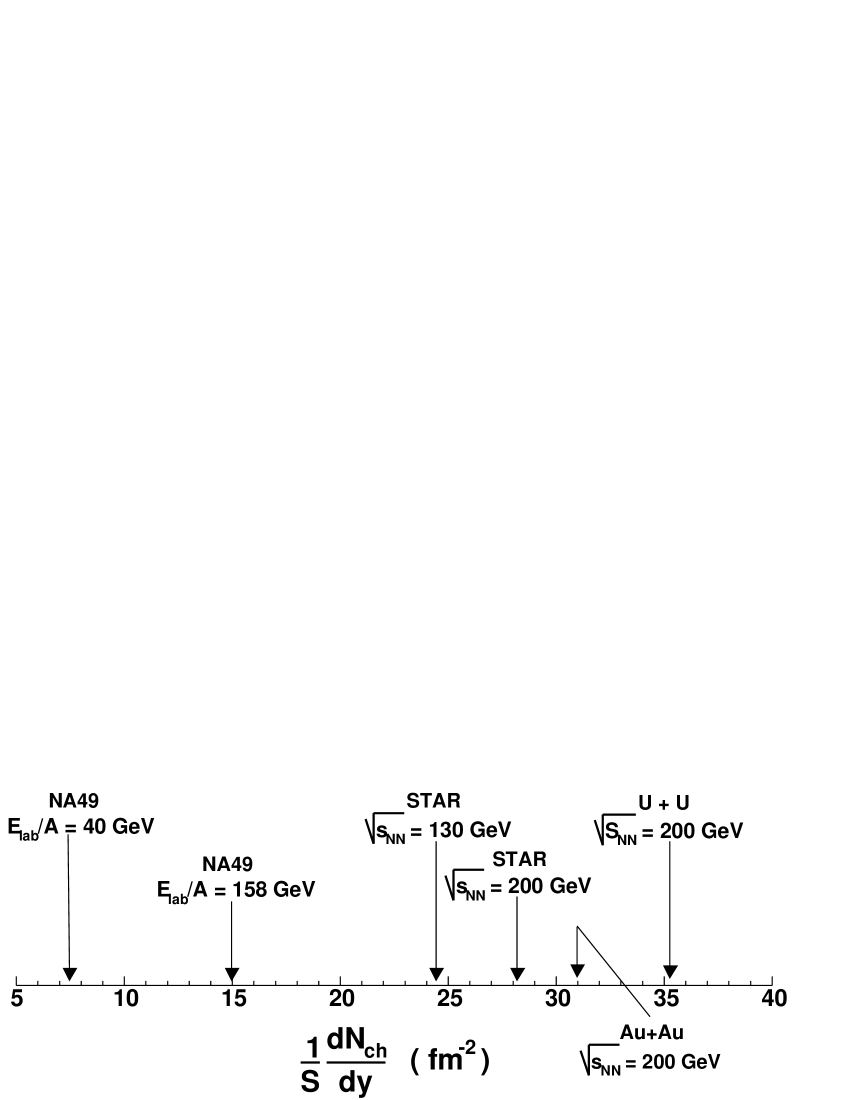
Figure 8 summarizes the measured progression in the maximum for central Pb+Pb or Au+Au collisions, beginning with a low SPS beam energy and continuing to the highest RHIC energy. On the same number line, we indicate that when our simulation for Au+Au is constrained to agree well with the value from the STAR collaboration, we predict a potential further increase of about 4 fm-2 for U+U with the same centrality cut. The calculated value of is larger than the STAR result for Au+Au at 200 GeV because of different parameterization of the nuclear radius and small uncertainties in the number of wounded nucleons. However, this has a negligible effect on the relative increase from Au+Au to U+U.
IV Conclusion
We have undertaken a study of the potential for U+U collisions to realize an increased transverse particle density without increasing the beam energy. We note that the present investigation addresses only a limited aspect of U+U collisions, namely, we have studied the “worst case scenario” where only the transverse particle density is of interest, and where the charged particle multiplicity and the Zero-Degree Calorimeter signals are the only means of selecting the desired U+U events. Previous studies have considered the issue of the path-dependent energy loss of partons in the unique participant geometry of central U+U collisions Shuryak:1999by ; Heinz:2005xd , and it is feasible for U+U collisions to extend our physics reach in a variety of observables.
The transverse particle density increases by about 35% in the ideal limit of tip-to-tip U+U collisions compared to Au+Au at zero impact parameter. However, the practical limitation of selecting the U+U samples of interest via conventional measures of centrality, as used in RHIC experiments, leads to uranium beams offering a smaller, yet still-worthwhile advantage. Specifically, our simulations suggest that the maximum achievable values of at RHIC could be increased from the present fm-2 to about 35 fm-2 with U+U collisions. This increase should justify the needed investment of effort and resources at RHIC, being of the same order as the measured increase for central Au+Au collisions when the beam energy was increased from = 130 GeV to 200 GeV, or just under half the increase between the top CERN SPS energy and = 130 GeV.
V Acknowledgments
We thank Ulrich Heinz, Anthony Kuhlman, and Peter Levai for extensive discussions. One of the authors (GF) acknowledges the support of a Szent-Györgyi Scholarship of the Hungarian Department of Education and the hospitality of the Eötvös University, where some of this work was carried out. This work was supported in part by US DOE grants DE-FG02-86ER40251 and DE-FG02-89ER40531.
References
- (1) M. Gyulassy and L. McLerran, Nucl. Phys. A 750, 30 (2005) [arXiv:nucl-th/0405013].
- (2) I. Arsene et al. [BRAHMS Collaboration], Nucl. Phys. A 757, 1 (2005) [arXiv:nucl-ex/0410020].
- (3) K. Adcox et al. [PHENIX Collaboration], Nucl. Phys. A 757, 184 (2005) [arXiv:nucl-ex/0410003].
- (4) B. B. Back et al., Nucl. Phys. A 757, 28 (2005) [arXiv:nucl-ex/0410022].
- (5) J. Adams et al. [STAR Collaboration], Nucl. Phys. A 757, 102 (2005) [arXiv:nucl-ex/0501009].
- (6) F. Karsch, Prog. Theor. Phys. Suppl. 153, 106 (2004) [arXiv:hep-lat/0401031].
- (7) T. Hirano and M. Gyulassy, arXiv:nucl-th/0506049.
- (8) M. J. Tannenbaum, arXiv:nucl-ex/0603003.
- (9) P. F. Kolb, J. Sollfrank and U. W. Heinz, Phys. Rev. C 62, 054909 (2000) [arXiv:hep-ph/0006129].
- (10) E. V. Shuryak, Phys. Rev. C 61, 034905 (2000) [arXiv:nucl-th/9906062].
- (11) B. A. Li, Phys. Rev. C 61, 021903 (2000) [arXiv:nucl-th/9910030].
- (12) U. W. Heinz and A. Kuhlman, Phys. Rev. Lett. 94, 132301 (2005).
- (13) D. Fick, J. Phys. (Paris) Colloq. C6, 265 (1990).
- (14) A. J. Kuhlman and U. W. Heinz, Phys. Rev. C 72, 037901 (2005) [arXiv:nucl-th/0506088].
- (15) K. H. Ackermann et al. [STAR Collaboration], Nucl. Instrum. Meth. A 499, 624 (2003); F. S. Bieser et al., Nucl. Instrum. Meth. A 499, 766 (2003); C. Adler, A. Denisov, E. Garcia, M. Murray, H. Stroebele and S. White, Nucl. Instrum. Meth. A 499, 433 (2003).
- (16) H. Heiselberg and A. M. Levy, Phys. Rev. C 59, 2716 (1999) [arXiv:nucl-th/9812034].
- (17) H. Sorge, Phys. Rev. Lett. 82, 2048 (1999) [arXiv:nucl-th/9812057].
- (18) S. A. Voloshin and A. M. Poskanzer, Phys. Lett. B 474, 27 (2000) [arXiv:nucl-th/9906075].
- (19) C. Alt et al. [NA49 Collaboration], Phys. Rev. C 68, 034903 (2003) [arXiv:nucl-ex/0303001].
- (20) A. Bohr and B. R. Mottelson, Nuclear Structure, Vol. I, page 161 and Vol. II, page 133 (Benjamin, New York, 1969).
- (21) C. Adler et al. [STAR Collaboration], Phys. Rev. C 66, 034904 (2002) [arXiv:nucl-ex/0206001].
- (22) D. Kharzeev and M. Nardi, Phys. Lett. B 507, 121 (2001) [arXiv:nucl-th/0012025].
- (23) B. B. Back et al. [PHOBOS Collaboration], Phys. Rev. C 65, 061901 (2002) [arXiv:nucl-ex/0201005].