On the Discrepancy of p​p𝑝𝑝pp, p¯​p¯𝑝𝑝\bar{p}p Total Cross Sections at s=1.8𝑠1.8\sqrt{s}=1.8TeV between E710, E811 and CDF

Keiji Igi and Muneyuki Ishidaa Theoretical Physics LaboratoryTheoretical Physics Laboratory RIKEN RIKEN Wako Wako Saitama 351-0198 Saitama 351-0198 Japan
aDepartment of Physics Japan
aDepartment of Physics School of Science and Engineering School of Science and Engineering Meisei University Meisei University Hino Hino Tokyo 191-8506 Tokyo 191-8506 Japan Japan
Abstract

Based on the previous approach, we have investigated a possibility to resolve the discrepancy between the E710, E811 and CDF at s=1.8𝑠1.8\sqrt{s}=1.8TeV, using the experimental data of the p​p𝑝𝑝pp, p¯​p¯𝑝𝑝\bar{p}p total cross sections Οƒtot(+)superscriptsubscript𝜎tot\sigma_{\rm tot}^{(+)} and ρ(+)superscript𝜌\rho^{(+)} ratio up to the SPS experiments (s=0.9𝑠0.9\sqrt{s}=0.9TeV) as inputs. We predict Οƒtotp¯​psuperscriptsubscript𝜎tot¯𝑝𝑝\sigma_{\rm tot}^{\bar{p}p} and ρp¯​psuperscriptπœŒΒ―π‘π‘\rho^{\bar{p}p} at the Tevatron energy (s=1.8𝑠1.8\sqrt{s}=1.8TeV) as Οƒtotp¯​p=75.9Β±1.0superscriptsubscript𝜎tot¯𝑝𝑝plus-or-minus75.91.0\sigma_{\rm tot}^{\bar{p}p}=75.9\pm 1.0mb, ρp¯​p=0.136Β±0.005superscriptπœŒΒ―π‘π‘plus-or-minus0.1360.005\rho^{\bar{p}p}=0.136\pm 0.005.

It turns out that only the data of E710 is consistent with the prediction in the one standard deviation. So we can conclude that E710 is preferable but we can exclude neither CDF nor E811 results.

1 Introduction

Recently[1], we have searched for the simultaneous best fit of the average of p¯​p¯𝑝𝑝\bar{p}p, p​p𝑝𝑝pp total cross sections( Οƒtot(+)superscriptsubscript𝜎tot\sigma_{\rm tot}^{(+)} ), and the ratio of the real to imaginary part of the forward scattering amplitude( ρ(+)superscript𝜌\rho^{(+)} ) for 70GeV << Pl​a​bsubscriptπ‘ƒπ‘™π‘Žπ‘P_{lab} << Pl​a​r​g​esubscriptπ‘ƒπ‘™π‘Žπ‘Ÿπ‘”π‘’P_{large} as inputs in terms of high-energy parameters c0subscript𝑐0c_{0}, c1subscript𝑐1c_{1}, c2subscript𝑐2c_{2} and Ξ²Pβ€²subscript𝛽superscript𝑃′\beta_{P^{\prime}} constrained by the FESR with N(≃10N(\simeq 10GeV). Block and Halzen[2, 3] also reached to the similar conclusions independently based on duality in a different approach. We first chose Pl​a​r​g​e=2100subscriptπ‘ƒπ‘™π‘Žπ‘Ÿπ‘”π‘’2100P_{large}=2100GeV corresponding to the ISR region( s≃60similar-to-or-equals𝑠60\sqrt{s}\simeq 60GeV ). Secondly we chose Pl​a​r​g​e=2Γ—106subscriptπ‘ƒπ‘™π‘Žπ‘Ÿπ‘”π‘’2superscript106P_{large}=2\times 10^{6}GeV corresponding to the Tevatron energy( s≃2similar-to-or-equals𝑠2\sqrt{s}\simeq 2TeV ). We then predicted Οƒtot(+)superscriptsubscript𝜎tot\sigma_{\rm tot}^{(+)} and ρ(+)superscript𝜌\rho^{(+)} at the LHC and the high-energy cosmic-ray energy regions. It turned out that the prediction of Οƒtot(+)superscriptsubscript𝜎tot\sigma_{\rm tot}^{(+)} agrees with p​p𝑝𝑝pp experimental data at the cosmic-ray regions[4, 5, 6] within errors in the first case( ISR ). It has to be noted that the energy range of predicted Οƒtot(+)superscriptsubscript𝜎tot\sigma_{\rm tot}^{(+)}, ρ(+)superscript𝜌\rho^{(+)} is several orders of magnitude larger than the energy regions of Οƒtot(+)superscriptsubscript𝜎tot\sigma_{\rm tot}^{(+)}, ρ(+)superscript𝜌\rho^{(+)} input. If we use data up to Tevatron( the second case ), the situation has been much improved although there are some systematic uncertainty coming from discrepancy of the data between E710[7], E811[8] and CDF[9] at s=1.8𝑠1.8\sqrt{s}=1.8TeV[1]. Finally we concluded that the precise measurements of Οƒtotp​psuperscriptsubscript𝜎tot𝑝𝑝\sigma_{\rm tot}^{pp} in the coming LHC experiments will resolve this discrepancy at s=1.8𝑠1.8\sqrt{s}=1.8TeV.

The purpose of this paper is to investigate a possibility to resolve this discrepancy using the experimental data of Οƒtot(+)superscriptsubscript𝜎tot\sigma_{\rm tot}^{(+)} and ρ(+)superscript𝜌\rho^{(+)} up to the SPS experiments (s=0.9𝑠0.9\sqrt{s}=0.9TeV).

2 The general approach

As in the previous paper[1], let us first consider the crossing-even forward scattering amplitude defined by

F(+)​(Ξ½)superscript𝐹𝜈\displaystyle F^{(+)}(\nu) =\displaystyle= fp¯​p​(Ξ½)+fp​p​(Ξ½)2withI​m​F(+)​(Ξ½)=k​σtot(+)​(Ξ½)4​π.superscriptπ‘“Β―π‘π‘πœˆsuperscriptπ‘“π‘π‘πœˆ2withπΌπ‘šsuperscriptπΉπœˆπ‘˜subscriptsuperscript𝜎tot𝜈4πœ‹\displaystyle\frac{f^{\bar{p}p}(\nu)+f^{pp}(\nu)}{2}\ \ {\rm with}\ \ Im\ F^{(+)}(\nu)=\frac{k\ \sigma^{(+)}_{\rm tot}(\nu)}{4\pi}\ . (1)

We also assume

I​m​F(+)​(Ξ½)πΌπ‘šsuperscript𝐹𝜈\displaystyle Im\ F^{(+)}(\nu) =\displaystyle= I​m​R​(Ξ½)+I​m​FP′​(Ξ½)πΌπ‘šπ‘…πœˆπΌπ‘šsubscript𝐹superscriptπ‘ƒβ€²πœˆ\displaystyle Im\ R(\nu)+Im\ F_{P^{\prime}}(\nu) (2)
=\displaystyle= Ξ½M2​(c0+c1​log​νM+c2​log2​νM)+Ξ²Pβ€²M​(Ξ½M)Ξ±Pβ€²πœˆsuperscript𝑀2subscript𝑐0subscript𝑐1logπœˆπ‘€subscript𝑐2superscriptlog2πœˆπ‘€subscript𝛽superscript𝑃′𝑀superscriptπœˆπ‘€subscript𝛼superscript𝑃′\displaystyle\frac{\nu}{M^{2}}\left(c_{0}+c_{1}{\rm log}\frac{\nu}{M}+c_{2}{\rm log}^{2}\frac{\nu}{M}\right)+\frac{\beta_{P^{\prime}}}{M}\left(\frac{\nu}{M}\right)^{\alpha_{P^{\prime}}}\ \ \ \ \

at high energies (Ξ½>Nπœˆπ‘\nu>N). It is to be noted that c0subscript𝑐0c_{0}, c1subscript𝑐1c_{1}, c2subscript𝑐2c_{2} and Ξ²Pβ€²subscript𝛽superscript𝑃′\beta_{P^{\prime}} are dimensionless. We have defined the functions R​(Ξ½)π‘…πœˆR(\nu) and FP′​(Ξ½)subscript𝐹superscriptπ‘ƒβ€²πœˆF_{P^{\prime}}(\nu) by replacing ΞΌπœ‡\mu by M in Eq.Β (3) of ref.Β \citen[6]. Here, M𝑀M is the proton( anti-proton) mass and Ξ½,kπœˆπ‘˜\nu,\ k are the incident proton(anti-proton) energy, momentum in the laboratory system, respectively.

Since the amplitude is crossing-even, we have

R​(Ξ½)π‘…πœˆ\displaystyle R(\nu) =\displaystyle= i​ν2​M2{2c0+c2Ο€2+c1(logeβˆ’i​π​νM+logΞ½M)\displaystyle\frac{i\nu}{2M^{2}}\left\{2c_{0}+c_{2}\pi^{2}+c_{1}\left({\rm log}\frac{e^{-i\pi}\nu}{M}+{\rm log}\frac{\nu}{M}\right)\right. (3)
+c2(log2eβˆ’i​π​νM+log2Ξ½M)},\displaystyle\left.+c_{2}\left({\rm log}^{2}\frac{e^{-i\pi}\nu}{M}+{\rm log}^{2}\frac{\nu}{M}\right)\right\}\ ,\ \ \ \ \ \ \
FP′​(Ξ½)subscript𝐹superscriptπ‘ƒβ€²πœˆ\displaystyle F_{P^{\prime}}(\nu) =\displaystyle= βˆ’Ξ²Pβ€²M​((eβˆ’i​π​ν/M)Ξ±Pβ€²+(Ξ½/M)Ξ±Pβ€²sin​π​αPβ€²),subscript𝛽superscript𝑃′𝑀superscriptsuperscriptπ‘’π‘–πœ‹πœˆπ‘€subscript𝛼superscript𝑃′superscriptπœˆπ‘€subscript𝛼superscript𝑃′sinπœ‹subscript𝛼superscript𝑃′\displaystyle-\frac{\beta_{P^{\prime}}}{M}\left(\frac{(e^{-i\pi}\nu/M)^{\alpha_{P^{\prime}}}+(\nu/M)^{\alpha_{P^{\prime}}}}{{\rm sin}\pi\alpha_{P^{\prime}}}\right), (4)

and subsequently obtain

R​e​R​(Ξ½)π‘…π‘’π‘…πœˆ\displaystyle Re\ R(\nu) =\displaystyle= π​ν2​M2​(c1+2​c2​log​νM),πœ‹πœˆ2superscript𝑀2subscript𝑐12subscript𝑐2logπœˆπ‘€\displaystyle\frac{\pi\nu}{2M^{2}}\left(c_{1}+2c_{2}{\rm log}\frac{\nu}{M}\right)\ ,\ \ \ (5)
R​e​FP′​(Ξ½)𝑅𝑒subscript𝐹superscriptπ‘ƒβ€²πœˆ\displaystyle Re\ F_{P^{\prime}}(\nu) =\displaystyle= βˆ’Ξ²Pβ€²M​(Ξ½M)0.5,subscript𝛽superscript𝑃′𝑀superscriptπœˆπ‘€0.5\displaystyle-\frac{\beta_{P^{\prime}}}{M}\left(\frac{\nu}{M}\right)^{0.5}\ ,\ \ \ (6)

substituting Ξ±Pβ€²=12subscript𝛼superscript𝑃′12\alpha_{P^{\prime}}=\frac{1}{2} in Eq.Β (4).

FESR: The FESR corresponding to n=1𝑛1n=1 [11, 12] is:

∫0Mν​I​m​F(+)​(Ξ½)​𝑑ν+14β€‹Ο€β€‹βˆ«0NΒ―k2​σtot(+)​(k)​𝑑ksuperscriptsubscript0π‘€πœˆπΌπ‘šsuperscript𝐹𝜈differential-d𝜈14πœ‹superscriptsubscript0¯𝑁superscriptπ‘˜2superscriptsubscript𝜎totπ‘˜differential-dπ‘˜\displaystyle\int_{0}^{M}\nu Im\ F^{(+)}(\nu)d\nu+\frac{1}{4\pi}\int_{0}^{\overline{N}}k^{2}\sigma_{\rm tot}^{(+)}(k)dk
=∫0Nν​I​m​R​(Ξ½)​𝑑ν+∫0Nν​I​m​FP′​(Ξ½)​𝑑ν.absentsuperscriptsubscript0π‘πœˆπΌπ‘šπ‘…πœˆdifferential-d𝜈superscriptsubscript0π‘πœˆπΌπ‘šsubscript𝐹superscriptπ‘ƒβ€²πœˆdifferential-d𝜈\displaystyle=\int_{0}^{N}\nu Im\ R(\nu)d\nu+\int_{0}^{N}\nu Im\ F_{P^{\prime}}(\nu)d\nu\ \ \ .\ \ \ (7)

We call Eq.Β (7) as the FESR which we use in our analysis.

The ρ(+)superscript𝜌\rho^{(+)} ratio: The ρ(+)superscript𝜌\rho^{(+)} ratio, the ratio of the real to imaginary part of F(+)​(Ξ½)superscript𝐹𝜈F^{(+)}(\nu) was obtained from Eqs.Β (2), (5) and (6) as

ρ(+)​(Ξ½)superscript𝜌𝜈\displaystyle\rho^{(+)}(\nu) =\displaystyle= R​e​F(+)​(Ξ½)I​m​F(+)​(Ξ½)=R​e​R​(Ξ½)+R​e​FP′​(Ξ½)I​m​R​(Ξ½)+I​m​FP′​(Ξ½)𝑅𝑒superscriptπΉπœˆπΌπ‘šsuperscriptπΉπœˆπ‘…π‘’π‘…πœˆπ‘…π‘’subscript𝐹superscriptπ‘ƒβ€²πœˆπΌπ‘šπ‘…πœˆπΌπ‘šsubscript𝐹superscriptπ‘ƒβ€²πœˆ\displaystyle\frac{Re\ F^{(+)}(\nu)}{Im\ F^{(+)}(\nu)}=\frac{Re\ R(\nu)+Re\ F_{P^{\prime}}(\nu)}{Im\ R(\nu)+Im\ F_{P^{\prime}}(\nu)} (8)
=\displaystyle= π​ν2​M2​(c1+2​c2​log​νM)βˆ’Ξ²Pβ€²M​(Ξ½M)0.5k​σtot(+)​(Ξ½)4​π.πœ‹πœˆ2superscript𝑀2subscript𝑐12subscript𝑐2logπœˆπ‘€subscript𝛽superscript𝑃′𝑀superscriptπœˆπ‘€0.5π‘˜superscriptsubscript𝜎tot𝜈4πœ‹\displaystyle\frac{\frac{\pi\nu}{2M^{2}}\left(c_{1}+2c_{2}{\rm log}\frac{\nu}{M}\right)-\frac{\beta_{P^{\prime}}}{M}\left(\frac{\nu}{M}\right)^{0.5}}{\frac{k\sigma_{\rm tot}^{(+)}(\nu)}{4\pi}}\ .\ \ \

Although the numerator of Eq.Β (8) becomes large for large values of ν𝜈\nu, a real constant has to be introduced in principle since the dispersion relation for R​e​F(+)​(Ξ½)𝑅𝑒superscript𝐹𝜈Re~{}F^{(+)}(\nu) requires a single subtraction constant F(+)​(0)superscript𝐹0F^{(+)}(0)[13, 2]. So, we also add F(+)​(0)superscript𝐹0F^{(+)}(0) in the numerator as

ρ(+)​(Ξ½)superscript𝜌𝜈\displaystyle\rho^{(+)}(\nu) =\displaystyle= π​ν2​M2​(c1+2​c2​log​νM)βˆ’Ξ²Pβ€²M​(Ξ½M)0.5+F(+)​(0)k​σtot(+)​(Ξ½)4​π.πœ‹πœˆ2superscript𝑀2subscript𝑐12subscript𝑐2logπœˆπ‘€subscript𝛽superscript𝑃′𝑀superscriptπœˆπ‘€0.5superscript𝐹0π‘˜superscriptsubscript𝜎tot𝜈4πœ‹\displaystyle\frac{\frac{\pi\nu}{2M^{2}}\left(c_{1}+2c_{2}{\rm log}\frac{\nu}{M}\right)-\frac{\beta_{P^{\prime}}}{M}\left(\frac{\nu}{M}\right)^{0.5}+F^{(+)}(0)}{\frac{k\sigma_{\rm tot}^{(+)}(\nu)}{4\pi}}\ .\ \ \ (9)

As will be discussed in the Appendix, the introduction of this constant slightly modifies the value of ρ(+)​(Ξ½)superscript𝜌𝜈\rho^{(+)}(\nu) although it will not affect the value of Οƒtot(+)superscriptsubscript𝜎tot\sigma_{\rm tot}^{(+)}. So, we use the Eq.Β (9) as the value of ρ(+)​(Ξ½)superscript𝜌𝜈\rho^{(+)}(\nu) in this analysis.

The FESR, Eq.Β (7), has some problem. i.e., there are the so-called unphysical regions coming from boson poles below the p¯​p¯𝑝𝑝\bar{p}p threshold. So, the contributions from unphysical regions of the first term of the right-hand side of Eq.Β (7) have to be calculated. These contributions can be estimated to be an order of 0.1% compared with the second term.[1] Thus, it can easily be neglected.

Therefore, the FESR, the formula of Οƒtot(+)superscriptsubscript𝜎tot\sigma_{\rm tot}^{(+)}(Eqs.Β (1) and (2)) and the ρ(+)superscript𝜌\rho^{(+)} ratio (Eq.Β (9)) are our starting points. Armed with the FESR, we express high-energy parameters c0,c1,c2,Ξ²Pβ€²subscript𝑐0subscript𝑐1subscript𝑐2subscript𝛽superscript𝑃′c_{0},c_{1},c_{2},\beta_{P^{\prime}} in terms of the integral of total cross sections up to N𝑁N. Using this FESR as a constraint for Ξ²Pβ€²=Ξ²P′​(c0,c1,c2)subscript𝛽superscript𝑃′subscript𝛽superscript𝑃′subscript𝑐0subscript𝑐1subscript𝑐2\beta_{P^{\prime}}=\beta_{P^{\prime}}(c_{0},c_{1},c_{2}), there are four independent parameters including F(+)​(0)superscript𝐹0F^{(+)}(0). We then search for the simultaneous best fit to the data points of Οƒtot(+)​(k)superscriptsubscript𝜎totπ‘˜\sigma_{\rm tot}^{(+)}(k) and ρ(+)​(k)superscriptπœŒπ‘˜\rho^{(+)}(k) for 70GeV≀k≀Pl​a​r​g​eabsentπ‘˜subscriptπ‘ƒπ‘™π‘Žπ‘Ÿπ‘”π‘’\leq k\leq P_{large} corresponding to the SPS energy (Pl​a​r​g​e≃0.43Γ—106similar-to-or-equalssubscriptπ‘ƒπ‘™π‘Žπ‘Ÿπ‘”π‘’0.43superscript106P_{large}\simeq 0.43\times 10^{6}GeV (s=0.9𝑠0.9\sqrt{s}=0.9TeV)), to determine the values of c0,c1,c2subscript𝑐0subscript𝑐1subscript𝑐2c_{0},c_{1},c_{2} and F(+)​(0)superscript𝐹0F^{(+)}(0) giving the least Ο‡2superscriptπœ’2\chi^{2}. We thus predict the Οƒtotsubscript𝜎tot\sigma_{\rm tot} and ρ(+)superscript𝜌\rho^{(+)} in the Tevatron energy region (s=1.8𝑠1.8\sqrt{s}=1.8TeV).

3 Predictions for Οƒtot(+)superscriptsubscript𝜎tot\sigma_{\rm tot}^{(+)} and ρ(+)superscript𝜌\rho^{(+)} at s=1.8𝑠1.8\sqrt{s}=1.8TeV

Using the data up to s=0.9𝑠0.9\sqrt{s}=0.9TeV ( SPS ), we predict Οƒtot(+)superscriptsubscript𝜎tot\sigma_{\rm tot}^{(+)} and ρ(+)superscript𝜌\rho^{(+)} at the Tevatron energy ( s=1.8𝑠1.8\sqrt{s}=1.8TeV ).

Analysis 1:Β Β Β  As was explained in the general approach (Β§2), both Οƒtot(+)superscriptsubscript𝜎tot\sigma_{\rm tot}^{(+)} and R​e​F(+)𝑅𝑒superscript𝐹Re~{}F^{(+)} data in 70GeV<k<Pl​a​r​g​e=4.3Γ—105GeV(s=0.9TeV70{\rm GeV}<k<P_{large}=4.3\times 10^{5}{\rm GeV}(\sqrt{s}=0.9{\rm TeV} ) are fitted simultaneously through the formula of Οƒtot(+)superscriptsubscript𝜎tot\sigma_{\rm tot}^{(+)} ( Eqs.Β (1) and (2)) and the ρ(+)superscript𝜌\rho^{(+)} ratio ( Eq.Β (9)) with the FESR ( Eq.Β (7)) as a constraint.

The Οƒtot(+)​(k)superscriptsubscript𝜎totπ‘˜\sigma_{\rm tot}^{(+)}(k) data points are obtained by averaging Οƒtotp¯​psubscriptsuperscriptπœŽΒ―π‘π‘tot\sigma^{\bar{p}p}_{\rm tot} and Οƒtotp​psubscriptsuperscriptπœŽπ‘π‘tot\sigma^{pp}_{\rm tot} data points[14] when they are listed at the same value of kπ‘˜k. For the details of data treatment of Οƒtot(+)superscriptsubscript𝜎tot\sigma_{\rm tot}^{(+)} and R​e​F(+)𝑅𝑒superscript𝐹Re~{}F^{(+)}, see ref.Β \citen[1]. The FESR gives us

8.878.87\displaystyle 8.87 =\displaystyle= c0+2.04​c1+4.26​c2+0.367​βPβ€²subscript𝑐02.04subscript𝑐14.26subscript𝑐20.367subscript𝛽superscript𝑃′\displaystyle c_{0}+2.04c_{1}+4.26c_{2}+0.367\beta_{P^{\prime}} (10)

(Eq.Β (12) of ref.Β \citen[1]), where we use the central value of 14β€‹Ο€β€‹βˆ«0NΒ―k2​σtot(+)​(k)=3403Β±2014πœ‹superscriptsubscript0¯𝑁superscriptπ‘˜2superscriptsubscript𝜎totπ‘˜plus-or-minus340320\frac{1}{4\pi}\int_{0}^{\overline{N}}k^{2}\sigma_{\rm tot}^{(+)}(k)=3403\pm 20GeV111 This value is obtained by numerically integrating the experimental k2​σtot(+)=k2​(Οƒtotp¯​p+Οƒtotp​p)/2superscriptπ‘˜2superscriptsubscript𝜎totsuperscriptπ‘˜2superscriptsubscript𝜎tot¯𝑝𝑝superscriptsubscript𝜎tot𝑝𝑝2k^{2}\sigma_{\rm tot}^{(+)}=k^{2}(\sigma_{\rm tot}^{\bar{p}p}+\sigma_{\rm tot}^{pp})/2. See, ref.Β \citen[1] for details. for NΒ―=10¯𝑁10\overline{N}=10GeV in Eq.Β (7).

The result of the fit is shown in Fig.Β 1. The values of parameters and resulting Ο‡2superscriptπœ’2\chi^{2} are given in Tables 1 and 2, respectively.

Refer to caption
Figure 1: Predictions for Οƒ(+)superscript𝜎\sigma^{(+)} and ρ(+)superscript𝜌\rho^{(+)} in terms of the Analysis 1. The fit is done for the data up to SPS energy, in the region 70GeV≀\leq kπ‘˜k ≀\leq 4.3Γ—1054.3superscript1054.3\times 10^{5}GeV(11.5GeV ≀s≀absent𝑠absent\leq\sqrt{s}\leq 0.9TeV) which is shown by the arrow. Total cross section Οƒtot(+)subscriptsuperscript𝜎tot\sigma^{(+)}_{\rm tot} in (a) all energy region, versus logPl​a​b10/{}_{10}P_{lab}/GeV, (b) low energy region (up to ISR energy), versus Pl​a​b/P_{lab}/GeV and (c) high energy (Tevatron-collider, LHC and cosmic-ray energy) region, versus center of mass energy Ec​msubscriptπΈπ‘π‘šE_{cm} in TeV unit. (d) gives the ρ(+)(=R​e​F(+)/I​m​F(+))annotatedsuperscript𝜌absent𝑅𝑒superscriptπΉπΌπ‘šsuperscript𝐹\rho^{(+)}(=Re\ F^{(+)}/Im\ F^{(+)}) in high energy region, versus Ec​msubscriptπΈπ‘π‘šE_{cm} in terms of TeV. The thin dot-dashed lines represent the one standard deviation of c2subscript𝑐2c_{2}.(See the caption in Table 1.) The corresponding values of parameters are (c2,c1,c0,Ξ²Pβ€²,F(+)​(0))=(0.0466Β±0.0047,βˆ’0.161βˆ“0.077,6.27Β±0.31,7.45βˆ“0.48,12.65Β±0.69)subscript𝑐2subscript𝑐1subscript𝑐0subscript𝛽superscript𝑃′superscript𝐹0plus-or-minus0.04660.0047minus-or-plus0.1610.077plus-or-minus6.270.31minus-or-plus7.450.48plus-or-minus12.650.69(c_{2},c_{1},c_{0},\beta_{P^{\prime}},F^{(+)}(0))=(0.0466\pm 0.0047,-0.161\mp 0.077,6.27\pm 0.31,7.45\mp 0.48,12.65\pm 0.69).
Table 1: The values of parameters in the best fit to the data up to SPS energy (s=0.9𝑠0.9\sqrt{s}=0.9TeV) in the analysis 1(fit to the data in 70​G​e​V<k<Pl​a​r​g​e=4.3Γ—105​GeV70GeVπ‘˜subscriptπ‘ƒπ‘™π‘Žπ‘Ÿπ‘”π‘’4.3superscript105GeV70{\rm GeV}<k<P_{large}=4.3\times 10^{5}{\rm GeV} ). The error estimations are done as follows: The c2subscript𝑐2c_{2} is fixed with a value deviated a little from the best-fit value, and then the Ο‡2superscriptπœ’2\chi^{2}-fit is done by three parameters c0subscript𝑐0c_{0}, c1subscript𝑐1c_{1} and F(+)​(0)superscript𝐹0F^{(+)}(0), where Ξ²Pβ€²subscript𝛽superscript𝑃′\beta_{P^{\prime}} is represented by the other parameters through FESR(Eq.Β (10)). When the resulting Ο‡2superscriptπœ’2\chi^{2} is larger than the least Ο‡2superscriptπœ’2\chi^{2} of the four-parameter fit by one, the corresponding value of c2subscript𝑐2c_{2} gives one standard deviation. The higher and lower dot-dashed lines in Fig.Β 1 represent this deviation of c2subscript𝑐2c_{2}. The errors of the other parameters are estimated through similar procedures.
c2subscript𝑐2c_{2} c1subscript𝑐1c_{1} c0subscript𝑐0c_{0} Ξ²Pβ€²subscript𝛽superscript𝑃′\beta_{P^{\prime}} F(+)​(0)superscript𝐹0F^{(+)}(0)
Analysis 1 0.0466Β±0.0047plus-or-minus0.04660.00470.0466\pm 0.0047 βˆ’0.161βˆ“0.078minus-or-plus0.1610.078-0.161\mp 0.078 6.27Β±0.33plus-or-minus6.270.336.27\pm 0.33 7.45βˆ“0.51minus-or-plus7.450.517.45\mp 0.51 12.65Β±5.66plus-or-minus12.655.6612.65\pm 5.66
Table 2: The values of Ο‡2superscriptπœ’2\chi^{2} for the fit to data in 70​G​e​V<k<Pl​a​r​g​e=4.3Γ—105​GeV70GeVπ‘˜subscriptπ‘ƒπ‘™π‘Žπ‘Ÿπ‘”π‘’4.3superscript105GeV70{\rm GeV}<k<P_{large}=4.3\times 10^{5}{\rm GeV}(Analysis 1): NFsubscript𝑁𝐹N_{F} and Nσ​(Nρ)subscriptπ‘πœŽsubscriptπ‘πœŒN_{\sigma}(N_{\rho}) are the degree of freedom and the number of Οƒtot(+)​(ρ(+))subscriptsuperscript𝜎totsuperscript𝜌\sigma^{(+)}_{\rm tot}(\rho^{(+)}) data points in the fitted energy region.
Ο‡2/NFsuperscriptπœ’2subscript𝑁𝐹\chi^{2}/N_{F} χσ2/NΟƒsubscriptsuperscriptπœ’2𝜎subscriptπ‘πœŽ\chi^{2}_{\sigma}/N_{\sigma} χρ2/Nρsubscriptsuperscriptπœ’2𝜌subscriptπ‘πœŒ\chi^{2}_{\rho}/N_{\rho}
Analysis 1 8.1/20 5.7/17 2.4/8

In terms of the best-fit values of parameters in Table 1 the predictions at s=1.8𝑠1.8\sqrt{s}=1.8TeV are obtained as

Οƒtot(+)superscriptsubscript𝜎tot\displaystyle\sigma_{\rm tot}^{(+)} =\displaystyle= 75.9Β±1.0​mb,ρ(+)=0.136Β±0.005,plus-or-minus75.91.0mbsuperscript𝜌plus-or-minus0.1360.005\displaystyle 75.9\pm 1.0\ {\rm mb},\ \ \rho^{(+)}=0.136\pm 0.005\ ,\ \ (11)

where the errors correspond to the one standard deviation of c2subscript𝑐2c_{2}, since the c2subscript𝑐2c_{2}log(Ξ½/M)2{}^{2}(\nu/M)-term in Eq.Β (2) is most relevant for predicting Οƒtot(+)superscriptsubscript𝜎tot\sigma_{\rm tot}^{(+)} in high energy region. (See the caption in Table 1.)

The equation (11) has to be compared with the experimental values at s=1.8𝑠1.8\sqrt{s}=1.8TeV;

Οƒtotp¯​p​(E​811)superscriptsubscript𝜎tot¯𝑝𝑝𝐸811\displaystyle\sigma_{\rm tot}^{\bar{p}p}(E811) =\displaystyle= 71.71Β±2.02​mb,plus-or-minus71.712.02mb\displaystyle 71.71\pm 2.02\ {\rm mb},\
Οƒtotp¯​p​(E​710)superscriptsubscript𝜎tot¯𝑝𝑝𝐸710\displaystyle\sigma_{\rm tot}^{\bar{p}p}(E710) =\displaystyle= 72.8Β±3.1​mb,plus-or-minus72.83.1mb\displaystyle 72.8\pm 3.1\ {\rm mb},\
Οƒtotp¯​p​(C​D​F)superscriptsubscript𝜎tot¯𝑝𝑝𝐢𝐷𝐹\displaystyle\sigma_{\rm tot}^{\bar{p}p}(CDF) =\displaystyle= 80.03Β±2.24​mb,plus-or-minus80.032.24mb\displaystyle 80.03\pm 2.24\ {\rm mb},\ \ (12)

where we note that the difference between Οƒtotp¯​psuperscriptsubscript𝜎tot¯𝑝𝑝\sigma_{\rm tot}^{\bar{p}p} and Οƒtot(+)superscriptsubscript𝜎tot\sigma_{\rm tot}^{(+)} is negligible at the relevant energy. It is worthwhile to notice that only the data of E710[7] is consistent with the prediction, Eq.Β (11) in the one standard deviation ( 72.8+3.1=75.972.83.175.972.8+3.1=75.9 ).

If one tolerates two standard deviations, both CDF[9] (80.03βˆ’2.24Γ—2=75.5580.032.24275.5580.03-2.24\times 2=75.55) and E811[8](71.71+2.02Γ—2=75.7571.712.02275.7571.71+2.02\times 2=75.75) are consistent with the predictions Eq.Β (11). So we can conclude that E710 is preferable but we can exclude neither CDF nor E811 results.

The predictions at LHC energy (s=14𝑠14\sqrt{s}=14TeV) in terms of the best fit values of high-energy parameters in Table 1 are

Οƒtotp​psuperscriptsubscript𝜎tot𝑝𝑝\displaystyle\sigma_{\rm tot}^{pp} =\displaystyle= 107.2Β±2.8​mb,ρp​p=0.128Β±0.005,plus-or-minus107.22.8mbsuperscriptπœŒπ‘π‘plus-or-minus0.1280.005\displaystyle 107.2\pm 2.8\ {\rm mb},\ \ \rho^{pp}=0.128\pm 0.005\ ,\ \ (13)

where the errors correspond to one standard deviation of c2subscript𝑐2c_{2}. We should note that Eq.Β (13) is consistent with the recent prediction by Block and Halzen[3], Οƒtotp​p=107.3Β±1.2​mb,ρp​p=0.132Β±0.001formulae-sequencesuperscriptsubscript𝜎tot𝑝𝑝plus-or-minus107.31.2mbsuperscriptπœŒπ‘π‘plus-or-minus0.1320.001\sigma_{\rm tot}^{pp}=107.3\pm 1.2\ {\rm mb},\ \ \rho^{pp}=0.132\pm 0.001.

An interesting observation:Β Β Β Β We can make the following interesting observation. We fitted the data for Οƒtot(+)superscriptsubscript𝜎tot\sigma_{\rm tot}^{(+)} and ρ(+)superscript𝜌\rho^{(+)} above 70GeV, as is shown by the arrow in the Fig.Β 1(a), Fig.Β 1(d) to predict higher-energy data. It is interesting to observe that the prediction of Οƒtot(+)superscriptsubscript𝜎tot\sigma_{\rm tot}^{(+)} are also in good agreement with experiments, even below 70GeV. The reason is as follows: The requirement of FESR, Eq.Β (7) is nearly equal to require that the theoretical value of Οƒtot(+)superscriptsubscript𝜎tot\sigma_{\rm tot}^{(+)} is nearly equal to the experimental value at the upper limit of the integral N=10𝑁10N=10GeV since higher side of the integral is enhanced because of k2superscriptπ‘˜2k^{2} in the integral.

Because of this observation, we can apply the same formula to fit the data in the lower energy region than in the analysis 1.

Analysis 2:Β Β Β Β Data in 10GeV<k<Pl​a​r​g​e=4.3Γ—105GeV(4.54GeV<s<0.9TeV10{\rm GeV}<k<P_{large}=4.3\times 10^{5}{\rm GeV}(4.54{\rm GeV}<\sqrt{s}<0.9{\rm TeV} ) are fitted through the same formula in the analysis 1. Additionally 15(2) data points are included in Οƒtot(+)​(R​e​F(+))superscriptsubscript𝜎tot𝑅𝑒superscript𝐹\sigma_{\rm tot}^{(+)}\ (Re~{}F^{(+)}).

The result of the fit is shown in Fig.Β 2. The values of parameters and resulting Ο‡2superscriptπœ’2\chi^{2} are given in Tables 3 and 4, respectively.

Refer to caption
Figure 2: Predictions for Οƒ(+)superscript𝜎\sigma^{(+)} and ρ(+)superscript𝜌\rho^{(+)} in terms of the Analysis 2. The fit is done for the data up to SPS energy, in the region 10GeV≀\leq kπ‘˜k ≀\leq 4.3Γ—1054.3superscript1054.3\times 10^{5}GeV(4.54GeV ≀s≀absent𝑠absent\leq\sqrt{s}\leq 0.9TeV) which is shown by the arrow. For each figure, see the caption in Fig.Β 1. The thin dot-dashed lines represent the one standard deviation of c2subscript𝑐2c_{2}.(See the caption in Table 1.) The corresponding values of parameters are (c2,c1,c0,Ξ²Pβ€²,F(+)​(0))=(0.0479Β±0.0037,βˆ’0.186βˆ“0.056,6.38Β±0.21,7.26βˆ“0.31,10.19Β±0.31)subscript𝑐2subscript𝑐1subscript𝑐0subscript𝛽superscript𝑃′superscript𝐹0plus-or-minus0.04790.0037minus-or-plus0.1860.056plus-or-minus6.380.21minus-or-plus7.260.31plus-or-minus10.190.31(c_{2},c_{1},c_{0},\beta_{P^{\prime}},F^{(+)}(0))=(0.0479\pm 0.0037,-0.186\mp 0.056,6.38\pm 0.21,7.26\mp 0.31,10.19\pm 0.31).
Table 3: The values of parameters in the best fit to the data up to the SPS energy (s=0.9𝑠0.9\sqrt{s}=0.9TeV) in the analysis 2(fit to the data in 10​G​e​V<k<Pl​a​r​g​e=4.3Γ—105​GeV10GeVπ‘˜subscriptπ‘ƒπ‘™π‘Žπ‘Ÿπ‘”π‘’4.3superscript105GeV10{\rm GeV}<k<P_{large}=4.3\times 10^{5}{\rm GeV} ). We obtain smaller error of F(+)​(0)superscript𝐹0F^{(+)}(0) than in analysis 1(Table 1), since, as is seen in Eq.Β (9), F(+)​(0)superscript𝐹0F^{(+)}(0) has sizable effects only in the low energy region. For errors, see the caption in Table 1.
c2subscript𝑐2c_{2} c1subscript𝑐1c_{1} c0subscript𝑐0c_{0} Ξ²Pβ€²subscript𝛽superscript𝑃′\beta_{P^{\prime}} F(+)​(0)superscript𝐹0F^{(+)}(0)
Analysis 2 0.0479Β±0.0037plus-or-minus0.04790.00370.0479\pm 0.0037 βˆ’0.186βˆ“0.057minus-or-plus0.1860.057-0.186\mp 0.057 6.38Β±0.22plus-or-minus6.380.226.38\pm 0.22 7.26βˆ“0.33minus-or-plus7.260.337.26\mp 0.33 10.19Β±1.72plus-or-minus10.191.7210.19\pm 1.72
Table 4: The values of Ο‡2superscriptπœ’2\chi^{2} for the fit to data in 10​G​e​V<k<Pl​a​r​g​e=4.3Γ—105​GeV10GeVπ‘˜subscriptπ‘ƒπ‘™π‘Žπ‘Ÿπ‘”π‘’4.3superscript105GeV10{\rm GeV}<k<P_{large}=4.3\times 10^{5}{\rm GeV}(Analysis 2). For NFsubscript𝑁𝐹N_{F} and Nσ​(Nρ)subscriptπ‘πœŽsubscriptπ‘πœŒN_{\sigma}(N_{\rho}), see the caption in Table.Β 2.
Ο‡2/NFsuperscriptπœ’2subscript𝑁𝐹\chi^{2}/N_{F} χσ2/NΟƒsubscriptsuperscriptπœ’2𝜎subscriptπ‘πœŽ\chi^{2}_{\sigma}/N_{\sigma} χρ2/Nρsubscriptsuperscriptπœ’2𝜌subscriptπ‘πœŒ\chi^{2}_{\rho}/N_{\rho}
Analysis 2 14.1/37 8.8/32 5.3/10

The predictions at LHC energy (s=14𝑠14\sqrt{s}=14TeV) in terms of the best fit values of high-energy parameters in Table 3 are

Οƒtotp​psuperscriptsubscript𝜎tot𝑝𝑝\displaystyle\sigma_{\rm tot}^{pp} =\displaystyle= 107.8Β±2.4​mb,ρp​p=0.129Β±0.004,plus-or-minus107.82.4mbsuperscriptπœŒπ‘π‘plus-or-minus0.1290.004\displaystyle 107.8\pm 2.4\ {\rm mb},\ \ \rho^{pp}=0.129\pm 0.004\ ,\ \ (14)

where the errors correspond to the one standard deviation of c2subscript𝑐2c_{2}. Essentially the same prediction are obtained as Eq.Β (13) of the analysis 1, although the errors are slightly smaller. Our result is stable independently of the choices of the fitting energy range.

4 Concluding remarks

In Β§3, we have investigated a possibility to resolve the discrepancy between E710, E811 and CDF, using the experimental data of Οƒtot(+)superscriptsubscript𝜎tot\sigma_{\rm tot}^{(+)} and ρ(+)superscript𝜌\rho^{(+)} up to the SPS experiments (s=0.9𝑠0.9\sqrt{s}=0.9TeV).

We came to the conclusion that only the data of E710 is consistent with the prediction, Eq.Β (11) in the one standard deviation although we can exclude neither CDF nor E811 results in the two standard deviations. In our previous paper, ref.Β \citen[1] we concluded that the precise measurements of Οƒtotp​psuperscriptsubscript𝜎tot𝑝𝑝\sigma_{\rm tot}^{pp} in the coming LHC measurements will resolve this discrepancy at s=1.8𝑠1.8\sqrt{s}=1.8TeV. It would still be worthwhile , however, to fix this problem in the CDF and D0 experiments, since these values play an important role to search for Οƒtot(+)superscriptsubscript𝜎tot\sigma_{\rm tot}^{(+)} and ρ(+)superscript𝜌\rho^{(+)} in the higher energy regions.

Appendix A Reanalysis of our predictions at the LHC (s𝑠\sqrt{s}=14TeV) with F(+)​(0)superscript𝐹0F^{(+)}(0) parameter

In our previous work[1], we exploited the experimental data Οƒtot(+)superscriptsubscript𝜎tot\sigma_{\rm tot}^{(+)} and ρ(+)superscript𝜌\rho^{(+)} above Pl​a​bsubscriptπ‘ƒπ‘™π‘Žπ‘P_{lab}=70GeV up to Tevatron energy (s=1.8𝑠1.8\sqrt{s}=1.8TeV) to predict Οƒtot(+)superscriptsubscript𝜎tot\sigma_{\rm tot}^{(+)} and ρ(+)superscript𝜌\rho^{(+)} in the LHC region, based on Eq.Β (8) of ρ(+)superscript𝜌\rho^{(+)}, not by Eq.Β (9). Although the effect of the parameter F(+)​(0)superscript𝐹0F^{(+)}(0) in the new formula (Eq.Β (9)) is not large in the high energy region, we show the results of the analyses based on Eq.Β (9) here for completeness.

Corresponding to ref.Β \citen[1] two independent analyses are done: one includes the E710//E811 data at s𝑠\sqrt{s}=1.8TeV denoted as fit 2 in ref.Β \citen[1], and the other includes the CDF datum of Οƒtot(+)superscriptsubscript𝜎tot\sigma_{\rm tot}^{(+)} at the same energy denoted as fit 3 in ref.Β \citen[1]. The results of the simultaneous fit to Οƒtot(+)superscriptsubscript𝜎tot\sigma_{\rm tot}^{(+)} and ρ(+)superscript𝜌\rho^{(+)} are compared with the previous results[1] in Fig.Β 3. The fit to ρ(+)superscript𝜌\rho^{(+)} is slightly improved in the lower energy region, while the result of Οƒtot(+)superscriptsubscript𝜎tot\sigma_{\rm tot}^{(+)} is almost the same as the previous one.
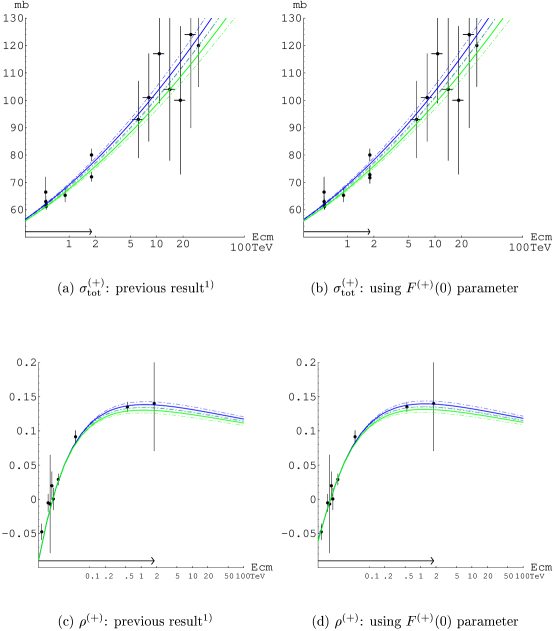
Refer to caption
Figure 3: Predictions for Οƒ(+)superscript𝜎\sigma^{(+)} and ρ(+)superscript𝜌\rho^{(+)} compared with the previous results: The new results using F(+)​(0)superscript𝐹0F^{(+)}(0) parameter are shown by right figures, (b) and (d), respectively, which are compared with the left figures, (a) and (c), of the previous analyses.[1] Predictions in terms of the fit 2(3) are shown by green(blue) lines, and the thin dot-dashed lines represent the one standard deviation of c2subscript𝑐2c_{2}. (See the caption in Table 1.) The corresponding values of parameters are given in Table 5.

The obtained values of parameters and the resulting Ο‡2superscriptπœ’2\chi^{2} are given in Table 5 and Table 6, respectively.

Table 5: The best-fit values of parameters in the fit 2 (fit up to Tevatron-collider energy including E710/811 data) and fit 3 (including CDF datum). The errors here correspond to the one standard deviation of c2subscript𝑐2c_{2}. (See the caption in Table 1 .)
c2subscript𝑐2c_{2} c1subscript𝑐1c_{1} c0subscript𝑐0c_{0} Ξ²Pβ€²subscript𝛽superscript𝑃′\beta_{P^{\prime}} F(+)​(0)superscript𝐹0F^{(+)}(0)
fit 2 0.0424Β±0.0041plus-or-minus0.04240.00410.0424\pm 0.0041 βˆ’0.099βˆ“0.069minus-or-plus0.0990.069-0.099\mp 0.069 6.04Β±0.28plus-or-minus6.040.286.04\pm 0.28 7.61βˆ“1.55minus-or-plus7.611.557.61\mp 1.55 12.48Β±0.73plus-or-minus12.480.7312.48\pm 0.73
fit 3 0.0496Β±0.0043plus-or-minus0.04960.00430.0496\pm 0.0043 βˆ’0.205βˆ“0.072minus-or-plus0.2050.072-0.205\mp 0.072 6.44Β±0.29plus-or-minus6.440.296.44\pm 0.29 7.20βˆ“0.81minus-or-plus7.200.817.20\mp 0.81 12.78Β±0.72plus-or-minus12.780.7212.78\pm 0.72
Table 6: The values of Ο‡2superscriptπœ’2\chi^{2} for the fit 2 and fit 3. NFsubscript𝑁𝐹N_{F} and Nσ​(Nρ)subscriptπ‘πœŽsubscriptπ‘πœŒN_{\sigma}(N_{\rho}) are the degree of freedom and the number of Οƒtot(+)​(ρ(+))subscriptsuperscript𝜎totsuperscript𝜌\sigma^{(+)}_{\rm tot}(\rho^{(+)}) data points in the fitted energy region.
Ο‡2/NFsuperscriptπœ’2subscript𝑁𝐹\chi^{2}/N_{F} χσ2/NΟƒsubscriptsuperscriptπœ’2𝜎subscriptπ‘πœŽ\chi^{2}_{\sigma}/N_{\sigma} χρ2/Nρsubscriptsuperscriptπœ’2𝜌subscriptπ‘πœŒ\chi^{2}_{\rho}/N_{\rho}
fit 2 11.6/22 7.9/18 3.7/9
fit 3 10.9/22 8.7/18 2.1/9

The fit to ρ(+)superscript𝜌\rho^{(+)} in the lower energy region is improved in comparison with the previous result, as can be seen in Fig.Β 3. Correspondingly much smaller χρ2subscriptsuperscriptπœ’2𝜌\chi^{2}_{\rho} is obtained in Table 6, which is compared with the previous values, χρ2subscriptsuperscriptπœ’2𝜌\chi^{2}_{\rho}=8.4(6.9) for fit 2(3)[1].

Predicted values of Οƒtot(+)superscriptsubscript𝜎tot\sigma_{\rm tot}^{(+)} and ρ(+)superscript𝜌\rho^{(+)} at LHC energy(s𝑠\sqrt{s}=14TeV) and at cosmic-ray energy (Pl​a​bsubscriptπ‘ƒπ‘™π‘Žπ‘P_{lab}=5Γ—10205superscript10205\times 10^{20}eV) are given in Table 7.

Table 7: The predictions of Οƒtot(+)superscriptsubscript𝜎tot\sigma_{\rm tot}^{(+)} and ρ(+)superscript𝜌\rho^{(+)} at the LHC energy s=Ec​m=14𝑠subscriptπΈπ‘π‘š14\sqrt{s}=E_{cm}=14TeV(Pl​a​bsubscriptπ‘ƒπ‘™π‘Žπ‘P_{lab}=1.04Γ—108absentsuperscript108\times 10^{8}GeV), and at a very high energy Pl​a​b=5β‹…1020subscriptπ‘ƒπ‘™π‘Žπ‘β‹…5superscript1020P_{lab}=5\cdot 10^{20}eV (s𝑠\sqrt{s}=Ec​msubscriptπΈπ‘π‘šE_{cm}=967TeV.) in the cosmic-ray region. The errors correspond to one standard deviation of c2subscript𝑐2c_{2}.
Οƒtot(+)superscriptsubscript𝜎tot\sigma_{\rm tot}^{(+)}(s𝑠\sqrt{s}=14TeV) ρ(+)superscript𝜌\rho^{(+)}(s𝑠\sqrt{s}=14TeV) Οƒtot(+)superscriptsubscript𝜎tot\sigma_{\rm tot}^{(+)}(Pl​a​bsubscriptπ‘ƒπ‘™π‘Žπ‘P_{lab}=5β‹…1020β‹…5superscript10205\cdot 10^{20}eV) ρ(+)superscript𝜌\rho^{(+)}(Pl​a​bsubscriptπ‘ƒπ‘™π‘Žπ‘P_{lab}=5β‹…1020β‹…5superscript10205\cdot 10^{20}eV)
fit 2 104.2Β±2.3plus-or-minus104.22.3104.2\pm 2.3mb 0.123Β±0.004plus-or-minus0.1230.0040.123\pm 0.004 191Β±8plus-or-minus1918191\pm 8mb 0.100Β±0.003plus-or-minus0.1000.0030.100\pm 0.003
fit 3 109.3Β±2.4plus-or-minus109.32.4109.3\pm 2.4mb 0.130Β±0.004plus-or-minus0.1300.0040.130\pm 0.004 206Β±8plus-or-minus2068206\pm 8mb 0.105Β±0.003plus-or-minus0.1050.0030.105\pm 0.003

The predictions combining the two results in Table 7 are

Οƒtotp¯​psuperscriptsubscript𝜎tot¯𝑝𝑝\displaystyle\sigma_{\rm tot}^{\bar{p}p} =\displaystyle= 106.8Β±5.1systΒ±2.4stat​mb,ρp¯​p=0.127Β±0.007systΒ±0.004statplus-or-minus106.8subscript5.1systsubscript2.4statmbsuperscriptπœŒΒ―π‘π‘plus-or-minus0.127subscript0.007systsubscript0.004stat\displaystyle 106.8\pm 5.1_{\rm syst}\pm 2.4_{\rm stat}\ {\rm mb},\ \ \rho^{\bar{p}p}=0.127\pm 0.007_{\rm syst}\pm 0.004_{\rm stat}\ \ \ \ \ \ \
Οƒtotp​psuperscriptsubscript𝜎tot𝑝𝑝\displaystyle\sigma_{\rm tot}^{pp} =\displaystyle= 198Β±16systΒ±8stat​mb,ρp​p=0.103Β±0.004systΒ±0.003statplus-or-minus198subscript16systsubscript8statmbsuperscriptπœŒπ‘π‘plus-or-minus0.103subscript0.004systsubscript0.003stat\displaystyle 198\pm 16_{\rm syst}\pm 8_{\rm stat}\ {\rm mb},\ \ \rho^{pp}=0.103\pm 0.004_{\rm syst}\pm 0.003_{\rm stat}\ \ \ \ \ \ \ (15)

at the LHC energy(s=Ec​m=14𝑠subscriptπΈπ‘π‘š14\sqrt{s}=E_{cm}=14TeV) and the cosmic-ray energy (Pl​a​b=5Γ—1020subscriptπ‘ƒπ‘™π‘Žπ‘5superscript1020P_{lab}=5\times 10^{20}eV), respectively. The above results are almost the same as the previous ones, Eq.Β (13) of ref.Β \citen[1]. Here we obtain fairly large systematic uncertainty again coming from the data treatment at the Tevatron-energy.

References

  • [1] K.Β Igi and M.Β Ishida, Phys.Β Lett.Β B 622 (2005), 286
  • [2] M.Β M.Β Block and F.Β Halzen, Phys.Β Rev.Β D 72 (2005), 036006: Erratum 039902.
  • [3] M.Β M.Β Block and F.Β Halzen, hep-ph/0510238.
  • [4] M.Β Honda et al. (Akeno Collab.), Phys.Β Rev.Β Lett.Β 70 (1993), 525.
  • [5] R.Β M.Baltrusaitis et al. (Fly’s Eye Collab.), Phys.Β Rev.Β Lett.Β 52 (1984), 1380
  • [6] M.Β M.Β Block, F.Β Halzen and T.Β Stanev, Phys.Β Rev.Β D62 (2000), 077501.
  • [7] N.Β A.Β Amos, et al., E-710 Collaboration, Phys.Β Rev.Β Lett.Β 68 (1992), 2433.
  • [8] C.Β Avila, et al., E-811 Collaboration, Phys.Β Lett.Β B 445 (1999), 419.
  • [9] F.Β Abe, et al., CDF Collaboration, Phys.Β Rev.Β D 50 (1994), 5550.
  • [10] K.Β Igi and M.Β Ishida, Phys.Β Rev.Β D 66 (2002), 034023.
  • [11] K.Β Igi and S.Β Matsuda, Phys.Β Rev.Β Lett.Β 18 (1967), 625.
  • [12] R.Β Dolen, D.Β Horn and C.Β Schmid, Phys.Β Rev.Β 166 (1968), 1768.
  • [13] M.Β M.Β Block and R.Β N.Β Cahn, Rev.Β Mod.Β Phys.Β 57 (1985), 563.
  • [14] Particle Data Group, S.Β Eidelman et al., Phys.Β Lett.Β BΒ 592 (2004), 313.