Importance of a Measurement of at HERA
Abstract
I investigate what a direct measurement of the longitudinal structure function could teach us about the structure of the proton and the best way in which to use perturbative QCD for structure functions. I assume HERA running at a lowered beam energy for approximately 4-5 months and examine how well the measurement could distinguish between different theoretical approaches. I conclude that such a measurement would provide useful information on how to calculate structure functions and parton distributions at small .
1 Introduction
It would be vital to have a real accurate measurement of at HERA since this gives an independent test of the gluon distribution at low to accompany that determined from [1]–[5]. At present the fits to at low are reasonably good, but the gluon is free to vary in order to make them as successful as possible. It is essential to have a cross-check. (It is important to note that is a much better discriminator of the gluon distribution, and/or of different theories, for given than the charm contribution. is constrained to evolve in exactly the same way as (with appropriate charge weighting) for , so is hardly independent. At lower the supression is determined mainly by kinematics.) Currently there is a consistency check on the relationship between and at high since both contribute to the total cross-section measured at HERA. Hence, there are effective “determinations” of obtained by extrapolating to high using either NLO perturbative QCD or using whilst making assumptions about [6]. This is a good consistency test of a given theory, usually NLO QCD, and could show up major flaws. However, it relies on small differences between two large quantities, so its accuracy is limited. Also, for an extraction of it has model-dependent uncertainties which are difficult to quantify fully [7]. A real measurement would be a much more direct test of the success of different theories in QCD.
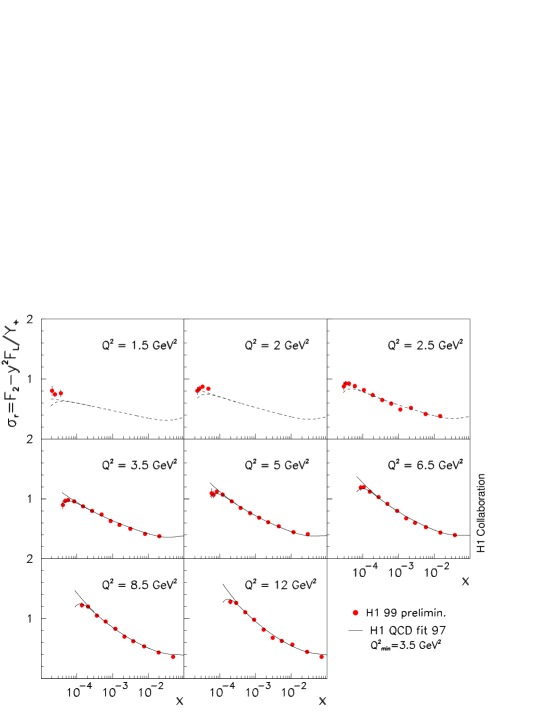
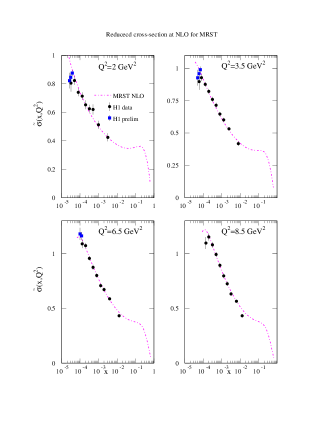
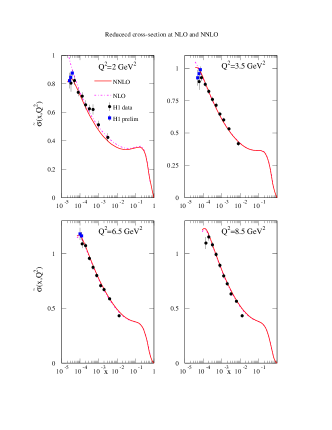
The consistency check of extracted by H1 versus predicted from their QCD fit [5] is shown in Figure 9 in the second of [6]. However, due to the potentially large, strongly correlated, model-dependent errors in the “measured” it is far more revealing to see plots like Figure 1 [6]. The turn-over in is clearly matched by the contribution. However, the same consistency check for the fit of for MRST partons at NLO fails at the lower values, as seen on the left-hand side of Figure 2. This is because of the different gluon obtained from a full global fit. Hence, the consistency check is not universally successful at NLO.222Additionally, Alekhin performed fits to DIS data, using the reduced cross-section for HERA data, and allowed higher-twist corrections to be determined phenomenologically. He found an unambiguous positive correction for , i.e. the consistency check fails for the purely perturbative fit [3].
Hence, many current NLO global fits show problems regarding at high . In general they provide a good fit to HERA data, but there are some problems in , e.g. Figure 17 in [8]. However, standard perturbation theory is not necessarily reliable in general because of increasing logs at higher orders, e.g. at small
| (1) |
and similarly
| (2) |
and hence enhancements at higher orders are possible.
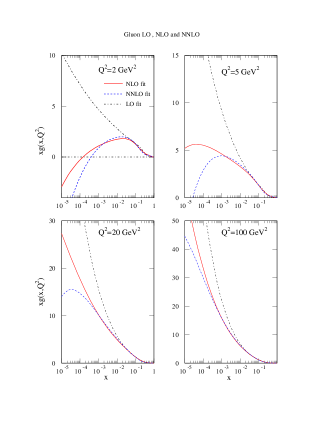
However, we can already see precisely what happens at NNLO. The splitting functions have been calculated at NNLO [9], and recently the coefficient functions for have been finished [10]. The gluon extracted from the MRST global fit at LO, NLO and NNLO is shown in Figure 3. Additional positive small- contributions in at each order lead to a smaller low- gluon at each order.333This conclusion relies on a correct application of flavour thresholds in a General Variable Flavour Number Scheme at NNLO [11], not present in earlier approximate NNLO MRST fits. The correct treatment of flavour is particularly important at NNLO because discontinuities in unphysical quantities appear at this order.
The NNLO longitudinal coefficient function given by
| (3) |
There is clearly a significant positive contribution at small , and this counters the decrease in small- gluon. predicted from the global fit at LO, NLO and NNLO is shown in Figure 3. The NNLO coefficient function more than compensates for the decrease in the NNLO gluon.
Without considering the high- HERA data, the NNLO fit is not much better than NLO fit, though it is a slight improvement [2]. However, the NNLO contribution to largely solves the previous high- problem with , as seen on the right-hand side of Figure 2.444The high- fit would fail with gluons that are positive at small and – would be too big and the turnover too great. But these data are not very precise, the effective error on being . It is of real importance to have some accurate measurement of at small .
HERA has proposed some running at lower beam energy before finishing in order to make a direct measurement of . The expectation is to measure data from and with a typical error of at best [12]. How important would this be in distinguishing between different theoretical approaches to structure functions? There has been a study by ZEUS [13] on the impact of such data on the accuracy with which is determined if is roughly as expected from a NLO fit. There is a significant although not enormous improvement in the gluon uncertainty. However, this is not, in my view, the most interesting question. Rather, it is important to see if the potential measurement could tell apart different theoretical treatments, e.g. whether we need go beyond the standard fixed-order perturbation theory approach. There has also been a study of this by ZEUS [14], with extreme theoretical predictions, and the discriminating power is obvious. However, in this case the extremes are based on unrealistic models (out-of-date partons and partons from one order used with coefficient functions from another). Furthermore, all data points are assumed to line up, i.e. the for the correct theory would be . A more sophisticated approach is needed.
2 Test of Theoretical Models
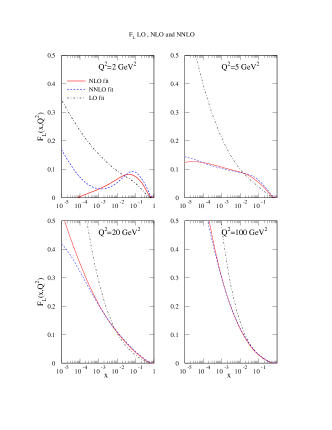
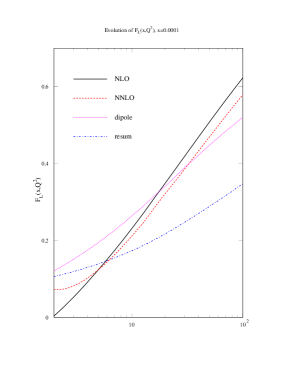
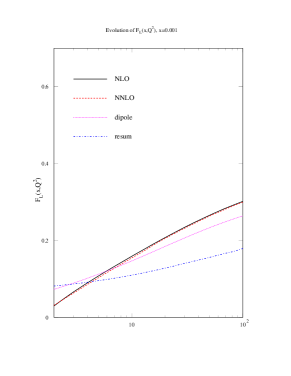
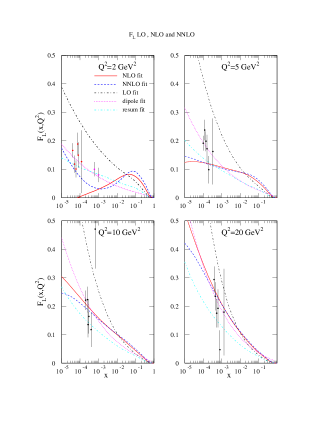
I consider a variety of more plausible theoretical variations. A fit that performs a double resummation of leading and terms leads to a better fit to small- data than a conventional perturbative fit [15]. The resummation also seems to stabilize at small and . The fit has some problems at higher (particularly for Drell-Yan data), and NLO contributions to resummation are needed for precision [16], hence the prediction is somewhat approximate, but it has the correct trend.555Similar results would be likely from the approaches in [17, 18] since the resummations, though different in detail, have the same qualitative features. Alternatively, a dipole-motivated fit [19]–[25] contains higher terms in and higher twists. It also guarantees reasonable behaviour for at low due to the form of wavefunction. In a quantitative comparison I use my own dipole-motivated fit [26] in order to avoid problems in the heavy flavour treatment in some other approaches. The evolution of various predictions for at and , is seen in Figure 4. The resummation and dipole predictions are behaving sensibly at low . The NLO prediction is becoming negative at the lowest values, while the NNLO prediction is becoming flat at for . It has a slight turn up at even smaller , implying the necessity for even further corrections. The results are shown for various values of on the left-hand side of Figure 5. They suggest that a measurement of over as wide a range of and as possible would be very useful.
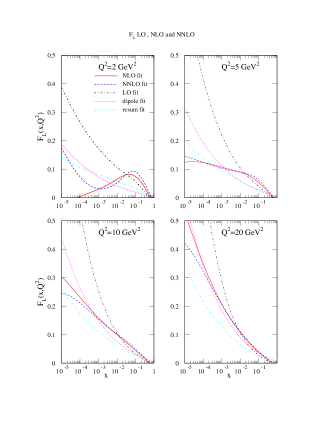
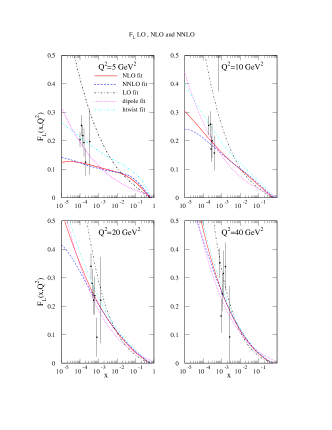
In particular, the dipole fit produces a rather different shape and size prediction for from that at NLO and NNLO. Hence I generate a set of data based on the central dipole prediction but with a random scatter ( for the dipole prediction). The comparison of the pseudo-data to other predictions is shown on the right-hand side of Figure 5, where I also show points at that might have been measured at HERA III and might be at eRHIC [27]. Points at are not as useful, as the errors are bigger and the theoretical curves are converging. From Figure 5 it is clear that there is some reasonable differentiating power, but this is comparing the central predictions for a given theoretical framework only. We must also consider the uncertainties.
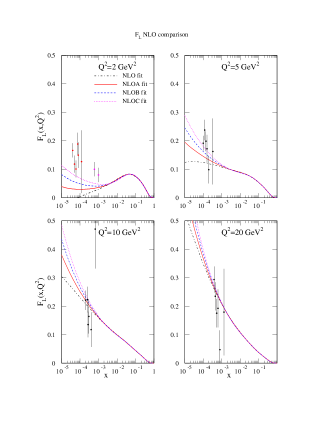
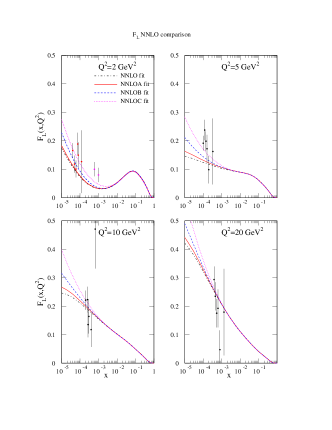
This is shown in Figure 6, where the the left-hand side shows the comparison at NLO as the weight of the data is increased in the fit. The best fit results in for the data but this is becoming an unacceptable global fit. The next-best fit is an acceptable global fit, and for the data. The NLO fit to the data is never particularly good because the shape in is never quite correct. The comparison at NNLO as the weight of the data is increased in the fit is similar. The best fit results in for the data but is becoming an unacceptable global fit. The next-best fit is an acceptable global fit, and for the data. Again the NNLO fit to data always gets the shape in slightly wrong.
As well as the resummation and dipole hypotheses we can also look at explicit higher twist possibilities, in particular the renormalon correction due to the nonsinglet quark sector. This is a different picture from the case for , where the renormalon calculation of higher twist dies away at small due to satisfying the Adler sum rule. It is a completely different picture for – at small . The explicit renormalon calculation [28] gives
| (4) |
where the estimate for for the first moment of the structure function is
| (5) |
This effect has nothing to do with the gluon distribution, and is not part of the higher twist contribution in the dipole approach. The higher twist does mix with higher orders though. I add it to the NLO prediction. The renormalon correction could be a rather significant effect, as seen in Figure 7, where I generate a new set of data based on the central higher twist prediction. (The data at are shown. All predictions give for the six points at (except LO)). It is most similar to the dipole prediction but the data give for the dipole prediction curve – perhaps at the edge of distinguishability. The renormalon-based data are clearly able to rule out the central NLO and NNLO curves, but one must repeat the study done for dipole data.
Again I look at the NLO fit as the weight of the data is increased in the fit. The best fit results in for the data, but is an unacceptable global fit – . The next-best fit is a marginally acceptable global fit and for the data. Hence, in this case the NLO fit to data can get the shape in (for ) more-or-less right, but the deterioration in the global fit required to do so is worse than for the dipole data. The comparison at NNLO as the weight of data is increased in the fit is again similar to that at NLO. The best fit results in for data but is a poor global fit – . The next-best fit is a moderately acceptable global fit, and for data.
3 Conclusions
The measurement of seems to be the best way to determine reliably the gluon distribution at low , particularly at low , and to determine whether fixed-order calculations are sufficient or whether resummations, or other theoretical extensions may be needed. Currently we can perform global fits to all up-to-date data over a wide range of parameter space, and the fit quality is fairly good, but there are some minor problems. We could require higher orders, higher twist and/or some type of resummation, all of which might have a potentially large impact on the predicted and other quantities. Hence, is a vital measurement for our understanding of precisely how best to use perturbative QCD to describe the structure of the proton and also for making really reliable predictions and comparisons at the LHC. The lowest possible would be useful. The proposed measurement at HERA would have a reasonable ability to distinguish between different theoretical approaches, due to both the inability to fit because of the shape and the deterioration in global fits needed in order to match the general features of data, and would play a central role in determining the best way to use QCD.
Acknowledgments
I would like to thank Max Klein for supplying me with the simulated H1 data for , and him and Mandy Cooper-Sarkar, Claire Gwenlan, Alan Martin and James Stirling for numerous discussions on the subject of the longitudinal structure function.
References
- [1] CTEQ Collaboration: J. Pumplin et al., JHEP 0207:012 (2002).
- [2] A.D. Martin, R.G. Roberts, W.J. Stirling and R.S. Thorne, Phys. Lett. B604 (2004) 61.
- [3] S.I. Alekhin, Phys. Rev. D68 (2003) 014002.
- [4] ZEUS Collaboration: S. Chekanov et al., Eur. Phys. J. C42 (2005) 1.
- [5] H1 Collaboration: C. Adloff et al., Eur. Phys. J. C21 (2001) 33.
-
[6]
H1 Collaboration: C. Adloff et al., Phys. Lett.
B393 (1997) 452;
N Gogitidze, J. Phys. G28 (2002) 751, hep-ph/0201047;
E.W. Lobodzinska, proceedings of 11th International Workshop on Deep Inelastic Scattering (DIS 2003), St. Petersburg, Russia, 23-27 Apr 2003, hep-ph/0311180. - [7] R.S. Thorne, Phys. Lett. B418 (1998) 371.
- [8] R.S. Thorne, invited talk at 21st International Symposium on Lepton and Photon Interactions at High Energies (LP 03), Batavia, Illinois, 11-16 Aug 2003, Int. J. Mod. Phys. A19 (2004) 1074.
- [9] A. Vogt, S. Moch and J.A.M. Vermaseren, Nucl. Phys. B688 (2004) 101; Nucl. Phys. B691 (2004) 129.
- [10] A. Vogt, S. Moch and J.A.M. Vermaseren Phys. Lett B606 (2005) 123; hep-ph/0504242.
- [11] R.S. Thorne, proceedings of 13th International Workshop on Deep Inelastic Scattering (DIS 05), Madison, Wisconsin, 27 Apr - 1 May 2005, p. 847, hep-ph/0506251.
-
[12]
M. Klein, proceedings of 12th International Workshop on Deep
Inelastic Scattering (DIS 2004), Strbske Pleso, Slovakia, 14-18 Apr 2004,
p. 309;
J. Feltesse, these proceedings. - [13] C. Gwenlan, proceedings of 13th International Workshop on Deep Inelastic Scattering (DIS 05), Madison, Wisconsin, 27 Apr - 1 May 2005, p. 396, hep-ex/0507032.
- [14] C. Gwenlan, A.M. Cooper-Sarkar and C. Targett-Adams, HERA and the LHC: A Workshop on the Implications of HERA for LHC Physics: CERN - DESY Workshop 2004/2005 hep-ph/0509220.
- [15] R.S. Thorne, Phys. Rev. D60 (1999) 054031; Phys. Rev. D64 (2001) 074005.
- [16] C.D. White and R.S. Thorne, in preparation.
- [17] M. Ciafaloni, D. Colferai, G.P. Salam and A.M. Stasto, Phys. Lett. B587 (2004) 87.
- [18] G. Altarelli, R.D. Ball and S. Forte, Nucl. Phys. B674 (2003) 459.
- [19] K. Golec-Biernat and M. Wüsthoff, Phys. Rev. D59 (1999) 1999, etc.
- [20] M. McDermott, L. Frankfurt, V. Guzey and M. Strikman, Eur. Phys. J. C16, (2000) 641.
- [21] J. Bartels, K. Golec-Biernat and H. Kowalski, Phys. Rev. D66 (2002) 014001.
- [22] E. Gotsman, E. Levin, M. Lublinsky and U. Maor, Eur. Phys. J. C27 (2003) 411.
- [23] E. Iancu, K. Itakaru and S. Munier, Phys. Lett. B590, (2004) 199.
- [24] J.R. Forshaw, and G. Shaw, JHEP 12 (2004) 052.
- [25] H. Kowalski and D. Teaney, Phys. Rev. D68, (2003) 114005.
- [26] R.S. Thorne, Phys.Rev. D71 (2005) 054024.
- [27] I. Abt, A. Caldwell, X. Liu and J. Sutiak hep-ex/0407053.
-
[28]
E. Stein et al., Phys.Lett. B376
(1996) 177;
M. Dasgupta and B.R. Webber, Phys. Lett. B382 (1996) 273.