Quasiparticle picture of quarks near chiral phase transition
Abstract
We study how the quasiparticle picture of the quark can be modified near but above the critical tempearture () of the chiral phase transition; we incorporate into the quark self-energy the effects of the precursory soft modes of the phase transition, i.e., ‘para-() meson’. It is found that the quark spectrum has a three-peak structure near : We show that the additional new spectra originate from the mixing between a quark (anti-quark) and an anti-quark hole (quark hole) caused by a “resonant scattering” of the quasi-fermions with the thermally-excited soft modes.
1 Introduction
The properties of the quark-gluon plasma (QGP) near the critical temperature of the QCD phase transition have now attracted much interest. The data from the RHIC experiment suggest that the hot matter near is a strongly coupled system. The lattice simulations of QCD suggest the existence of the hadronic bound state even above . Historically, the existence of the hadronic excitations in the QGP phase was first suggested for the light quark sector as the soft modes of the chiral transition[1].
It has been shown recently[2, 3] that the precursory diquark fluctuations[4] are developed so as to form a soft mode at high density but at moderate temperature; the soft mode in turn modifies the quark spectrum so significantly that there arises a depression of the quark spectrum around the Fermi surface, leading to the formation of the pseudogap in the density of states. It is thus highly expected that the precursory soft modes of the chiral phase transition should also strongly affect the quark spectrum near . In this report, we investigate how such soft modes affect the quark properties at but at vanishingly small chemical potential[5].
2 Soft Modes and Quark Spectral Function
To describe the quark matter near , we employ the two-flavor Nambu–Jona-Lasinio (NJL) model in the chiral limit
| (1) |
with the coupling constant GeV-2 and the three dimensional cutoff MeV. This model gives the second order phase transition at MeV for vanishing quark chemical potential.
The soft modes of the chiral transition are characterized by the spectral function in the scalar and pseudo-scalar channels , where and are the quark-antiquark retarded Green functions in each channel[1]. One can show that there appear pronounced peaks in in the time-like region, approximately around with a -dependent ‘mass’ , and as approaches the width of the peaks and become smaller[1, 5].
The existence of the soft modes in turn modifies the quark properties. To incorporate the effect of the soft modes into the quark self-energy, we employ the random phase approximation (RPA) which is diagrammatically shown in Fig. 1. The self-energy of the quark in the imaginary time formalism reads,
| (2) |
where are Matsubara propagator of the scalar and pseudo-scalar channels in the RPA and denotes the free quark propagator.
The spectral function of the quark is expressed as
| (3) |
with the retarded Green function of quark and the projection operators .

3 Numerical Results and Discussions
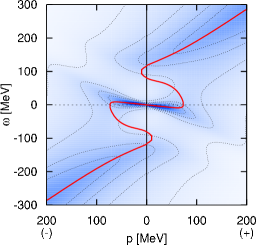
In the left panel of Fig. 2, we show the quark spectral function for , i.e., slightly above . One sees a clear three-peak structure in the spectral function. We also show the contour map of in the right panel together with the quasi-dispersion relations which are defined by zero of the real part of the inverse propagator.

In order to understand the mechanism of the appearance of the three-peak structure in , we show the imaginary part of in the left panel in Fig. 3. One sees that there develop two peaks in in the positive- and negative-energy regions at small temperatures, with the peak positions moving toward the origin as is lowered to . It is found that the peaks in Im in the positive and negative energy regions essentially correspond to the decay processes shown in the right panel in Fig. 3(a) and (b), respectively; the wavy lines represent the soft modes. One should notice here that the incident anti-quark line in Fig. 3(a) describe a thermally excited antiquark, which disappears after the collision with the soft modes. But the disappearance of the anti-quark means the creation of a hole in the anti-quark distribution or a quark number[7]. Figure 3(b) describes the decay process of a quasi-quark which is a mixed state of quarks and antiquark-holes to an on-shell quark. These processes induce a quark-‘antiquark hole’ mixing.
The mixing mechanism of quarks can be described in terms of the notion of resonant scattering as in the case of the (color-)superconductivity [6, 3], although a crucial difference arises owing to the different nature of the soft modes. In the case of the superconductivity, the precursory soft mode is diffusion-mode like and has a strength around . The resonant scattering with the soft mode induces the mixing between a particle and a hole, and gives rise to a gap-like structure in the fermion spectrum around the Fermi energy; correspondingly, the imaginary part of the quark self-energy has a single peak around the Fermi energy[3]. In the present case, the soft modes are propagating modes having a strength at finite energies and hence the resonant scattering of the quarks with the chiral soft modes gives rise to two peaks in at finite energies and induces a mixing between a quark (antiquark) and an antiquark-hole (quark-hole). Thus the two gap-like structures in the quark spectrum are formed at the positive- and negative-energies.


In summary, we have investigated the quark spectrum at near but above the critical temperature of the chiral phase transitions taking account of the effects of the soft mode of the chiral transition. We have shown that the quark spectrum has a three-peak structure at low momentum. We have elucidated that the mechanism for realizing the three-peak structure can be understood as the mixing between a quark(anti-quark) and antiquark-hole (quark-hole) induced by the resonant scattering of the quarks.
References
- [1] T. Hatsuda and T. Kunihiro, Phys. Lett. B 145, 7 (1984); Phys. Rev. Lett. 55, 158 (1985).
- [2] M. Kitazawa, T. Koide, T. Kunihiro and Y. Nemoto, Phys. Rev. D 70, 056003 (2004); Prog. Theor. Phys. 114, 205 (2005).
- [3] M. Kitazawa, T. Kunihiro and Y. Nemoto, arXiv:hep-ph/0505070, Phys. Lett. B, in press.
- [4] M. Kitazawa, T. Koide, T. Kunihiro and Y. Nemoto, Phys. Rev. D 65, 091504 (2002).
- [5] M. Kitazawa, T. Kunihiro and Y. Nemoto, arXiv:hep-ph/0510167.
- [6] B. Jankó, J. Maly and K. Levin, Phys. Rev. B 56, R11407 (1997).
- [7] H. A. Weldon, Phys. Rev. D 61, 036003 (2000).