Radiative return via electron pair production:
Monte Carlo simulation of the process
††thanks: Presented by E. Nowak-Kubat
at XXIX International Conference of Theoretical Physics,
‘Matter To The Deepest’, Ustroń, 8-14 September 2005, Poland.
Work supported in part by
EC 5-th Framework Program under contract
HPRN-CT-2002-00311 (EURIDICE network), TARI project RII3-CT-2004-506078
and
Polish State Committee for Scientific Research
(KBN) under contract 1 P03B 003 28.
Abstract
Contributions from the reaction to the pion form factor measurement via radiative return method are discussed basing on the results of a Monte Carlo generator (EKHARA). The generator contains contributions from the initial and final state emission of a pair from production diagrams and the pair production from space-like and time-like Bhabha diagrams. A detailed study is performed for the - factory energy. Tests of the generation procedure are also presented.
13.40.Ks,13.66.Bc
1 Introduction
The radiative return method [1] is a powerful tool in the measurement of and detailed studies of hadronic interactions [2, 3, 4]. Very accurate knowledge of the hadronic cross section is essential for predictions of the hadronic contributions to , the anomalous magnetic moment of the muon, and to the running of the electromagnetic coupling from its value at low energy up to (for recent reviews look [5, 6, 7]). Due to a complicated experimental setup, the use of Monte Carlo (MC) event generators [8, 9], which include various radiative corrections [10] is indispensable. Some more extensive analysis of that subject can be found also in [11]. The most important hadronic mode, i.e. , was recently measured by KLOE [12] by means of radiative return method. In this measurement only pions (+ missing momenta) in the final state were observed. For that particular measurement there is no difference between photon(s) and the pair production and one should estimate the contribution of the process to the measured cross section. As suggested in [13] the contribution from the production to the is sizable and comes mostly from the t-channel Bhabha–like diagrams. In this paper a Monte Carlo study is performed to test if this claim remains true for a realistic (KLOE) experimental setup.
2 Monte Carlo simulation and its tests
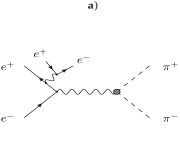
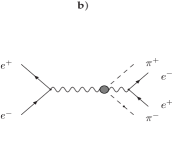
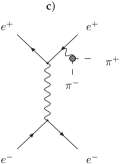
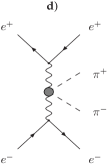
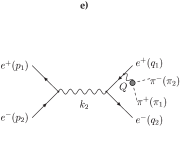
In Fig.1 different types of diagrams contributing to the reaction are shown schematically. In the present version of the Monte Carlo program we include all but the pion pair production process diagrams (Fig.1d), which were estimated to be negligible for DANE energy [14]. We use scalar QED to model the FSR pair emission and the dominance model for the coupling (see [9, 15] and [16] (from where the model of the pion form factor was implemented) for details). The contribution from initial state radiation (ISR) diagrams Fig. 1a, and final state radiation (FSR) diagrams Fig. 1b was discussed in details in [9]. Because of a heavy pair emission, the contribution from diagrams presented schematically in Fig. 1e is completely negligible for any event selection used in the analysis presented below.
We use multi–channel variance reduction method to improve efficiency of the generator and the generation is split into four channels, where two of them absorb peaks present in t–channel diagrams and other two take care of the s–channel peaks. All details will be given in a separate publication [15].
To check correctness of the program code, we have performed a number of tests of the new part of program. Gauge invariance of the sum of the amplitudes was checked analytically for set of diagrams from Fig. 1c,e. To cross check the helicity amplitudes, used in the program to calculate square of the matrix element, we have used also the standard trace method for independent calculation. Both results, summed over polarizations of initial and final leptons, were compared numerically scanning the physical phase space. The biggest relative difference between the two results, which was found, was at the level of for diagrams in Fig. 1c and for diagrams in Fig. 1e. The computer code has been written in quadruple precision not to lose accuracy as sever numerical cancellations occur even when using helicity amplitudes.
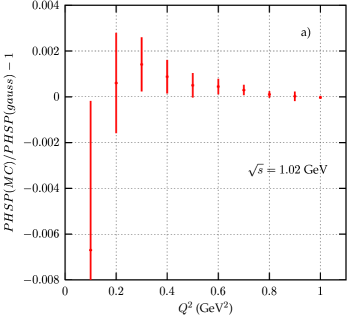
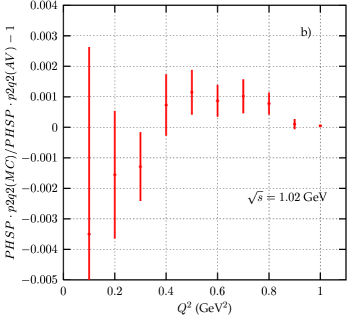
The phase space volume as a function of the square of the invariant mass of the pion system calculated by the Monte Carlo program was compared with a one dimensional Gauss integration. The result is presented in Fig. 2a. The relative difference stays well within errors, which are at most at the level of a few per mil. Because of the complexity of the generation we performed an additional test where a very simple matrix element was introduced. The matrix element was chosen in a way that only a four dimensional numerical integration was necessary. The matrix element was integrated by the Monte Carlo program with full phase space generation and compared with the results obtained with 4-dimensional Gauss integration, where the integration region was divided into () rectangular solids (or more complicated shapes at the border of integration region). In each rectangular solid the 8-point Gauss procedure was used recursively. The error of the Gauss method was estimated as the maximal difference of the results with different subdivisions and the central value was taken as a mean of the smallest and the biggest obtained values. The relative difference between MC result and the Gauss method is presented in Fig.2b. Again the relative difference stays well within errors, which are at most at the level of a few per mil.
| [GeV2] | Rt+int(BN) (%) | Rt+int(MC) (%) | R (BNK) (%) | R(MC) (%) |
|---|---|---|---|---|
| 0.09 | 8.87 | 8.06(15) | 9.35 | 8.54(15) |
| 0.16 | 3.60 | 3.35(5) | 4.08 | 3.84(5) |
| 0.25 | 1.36 | 1.46(2) | 1.83 | 1.92(2) |
| 0.36 | 0.46 | 0.581(7) | 0.90 | 1.028(7) |
| 0.49 | 0.095 | 0.219(2) | 0.51 | 0.639(2) |
| 0.5776 | 0.0056 | 0.01110(8) | 0.40 | 0.5074(8) |
| 0.64 | -0.024 | 0.0658(4) | 0.35 | 0.4400(5) |
| 0.81 | -0.036 | 0.01151(5) | 0.25 | 0.3001(2) |
| 1.0 | -0.012 | 0.000091(1) | 0.10 | 0.10916(5) |
A comparison with existing analytic results [17, 18] was also performed. In the Table 1 the ratio (denoted by Rt+int) of differential cross sections for t-channel (space-like Bhabha with radiated pion pair) plus the interference between t-channel and s-channel ( only the ISR pion pair radiated from is included) to the differential cross section of the reaction (Born: ISR+FSR) is presented as a function of the invariant mass of the two-pion system (Q2). No cuts are imposed as the analytic formulae exist only for that case. A discrepancy at the level of about 10 % between the Monte Carlo and the analytic results can be observed in the region were the pair contribution is sizable and it is much larger in the region were the pair contribution is at the level of 1 per mil or lower. For s-channel diagrams we have found previously [9] an agreement with analytic results of [18] at the level of 1 per mil. We shall observe, that even if we take the relative difference as the error of the MC code, the accuracy of the code is good enough for an estimation of the contribution of the pair production to the process with the photon(s) radiation. To estimate the complete contribution for the (unrealistic) situation with no cuts imposed, the ratio (denoted by R) of the t- and the s-channel pair production to the differential cross section of (Born: ISR+FSR) is also presented in Table 1 both for the MC based and the analytic results [17, 18].
3 An event selection dependence of the pion pair production contribution to the radiative return measurement
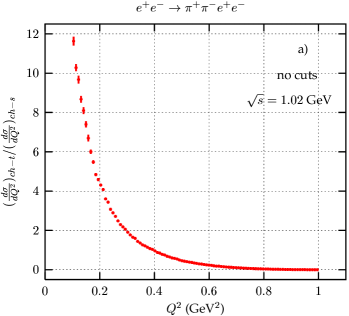
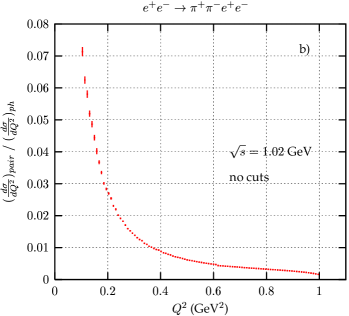
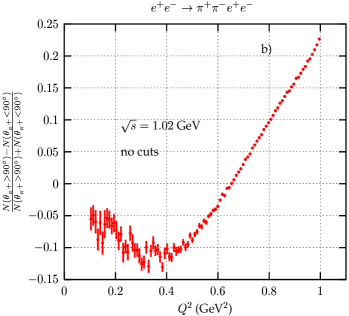
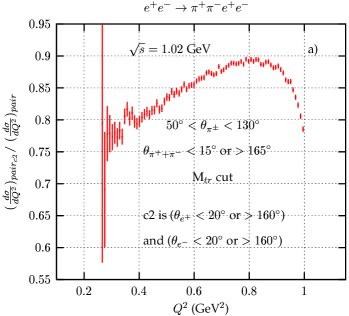
All results from Monte Carlo simulation, presented in this section, are for DANE energy 1.02 GeV. As observed already in the paper [13] t-channel diagrams contribute significantly in the small Q2 region if no cuts are imposed. That is shown in Fig. 3, where Fig. 3a presents the ratio of t-channel to s-channel contributions to the differential cross section of the reaction and Fig. 3b presents the ratio of the differential cross sections of the reactions and . The t-channel diagrams contribution, if no cuts are imposed, is up to 12 times bigger than the s-channel contribution in the small Q2 region and it is negligible for large Q2 values.
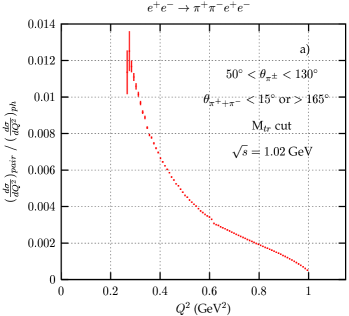
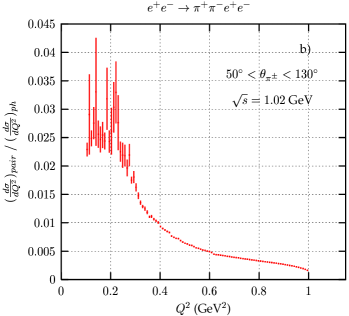
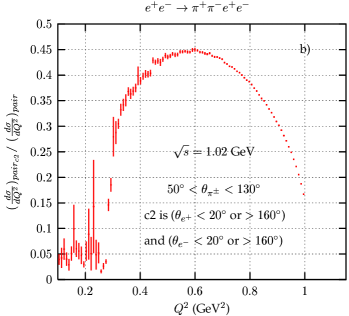
The contribution from the pair emission to the photon emission depends however a lot on the event selection, even if the t–channel contribution still dominates at low Q2. It is seen from Fig. 4, where for KLOE event selection (Fig. 4a) one gets only up to 1.2% contribution from the pair emission and up to 2.5% if one uses only the angular cuts on pions polar angles (Fig. 4b). The pair contribution at the peak is about 0.3% for KLOE cuts and 0.5% when only the angular cuts are imposed. Even if the pair contribution remains small it has to be taken into account if the aimed experimental precision is of the order of 1% or better.
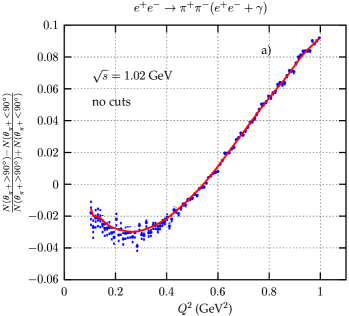
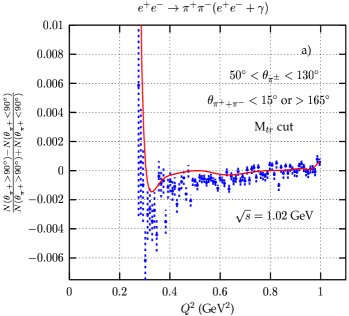
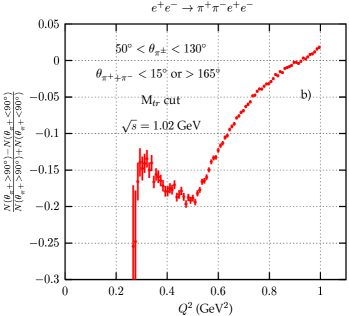
Another important observable used to control the FSR contribution to the cross section of the reaction is the charge asymmetry. Again the measured value contains the pair contributions if only pions are observed. However one can see in Figs. 5a and 6a that this contribution is completely negligible both in the case where no event selection is used (Fig. 5a) and in the case when KLOE event selection is applied (Fig. 6a). That conclusion holds despite the fact that the asymmetry for pair production itself is sizable in both cases (Figs. 5b and 6b).
As stated already in [9], ISR and t-channel of electron pairs can be treated likewise ISR of photons, what results in the change of the radiator function in the radiative return method. Another possibility is to treat the pair production as a background to the process . In that case one would like to reduce that background. The way to do that is to veto the outgoing electrons and/or positrons. However as shown in Fig. 7, where the percentage of the electrons and positrons escaping the detection ( or and or ) is plotted, it is clear that it is practically impossible for KLOE event selection (Fig. 7a), as about 90% of electron–positron pairs escapes detection. For looser cuts one can reduce up to 50% of the pair background (Fig. 7b).
4 Conclusions
A detailed analysis of the contribution of the reaction to the cross section extraction via the radiative return method from the measurement is presented basing on the Monte Carlo simulations with the EKHARA event generator. It is shown that t-channel diagrams contributions dominate at small Q2 values independently on the event selection. The biggest possible contribution to the process reaches about 8 % if no event selection is applied and it is reduced to 1.2 % for KLOE event selection. The reaction does not contribute significantly to charge asymmetry measured in the reaction .
Acknowledgments
The authors are grateful to W. L. van Neerven for providing the correct formula for the t-channel pair production [17].
References
- [1] Min-Shih Chen and P. M. Zerwas, Phys. Rev. D 11 (1975) 58.
- [2] H. Czyż, J. H. Kühn, E. Nowak and G. Rodrigo, Eur. Phys. J. C 35 (2004) 527 [hep-ph/0403062].
- [3] H. Czyż, A. Grzelińska and J. H. Kühn Phys. Lett. B 611 (2005) 116 [hep-ph/0412239].
- [4] H. Czyż, A. Grzelińska, this proceedings.
- [5] M. Davier, S. Eidelman, A. Hocker and Z. Zhang, Eur. Phys. J. C 31, 503 (2003) [hep-ph/0308213].
- [6] F. Jegerlehner, Nucl. Phys. Proc. Suppl. 131, 213 (2004) [hep-ph/0312372].
- [7] A. Nyffeler, Nucl. Phys. Proc. Suppl. 131, 162 (2004).
- [8] S. Binner, J. H. Kühn and K. Melnikov, Phys. Lett. B 459 (1999) 279 [hep-ph/9902399]. H. Czyż and J. H. Kühn, Eur. Phys. J. C 18 (2001) 497 [hep-ph/0008262]. G. Rodrigo, H. Czyż, J.H. Kühn and M. Szopa, Eur. Phys. J. C 24 (2002) 71 [hep-ph/0112184]. H. Czyż, A. Grzelińska, J. H. Kühn and G. Rodrigo, Eur. Phys. J. C 27 (2003) 563 [hep-ph/0212225]; Eur. Phys. J. C 33 (2004) 333 [hep-ph/0308312]; Eur. Phys. J. C 39 (2005) 411 [hep-ph/0404078].
- [9] H. Czyż and E. Nowak, Acta Phys. Polon. B 34 (2003) 5231 [hep-ph/0310335].
- [10] G. Rodrigo, A. Gehrmann-De Ridder, M. Guilleaume and J. H. Kühn, Eur. Phys. J. C 22 (2001) 81 [hep-ph/0106132]. J. H. Kühn and G. Rodrigo, Eur. Phys. J. C 25 (2002) 215 [hep-ph/0204283].
- [11] J. H. Kühn Nucl. Phys. Proc. Suppl. 98 (2001) 289 [hep-ph/0101100]. G. Rodrigo, Acta Phys. Polon. B 32 (2001) 3833 [hep-ph/0111151]. G. Rodrigo, H. Czyż and J. H. Kühn, hep-ph/0205097; Nucl.Phys.Proc.Suppl.123(2003)167 [hep-ph/0210287]; Nucl.Phys.Proc.Suppl. 116 (2003) 249 [hep-ph/0211186]. H. Czyż and A. Grzelińska, Acta Phys. Polon. B 34 (2003) 5219 [hep-ph/0310341]. H. Czyż, A. Grzelińska, J. H. Kühn and G. Rodrigo, Nucl. Phys. Proc. Suppl. 131 (2004) 39 [hep-ph/0312217].
- [12] A. Aloisio et al., [KLOE Collaboration], Phys. Lett. B 606 (2005) 12, [hep-ex/0407048].
- [13] A. Hoefer, J. Gluza and F. Jegerlehner, Eur. Phys. J. C24 (2002) 51, [hep-ph/0107154].
- [14] J. Lee-Franzini, talk at Lepton Moments International Symposium, Cape Cod (June 2003), http://g2pc1.bu.edu/leptonmom/program.html .
- [15] H. Czyż and E. Nowak-Kubat, in preparation.
- [16] C. Bruch, A. Khodjamirian and J. H. Kühn, Eur. Phys. J. C 39, (2005) 41 [hep-ph/0409080].
- [17] F. A. Berends, W. L. van Neerven, Nucl. Phys. B 297 (1988) 427; and W. L. van Neerven private communication.
- [18] B.A. Kniehl, M. Krawczyk, J.H. Kühn, R.G. Stuart, Phys. Lett. B 209 (1988) 337.