Particle production and saturation at HERA
Abstract
Perturbative QCD in the high-energy limit describes the evolution of scattering amplitudes with increasing energy towards and into the so-called saturation regime. Comparisons of the predictions with experimental data for a number of observables led to significant progress and understanding. We discuss the case of particle-production cross-sections measured at HERA and argue that these measurements have the potential to provide evidence for the saturation regime of QCD.
1 Introduction
In the Regge limit of perturbative QCD, i.e. when the centre-of-mass energy in a collision is much bigger than the fixed hard scale of the problem, parton densities inside the colliding particules grow with increasing energy, leading to the growth of scattering amplitudes. When the parton density becomes too large and the scattering amplitudes approach the unitarity limit, one enters in a regime called saturation glr .
The transition to the saturation regime is characterized by the so-called saturation scale which is an intrinsic hard scale of the problem. Contributions to the scattering amplitudes which are neglected as higher twist in the Bjorken limit of perturbative QCD become important in the saturation regime: leading-twist gluon distributions are no more sufficient to describe scattering at high energies.
A consistent approach is to express physical observables in terms of the leading terms in an expansion with respect to the inverse of the center-of-mass energy: this is called the eikonal approximation. This formalism is well-suited because, as the energy increases, density effects and non-linearities that lead to saturation and unitarization of the scattering amplitudes can be taken into account.
In the following, after introducing the eikonal approximation, we discuss the case of particle-production cross-sections measured at HERA. We concentrate on the phenomenology for diffractive observables: we review their model descriptions and investigate their potential to provide evidence for parton saturation.
2 High-energy scattering and saturation

Let us start with the eikonal approximation for quarks and gluons scattering at high energies. When a system of partons propagating at nearly the speed of light passes through a target and interacts with its gluon fields, the dominant couplings are eikonal: the partons have frozen transverse coordinates and the gluon fields of the target do not vary during the interaction. This is justified since the time of propagation through the target is much shorter than the natural time scale on which the target fields vary. The effect of the interaction with the target is that the partonic components of the incident wavefunction pick up eikonal phases: if (resp. ) is the wavefunction of an incoming quark of color index (resp. gluon of color index ) and transverse position (the irrelevant degrees of freedom like spins or polarizations are not explicitly mentioned), then the action of the matrix is (see for instance eikap ):
| (1) |
where denotes the initial state of the target. The phase shifts due to the interaction are the color matrices and the eikonal Wilson lines in the fundamental and adjoint representations respectively, corresponding to propagating quarks and gluons. They are given by
| (2) |
with the gauge field of the target and the generators of in the fundamental () or adjoint () representations. We use the light-cone gauge and denotes an ordering in the light-cone variable along which the incoming partons are propagating. As displayed in Fig.1, all number of gluons exchanges are included in (1), which shows the leading term of an expansion with respect to the inverse of the center-of-mass energy squared where is the total rapidity.
For an incoming state the outgoing state emerging from the eikonal interaction is obtained by the action of the matrix on the partonic components of as indicated by formula (1). The outgoing wavefunction is therefore a function of the Wilson lines (2). When calculating physical observables from , one obtains objects that are target averages of traces of Wilson lines (the traces come from the color summation). For instance, the simplest of these objects is
| (3) |
namely the dipole scattering amplitude ( positions of the quark and antiquark) off a target evolved at rapidity . The target average has been denoted and contains the dependence. The amplitude (3) enters for instance in the DIS total cross-section (see next section). More generally, observables are functions of (3) or more complicated amplitudes. Let us introduce another one of them, which we shall need later:
| (4) |
This is the scattering amplitude for a set of two dipoles () and (). The amplitudes (3) and (4) take values between 0 (transparency) and the black-disk (saturation) limit 1.
To actually compute these amplitudes, one has to evaluate the averages which amounts to calculating averages of Wilson lines: where the target wavefunction represents the probability to find a given field configuration inside the target evolved at rapidity The information contained in the target averages is mainly non-perturbative but the evolution towards higher rapidities can be computed perturbatively, at least in the leading-logarithmic approximation. Several equations have been established with different degrees of approximations, we shall not discuss them here and the reader can refer to proc for more details. Let us only mention the Balitsky-Kovchegov saturation equation (BK) bk which is a closed equation for obtained in a mean-field approximation. We shall refer to the BK equation later on when we link observables to the dipole amplitudes (3) and (4) and discuss phenomenology.
3 Saturation phenomenology at HERA
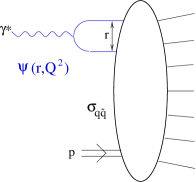
In deep inelastic scattering (DIS), a photon of virtuality collides with a proton. In an appropriate “dipole” frame, the virtual photon undergoes the hadronic interaction via a fluctuation into a dipole (see Fig.2, left); the dipole then interacts with the target proton and one has the following factorization
| (5) |
which relates the DIS total cross-section to the dipole amplitude The function is obtained from the well-known wavefunction which describes the splitting of the photon onto a dipole of transverse size and with the antiquark carrying a fraction of photon longitudinal momentum Note that in this case, not all the information on is relevant as the impact parameter is integrated out: only the cross-section is needed.

Measurements of at HERA have had a great impact on saturation phenomenology, especially the discovery of geometric scaling geom : the fact that is a function of the single variable with the saturation scale and Indeed this has a natural explanation in terms of traveling-wave solutions tv of the BK equation However, this result is obtained neglecting the impact parameter dependence of and considering where is the transverse area of the proton fitted to the data.
In order to understand better and study more consistently the impact parameter dependence of the authors of mms have looked at diffractive vector-meson production (see Fig.2, center). In diffractive deep inelastic scattering, the proton gets out of the collision intact and there is a rapidity gap between that proton and the final state When the final state is a vector meson, the momentum transfer dependence of the cross-section is related to the impact parameter dependence of the dipole amplitude. Indeed the cross-section reads ()
| (6) |
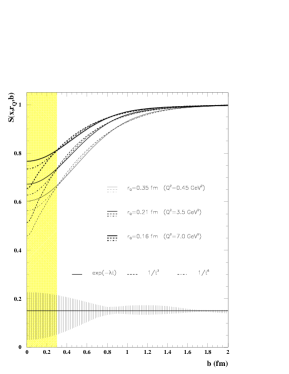
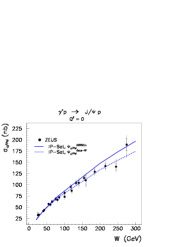
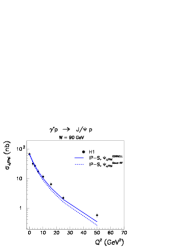
where the function is obtained from both the photon wavefunction and the final-state meson (whose mass has been denoted ) wavefunction By analysing data on meson production at fixed and , the authors extracted the dipole matrix as a function of for a fixed size with Three different sets of data at different have been used. Their results are shown on the left plot of Fig.3; the shaded area on the left is an uncontrolled region due to the lack of large data. The plot shows that the dependence cannot be neglected and that This significant value of indicates that HERA could be entering the saturation regime.
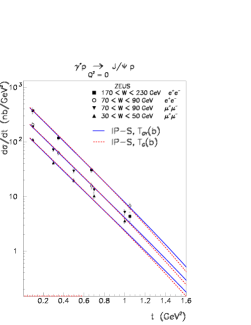
As the importance of the impact parameter had been pointed out, a phenomenological model for the dipole amplitude with an impact parameter profile was proposed in kt . With that saturation parametrization, the authors could well reproduce the data for diffractive production at HERA: the spectrum (6) as well the the and dependences of the total cross-section Their results are displayed on the center and right plots of Fig.3 where one can see the good agreement of the model with the data. A successful description of the same data using numerical simulations of the BK equation was also given in gllmn , confirming the compatibility of saturation predictions.
However in all the model descriptions of spectra, the impact parameter dependence was introduced by hand as one had not extracted any information on the depencence of from saturation equations. That moderated the impact of the results mentioned above. Interestingly, it was recently tvmom ; bkmom pointed out that important information can be obtained from the BK equation when looking at the dependence of For instance, the geometric scaling property was extended: with Parametrizing the dipole amplitude with the momentum transfer instead of the impact parameter opens a new approach to analyse the data. An experimental confirmation of geometric scaling at non-zero momentum transfer would represent a significant success for saturation.
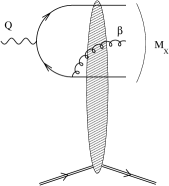
Let us finally consider high-mass diffraction. If the final state diffractive mass is much bigger than the dominant configurations to the final state come from the component of the photon wavefunction (see Fig.2, right) or from higher Fock states, i.e. from the photon dissociation. By contrast, if the dominant configurations come from the component as it was the case for vector-meson production. Let us then consider the kinematical regime where and investigate the component. The right plot of Fig.2 represents the diffractive production of a gluon with transverse momentum and rapidity in the collision of the photon with the target proton. Provided is a hard scale, the gluon momentum spectrum is given by marq
| (7) |
where is the rapidity gap. The two-dimensional vector is given by
| (8) |
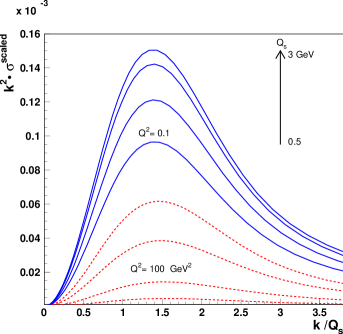
Interestingly enough, independently of the form of the dipole amplitudes and the behavior of the observable as a function of the gluon transverse momentum is the following golmar : it rises as for small values of and falls as for large values of A maximum occurs for a value which is related to the inverse of the typical size for which the matrices approach one; in other words, the maximum reflects the scale at which unitarity sets in. If the energy is large enough so that the saturation scale is hard, unitarity will come as a consequence of parton saturation and If not the case, unitarity will be rather due to non-perturbative physics.
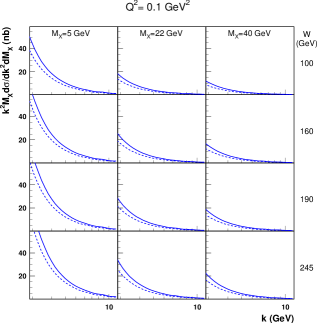
In the saturation case, the model of golmar for the dipole amplitudes allows to plot the whole spectrum (7). This is shown on the left plot of Fig.4 and one can indeed see that the spectrum features a maximum peaked around independently of and Measuring this cross-section at HERA would offer a unique opportunity to test if saturation plays a role in diffraction at the present energies. On the right plot of Fig.4, the cross-section is plotted in the HERA energy range for different values of and total energy corresponding to different values of The saturation scale is the one extracted golec from the data. As expected for realitic jet transverse momenta, and the data would lie on the perturbative side of the bump. There is a big difference in the rise towards the bump between the lowest (top right) and highest (bottom left) bins. A confirmation of this behavior would certainly favor the saturation scenario.
References
- (1) L. V. Gribov, E. M. Levin and M. G. Ryskin, Phys. Rep. 100 (1983) 1.
- (2) A. Hebecker, Phys. Rept. 331 (2000) 1; A. Kovner and U. Wiedemann, Phys. Rev. D64 (2001) 114002.
- (3) L. McLerran, these proceedings; R. Peschanski, these proceedings.
- (4) I. Balitsky, Nucl. Phys. B463 (1996) 99; Y.V. Kovchegov, Phys. Rev. D60 (1999) 034008.
- (5) A. M. Stasto, K. Golec-Biernat and J. Kwiecinski, Phys. Rev. Lett. 86 (2001) 596.
- (6) S. Munier and R. Peschanski, Phys. Rev. Lett. 91 (2003) 232001; Phys. Rev. D69 (2004) 034008.
- (7) S. Munier, A. M. Stasto and A. H. Mueller, Nucl. Phys. B603 (2001) 427.
- (8) H. Kowalski and D. Teaney, Phys. Rev. D68 (2003) 114005.
- (9) E. Gotsman, E. Levin, M. Lublinsky, U. Maor and E. Naftali, Acta Phys. Polon. B34 (2003) 3255.
- (10) C. Marquet, R. Peschanski and G. Soyez, Nucl. Phys. A756 (2005) 399.
- (11) C. Marquet and G. Soyez, Nucl. Phys. A760 (2005) 208.
- (12) C. Marquet, Nucl. Phys. B705 (2005) 319; Nucl. Phys. A755 (2005) 603c.
- (13) K. Golec-Biernat and C. Marquet, Phys. Rev. D71 (2005) 114005; hep-ph/0509034.
- (14) K. Golec-Biernat and M. Wüsthoff, Phys. Rev. D59 (1999) 014017; Phys. Rev. D60 (1999) 114023.