Isospin Breaking in the Relation Between the and Versions of and Implications for
Abstract
We investigate two points related to existing treatments of isospin-breaking corrections to the CVC relation between and . Implications for the value of the hadronic contribution to based on those analyses incorporating hadronic decay data are also considered. We conclude that the uncertainty on the isospin-breaking correction which must be applied to the decay data should be significantly increased, and that the central value of the - “mixing” contribution to this correction may be significantly smaller than indicated by the present standard determination. Such a shift would contribute to reducing the discrepancy between the - and electroproduction-based determinations of the leading order hadronic contribution to .
pacs:
13.40.Em,14.60.Ef,13.66.Bc,13.44.DxI Introduction
It is well known that, after the large, purely leptonic contribution, the largest of the remaining Standard Model contributions to the anomalous magnetic moment of the muon, , is that due to the leading order hadronic vacuum polarization, . This contribution may be evaluated, in terms of experimental cross-section data, using the dispersion integral representation gdr69
| (1) |
where the form of is well-known gdr69 and is the ratio of the “bare” cross-section to that for vpfootnote . Since the isovector part of the electromagnetic (EM) spectral function is related by CVC to the charged current isovector vector spectral function, which can be obtained from the invariant mass distribution of states with zero net strangeness in the decay in , the high precision hadronic decay data of Refs. aleph97 ; opal99 ; cleo00 can, in principle, be used to improve the determination of adh98 ; dh98 ; colangelo03 ; dty04 ; hocker04 .
The high accuracy achieved by the current experimental determination of bnlgminus2 places a significant premium on reducing the error on , which currently dominates the uncertainty on the Standard Model (SM) prediction for (see Ref. passera04 for a recent review). At the desired level of precision, the decay data can be used only after taking into account the small isospin-breaking (IB) corrections to the CVC relation between the charged and neutral current isovector spectral functions. A detailed investigation of possible sources of such corrections, for the numerically dominant contribution, has been made in Refs. cen01 ; cen02 , and the resulting -dependent IB correction factor incorporated into the latest -based analyses dehz03 ; hocker04 of . A comparison of the corrected, -based spectral data with that obtained from the recent high-precision CMD-2 experiment cmd203 , however, shows significant residual disagreement in the components of the two versions of the isovector spectral function dehz03 : the two are compatible below, and in the vicinity of, the peak, but differ by for between and GeV dehz03 . This discrepancy leads to incompatible determinations of , the -based determination lying higher dehz03 ; hmnt04 ; hocker04 , and producing a SM prediction for in agreement with the experimental result, while the EM-based determination yields a SM prediction which differs from experiment by (see Ref. hocker04 and references therein for more details).
The preliminary KLOE radiative return data kloe04 supports the earlier EM-based determination, yielding a value of compatible with that obtained using the CMD-2 data hocker04 . However, as has been pointed out by many authors, the point-by-point agreement between the CMD-2 and KLOE cross-sections is less than satisfactory hocker04 , the KLOE data lying higher than CMD-2 below the peak and lower than CMD-2 both on the peak and above it. The structure of the weight is such that the effects of these discrepancies largely cancel in , but the situation nonetheless remains unsatisfactory.
Differences in the and masses and widths, suggested as one possibility for resolving the spectral function discrepancy gj03 , appear able to reduce locally, but not resolve fully the discrepancy hocker04 .
Recent developments further complicate the picture. In Ref. kmamu , QCD sum rule constraints on the electroproduction and decay data were investigated. Sum rules of the form
| (2) |
were employed, where is either the EM or charged isovector vector current correlator, is the corresponding spectral function, is the relevant threshold, and is a function analytic inside and on the contour . The OPE is employed on the RHS, providing the desired constraints. At the scales employed, the OPE for the vector current correlators is essentially entirely dominated by the dimension perturbative contribution, and hence determined by the single input, . This input may be taken from high-scale determinations of which are independent of the EM and data being tested. It turns out that both the normalization and -dependence of the weighted spectral integrals generated from the hadronic decay data are in excellent agreement with OPE expectations kmamu . In contrast, the weighted EM spectral integrals (obtained using CMD-2 data for the spectral component) do not agree with OPE expectations, having (i) normalizations which are low, and (ii) slopes with respect to which are low kmamu . These observations suggest either a problem with the EM data, or the presence of non-negligible non-one-photon physics contributions to the EM cross-sections. In either case, the results favor determinations of which incorporate hadronic decay data over those based on EM data alone, and a SM prediction for in agreement with the current BNL experimental result bnlgminus2 . The recently-released SND cross-section results snd05pipi are compatible with the IB-corrected data, and support this conclusion.
In light of the above unsettled situation, we revisit the question of the reliability of the determination of the IB corrections which must be applied to the decay data, focussing on two aspects of the existing treatment. We denote the correction to associated with these IB corrections by .
The first point concerns the uncertainty on the estimate for the contribution to associated with “- mixing” footnote1 (present in the EM, but not the , spectral function). The most recent updates of the -based evaluation of dehz03 ; hocker04 , employ the IB corrections of Ref. cen02 (CEN). The CEN analysis is based on a version of the ChPT-constrained model for developed by Guerrero and Pich gp97 (GP). The original GP model, which involved only the isospin conserving (IC) component of , was modified by CEN through the addition of an IB contribution having the nominal - mixing form. We refer to the resulting model as the GP/CEN model. Using the parameter values given by CEN, that part of the full IB correction associated with - mixing becomes
| (3) |
with the quoted uncertainty due essentially entirely to the uncertainty on the parameter , which describes the overall strength of - “mixing” in the model. The uncertainty in Eq. (3) represents only a minor component of the total uncertainty quoted by CEN for the full set of IB corrections cen02 .
The GP/CEN model, however, is not the only one available for . The Gounaris-Sakurai (GS) model gs68 , the Kuhn-Santamaria (KS) model ks90 , and the hidden local symmetry (HLS) model hlsbasic , for example, all predate the GP/CEN model and have been used extensively in the literature. The models differ in the form employed for the broad IC component of the amplitude, which is given (or dominated) by the contribution. Implicit in the CEN error estimate is the (given the narrowness of the , plausible) assumption that the value obtained for will be largely insensitive to which of the models is employed in extracting the interference signal. The high level of cancellation in the -weighted integrals of the interference components of the various model cross-sections, however, makes much more model-dependent than would be naturally anticipated. The resulting theoretical systematic error turns out to significantly exceed that associated with uncertainties on the fitted model parameters for any given model, including the GP/CEN model. This point is discussed in more detail in section II below.
The second point concerns an IB correction not accounted for in the CEN analysis. In the limit that (as for the IC component) the IB component of the amplitude is assumed dominated, away from threshold, by resonance contributions, three such contributions will, in principle, be present in the , resonance region. These are shown in Fig. 1, where the open circles represent IC vertices and the crossed circles IB vertices. and are the isovector and isoscalar members of the vector current octet. The first two graphs represent the - mixing and direct IB decay contributions to the amplitude. They are small away from the peak region, generate contributions to the flavor ‘38’ part of the EM spectral function, and combine to produce the prominent narrow interference shoulder in the experimental cross-section. The remaining graph depicts the contribution associated with the IB (isoscalar) component of the EM decay constant. Such a component of the decay constant is unavoidable in the SM.
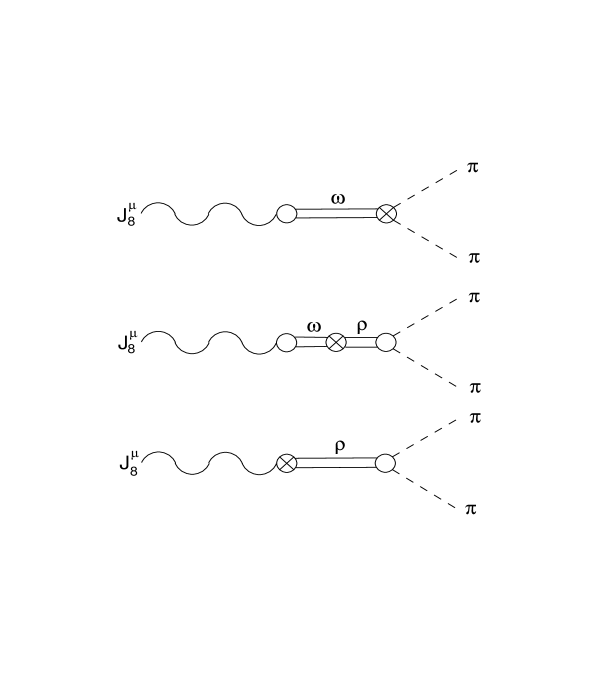
Because of the narrowness of the - interference shoulder, the interference part of the cross-section can, modulo the model dependence noted above, be determined experimentally. The corresponding contribution to can thus also, with the same caveat, be determined experimentally. In contrast, the interference contribution associated with the isoscalar EM decay constant (which also belongs to the flavor ‘38’ part of the cross-section) is identical in shape to the dominant, broad, IC flavor ‘33’ contribution and not (even in principle) extractable experimentally. The corresponding contribution to , which is certainly present at some level in the SM, has not, to our knowledge, been investigated in the literature, and certainly is not included in the treatment of IB corrections employed by CEN, for the reason explained below. It is, in fact, analogous to the - “mixing” contribution, which was also not present in the GP model approach cen01 , and hence had to be added by hand to the GP model expression by CEN cen02 .
The reason the three IB resonance contributions to shown in Fig. 1 are not incorporated in the GP model framework is as follows. The GP model is constructed by implementing the constraints of unitarity, analyticity and short-distance QCD, and requiring that the model expression for match properly onto the known next-to-leading order (NLO) ChPT expression at low energy. This last constraint is realized using the resonance chiral effective theory approach, in which low-energy resonance effects appear through contributions proportional to the NLO low energy constants (LEC’s), , of Gasser and Leutwyler gl85 . It is, however, straightforward to demonstrate that, at NLO, receives contributions only from loops, and not from the NLO LEC’s omtw97 . As a result, none of the resonance-induced IB effects depicted in the figure are incorporated in the GP expression for . Although, numerically, the IB loop effects are tiny near threshold omtw97 , the obvious experimental interference shoulder in the - region shows that this does not remain the case at higher energies. In order to include - interference, it was thus necessary for CEN to add a - “mixing” contribution to the GP model by hand. The broad IB contribution is similarly absent in the GP model approach, and would also have to be added by hand. In Section III we investigate sum rule constraints on this contribution, and, in addition, use the size of the analogous effect in the pseudoscalar sector, as evaluated at NLO in the chiral expansion, to obtain some guidance as to what the natural scale of the effect might be.
A brief summary, and our conclusions, is given in Section IV.
II Model Dependence of
The pion form factor, in the GS model, is given by gs68
| (4) |
where
| (5) |
with
| (6) |
where is the pion CM momentum for squared invariant mass , is the standard -dependent width for vector meson implied by -wave phase space, and .
The HLS model hlsbasic , as implemented by CMD-2, has the form
| (9) |
with a constant. The model provides a good quality fit to the data below GeV despite having no explicit contribution. It also turns out to reproduce the correct final state phases after the model parameters have been fitted hlsgood .
For all of the GS, KS and HLS models, the constant , which parametrizes the strength of the narrow IB amplitude, is taken to be complex. A non-zero phase is, in general, unavoidable in the presence of an IB direct decay contribution footnote1 .
The GP model for the pion form factor is given by gp97
| (10) |
where
| (11) |
with and the -dependent width, appearing in replaced by the resonance chiral effective theory expression
| (12) |
Some IB effects are incorporated into if one evaluates the phase space factors in the -dependent width using the physical charged and masses. In Ref. cen02 , a small rescaling of the coefficient appearing on the RHS of Eq. (12) is allowed in order to account for the MeV contribution of decays to the total width of the cen02 ; vcnote . The CEN modification of , designed to incorporate the - mixing contribution not included in the original GP model, then has the form
| (13) |
The parameter was assumed real by CEN.
The original version of the GP/CEN model, as parametrized by CEN, predates the most recent, corrected version of the CMD2 data, and does not provide a good fit to it, producing a of for the CMD-2 data points. The fit quality can be improved by allowing , (still assumed real) and the rescaling of the resonance chiral effective theory width to be fit to data, but the resulting optimized fit still has a of for the resulting degrees of freedom. The corresponding mixing contribution, , is shifted only slightly from the original CEN value, from to . The fact that the - “mixing” signal is actually a combination of mixing and direct effects, however, means that an effective representation for the combination of the form given by Eq. (13) is not generally possible without allowing to have a non-zero phase mow . If we extend the GP/CEN model in this way, treating the phase as a fourth parameter to be fit to the data, an acceptable fit, having for the remaining degrees of freedom, becomes possible. We refer to this version of the GP/CEN model as GP/CEN∗ in the table below.
The values obtained for in the various models are given in Table 1. All results are generated using versions of the models optimized to the most recent versions of the CMD-2 cmd203 bare cross-section data footnote2 . Only the GP/CEN∗ version of the GP/CEN model is included since the unmodified version does not produce an acceptable quality fit.
| Model | /dof | |
|---|---|---|
| GS | 36/38 | |
| HLS | 37/38 | |
| KS | 37/38 | |
| GP/CEN∗ | 41/39 |
Two things are evident from the table. First, the sensitivity of to the model employed is much larger than that associated with the uncertainties on the values of the fitted model parameters for a given model. Second, by comparing the GP/CEN∗ results to those for the GP/CEN version of the model (quoted above), we see that allowing a non-zero phase for IB parameter leads to a significant decrease in . (A similar effect is produced by the phase of in the other models.) The origin of these effects is easy to understand. In the interference region, the IC amplitude is , where is the Breit-Wigner-like form in the given model. Writing the IB amplitude in the “- mixing” form, generically , with , the flavor ’38’ component of the EM cross-section is then given approximately by the expression
| (14) |
Since the coefficient multiplying in the square bracket of Eq. (14) is antisymmetric about , the corresponding contribution to vanishes in the limit that one neglects the variation of over the region. Since both and are decreasing functions in this region, a small residual positive contribution remains. The coefficient of , in contrast, is symmetric, so no analogous cancellation is present in the corresponding contribution to , i.e., the integral is strongly enhanced relative to the integral. It is the strong cancellation in the integral, combined with small differences in the -dependence of in the different models, which accounts for the significant model dependence in the results for . Since fits to the data favor small positive for all the models considered here, the contribution to is negative. The relative enhancement of the integral means that the cancellation against the contribution, which is absent if one sets to zero from the outset, can be quite significant, even for relatively small .
Table 2 shows the impact of the choice of input data set on , giving the central values corresponding to optimized fits of each model to the bare CMD-2 and SND cross-sections. In the case of the KLOE data, the optimized fits for all four models have footnote4 ; the corresponding results have therefore been omitted from the table. A is also obtained for the optimized fit of the GP/CEN∗ model to the SND data; the corresponding entry in the table, though included for completeness, has been enclosed in parentheses to remind the reader of this fact footnote3 . From the table we see that the variation in values among the different models, for a fixed input data set, is significantly larger than the variation of the results for a given model over the different input data sets. It is thus the theoretical systematic error associated with choice of model used in separating the IC and IB components of the amplitude which dominates the uncertainty in the determination of .
| Model | CMD-2 | SND |
|---|---|---|
| GS | 2.0 | 2.2 |
| HLS | 4.0 | 4.5 |
| KS | 3.9 | 4.3 |
| GP/CEN∗ | 2.0 | (1.6) |
For comparison, and to further illustrate the sensitivity of the mixing contribution to small changes in the data and the resulting model fits, results corresponding to some older fits from the literature are given in Table 3. ‘CEN02’ labels the original GP/CEN result cen02 (with no phase for the parameter ), ‘ALEPH97’ the results corresponding to the “combined” ( plus electroproduction) GS and KS fits of Ref. aleph97 and ‘DAVIER03’ the results corresponding to the similarly “combined” GS fit (Table 4) of Ref. davier03 . Details of the fit procedures, and data sets employed may be found in the original references. The total of the fits relative to the 2003 CMD-2 data are also given. The quoted results correspond in each case to the central values of the fit parameters for the models. Typically, differences between the old and new values of for a given model are much larger than one might have anticipated, given the relatively small changes in the both data and fitted parameter values. This sensitivity is again a reflection of the strong cancellation in the integral of the product of IC and IB amplitudes.
| Model | Reference | /dof | |
|---|---|---|---|
| GS | ALEPH97 | 59/38 | |
| KS | ALEPH97 | 75/38 | |
| GS | DAVIER03 | 65/38 | |
| GP/CEN | CEN02 | 80/42 |
We conclude that the inability to separate the IC and IB components of the amplitudes in a model independent manner leads to a significant uncertainty in the evaluation of . How one assesses this uncertainty depends on one’s attitude to the various models. One stance might be to argue that the GS and GP/CEN models, which explicitly incorporate the constraints of unitarity and analyticity, are to be favored in deciding on a central value. The variation of the results across the different models would then serve as a measure of the residual uncertainty. Alternately, since all of the models are, to greater or lesser extent, phenomenological, and, at least for the CMD-2 data, yield comparable quality fits, one could instead average the results to arrive at a central value, and assign an error large enough to incorporate the highest and lowest values allowed by the errors associated with those on the fitted parameters for the various models. The first stance would yield
| (15) |
the second
| (16) |
A smaller central value, and significantly larger uncertainty, would result if one ignored the poor quality of the model fits and also took the KLOE-based results into account footnote5 .
III The Broad IB Contribution
Although the broad IB contribution to the experimental cross-section has the same shape as the dominant IC contribution, and hence cannot be separated from it experimentally, it can, in principle, be determined theoretically through a QCD sum rule analysis of the IB vector current correlator, , defined by
| (17) |
A non-zero (IB) coupling of the to will produce a broad contribution to the spectral function of , , whose strength, , is proportional to the product of the IC isovector and IB isoscalar decay constants. This product, together with analogous IB products, , for the other vector meson resonances, can, in principle, be determined by matching the appropriate weighted integrals of to the corresponding OPE expressions.
In Ref. mw98 such an analysis was performed using two different families of “pinch-weighted” finite energy sum rules (pFESR’s) kmsr98 . The details of the analysis may be found in Ref. mw98 , and will not be repeated here. The following point is, however, worth noting. Because the numerically dominant term on the OPE side of the various sum rules is that with dimension , the contribution from the VEV’s of four-quark operators, , is not expected to be negligible. The fact that the VEV’s for such operators are typically not well known empirically would normally present a problem for the sum rule analysis. It turns out that the dependence of the on is different for the two different pFESR families, allowing, not only the , but also , to be determined from the combined analysis. The values of which make the different consistent turn out to agree at the level, providing strong support for the reliability of the analysis.
Unfortunately, in the analysis of Ref. mw98 , the - “mixing” contribution to implied by the observed interference shoulder in the EM cross-section was not input separately on the spectral side of the sum rules employed. As a result, the output contains contributions from all three of the IB processes shown in Figure 1. In order to separate out the experimentally inaccessible contribution associated with the third of those processes, we have redone the analysis of Ref. mw98 , this time inputting the “interference” component of , as determined from the CMD-2 experimental data in the interference region. This input, as noted above, depends to some extent on the choice of model for the contribution to the IC component of the amplitude. We have then used the various pFESR’s to solve for the residual broad contribution, which yields directly the contribution to the flavor ‘38’ part of the EM spectral function associated with the third graph in Fig. 1. With current experimental errors, an accurate determination of this “direct” contribution, and hence of the associated contribution to , , turns out to be impossible. We find central values of a natural scale (see below), but with errors, induced by the uncertainy in the integrated (model-dependent) - “interference” term, much larger than these central values. Even more unfortunately, versions of the analysis using errors scaled down artificially by hand suggest that the reduction needed to allow even just a reliable determination of the sign of the direct effect are unlikely to be reachable in the foreseeable future.
In view of the weakness of the constraints arising from the sum rule analysis, we turn to the pseudoscalar sector, and study the size of analogous effects in the IB decay constant, , of the , defined by
| (18) |
At leading order in the chiral expansion, the IB parameter is equal to , where , and is due entirely to IB mixing on the external leg, induced by the non-zero value of . At NLO, receives contributions both from mixing and from IB in the low energy representation of the axial current . The full NLO expression for is given in Ref. gl85 , while the ingredients necessary for separating the mixing and vertex contributions may be found in Ref. kmpietamixing . At NLO the separate mixing and vertex contributions are, as expected on physical grounds, scale dependent. The (scale-dependent) “direct” (vertex) contribution is given by
| (19) | |||||
where is the ChPT renormalization scale, and are the renormalized NLO LEC’s, evaluated at scale gl85 .
Taking, for illustration, the central values for from the main fit of Ref. abt01 , one finds that the leading (NLO) contribution to varies from to of as varies from to GeV. Using the slightly modified fit denoted “fit D” in Ref. bijnens04 , which produces good values for the threshold parameters for and scattering, the ratio runs from to over the same range of . We thus conclude that the NLO “direct” contribution to the IB decay constant ratio is for typical hadronic scale choices. A similar value for the corresponding IB ratio of decay constants would produce a contribution . The central value obtained from the sum rule analysis turns out to be comparable to, or less than, this natural size for all four models considered here. The upper bound implied by the errors, however, is much larger, preventing us from using the sum rule constraints in a meaningful way.
Note that the presence of a small IB component in the EM decay constant would have an impact on the values of and obtained by fitting the various phenomenological models to data. At the natural scale (given above) for this effect, however, the (model-dependent) shift in would be MeV or less, and that in MeV or less. The effect, while contributing to the apparent difference in charged and neutral masses and widths, can thus account for at best a modest fraction of the differences obtained after fitting the models independently to the decay and electroproduction data.
IV Conclusions
We have shown that the model dependence encountered in separating the IB from the IC component of the cross-section leads to a theoretical systematic uncertainty on the - “mixing” contribution to which is several times that associated with the fit parameter uncertainties for any given model. There is also a potentially non-negligible IB contribution, associated with the direct IB coupling of the isoscalar part of the EM current to the , which cannot, even in principle, be determined experimentally. At present, we are able only to make a rough “natural size” estimate for the magnitude of this contribution. Both of these effects would need to be taken into account when estimating the uncertainty in the IB correction required in order to incorporate the spectral data into the evaluation of . The results make it clear that evaluating the “mixing” component of the IB correction using only a single model in the analysis of the cross-section will lead to a significant underestimate in the uncertainties.
In view of the results of the tests involving independent high-scale OPE constraints reported in Ref. kmamu , and the compatibility of the SND and data sets, we base our final results on the SND data set. (The CMD-2 and KLOE values, quoted above, allow alternate choices to be made.) Choosing the GS model as the favored case would lead to a decrease of in , relative to the standard CEN value. Such a shift would lower the -based prediction for in the SM, slightly increasing the difference between the SM prediction and the central experimental value, but leaving them compatible at the level. For a given model, the results for obtained using either the CMD-2 or SND data are actually in good agreement. The decrease in central value relative to CEN would thus also reduce the discrepancy between the CMD-2 and -based determinations of the the contribution to by . The HLS model, which produces an optimized fit to the SND data of comparable quality to that of the GS model, in contrast, shifts the mixing contribution up by , relative to the CEN value. Since the GS model has the constraints of analyticity and unitarity explictly built into it, while the HLS model does not, we have favored the GS model in our discussion of the central value above. It is, however, important to bear in mind that, in terms of quality of fit to the SND data, the models cannot be distinguished, and hence that a significant uncertainty, associated with the model dependence, must be attached to any particular chosen central value. The range of values allowed by the CMD-2 data is fully contained within that allowed by the SND data, but the latter range would need to be significantly extended, including to negative values of , if the lower-quality fits to the KLOE data were also taken into account.
Finally, taking into account the uncertainties already identified by CEN, and adding to these both the increased uncertainty on and a possible direct IB isoscalar EM coupling contribution of the “natural size” discussed above, we arrive at a combined uncertainty for the IB correction one must apply in order to use the data in computing which is . It appears unlikely that this uncertainty can be significantly reduced. Should the new BNL experimental proposal bnlproposal be approved, the uncertainty on the IB corrections would thus exceed those on the experimental determination of , seriously limiting our ability to make use of hadronic decay data in determining the SM prediction for .
Acknowledgements.
KM would like to acknowledge the hospitality of the CSSM, University of Adelaide, and the ongoing support of the Natural Sciences and Engineering Council of Canada.References
- (1) M. Gourdin and E. de Rafael, Nucl. Phys. B10 (1969) 667
- (2) See Ref. dehz02 for further details on the vacuum polarization corrections necessary to convert the cross-sections reported by various collaborations in the literature to the corresponding “bare” cross-section values.
- (3) M. Davier, S. Eidelman, A. Hocker and Z. Zhang, Eur. Phys. J. C27, 497 (2003)
- (4) R. Barate et al. (The ALEPH Collaboration), Z. Phys. C76, 15 (1997)
- (5) K. Anderson et al. (The OPAL Collaboration), Eur. Phys. J. C7, 571 (1999)
- (6) S. Anderson et al. (The CLEO Collaboration), Phys. Rev. D61 112002 (2000)
- (7) R. Alemany, M. Davier and A. Hocker, Eur. Phys. J. C2, 123 (1998)
- (8) M. Davier and A. Hocker, Phys. Lett. B419, 419 (1998); Phys. Lett. B435, 427 (1998)
- (9) G. Colangelo, Nucl. Phys. Proc. Suppl. 131, 185 (2004)
- (10) J.F. de Troconiz and F.J. Yndurain, Phys. Rev. D71 073008 (2005)
- (11) M. Passera, J. Phys. G31, R75 (2005)
- (12) G.W. Bennett et al. (The Muon Collaboration), Phys. Rev. Lett. 92 161802 (2004)
- (13) V. Cirigliano, G. Ecker and H. Neufeld, Phys. Lett. B513, 361 (2001)
- (14) V. Cirigliano, G. Ecker and H. Neufeld, JHEP 0208 002 (2002)
- (15) M. Davier, S. Eidelman, A. Hocker and Z. Zhang, Eur. Phys. J. C31, 503 (2003)
- (16) A. Hocker, hep-ph/0410081
- (17) R.R. Akhmetshin et al. (The CMD-2 Collaboration), Phys. Lett. B527, 161 (2002); Phys. Lett. B578, 285 (2004)
- (18) K. Hagiwara, A.D. Martin, D. Nomura and T. Teubner, Phys. Rev. D69 093003 (2004)
- (19) A. Aloisio et al. (The KLOE Collaboration), Phys. Lett. B606, 12 (2005)
- (20) S. Ghozzi and F. Jegerlehner, Phys. Lett. B583, 222 (2004)
- (21) K. Maltman, hep-ph/0504201
- (22) M.N. Achasov et al. (The SND Collaboration), hep-ex/0506076
- (23) The IB amplitude, whose interference with the leading isospin-conserving component, dominated by intermediate exchange, is responsible for the observed interference shoulder in the experimental cross-section, is in fact generated by both - mixing and direct IB coupling effects. For a given model of the propagator, the experimentally-extracted Orsay phase can be used, in principal, to separate these two contributions mow . The recent CMD-2 data cmd203 shows clear evidence for a non-zero value of the direct IB coupling, as does the recent SND data snd05pipi . At leading order in IB, the two effects both generate contributions to the flavor ’38’ part of the EM spectral function.
- (24) K. Maltman, H.B. O’Connell, and A.G. Williams, Phys. Lett. B376, 19 (1996)
- (25) F. Guerrero and A. Pich, Phys. Lett. B412, 382 (1997)
- (26) G.J. Gounaris and J.J. Sakurai, Phys. Rev. Lett. 21, 244 (1968)
- (27) J.H. Kuhn and A. Santamaria, Z. Phys. C48, 445 (1990)
- (28) M. Bando et al., Phys. Rev. Lett. 54, 1215 (1985)
- (29) M. Benayoun et al., Eur. Phys. J. C2, 269 (1998)
- (30) J. Gasser and H. Leutwyler, Nucl. Phys. 250, 465 (1985)
- (31) H.B. O’Connell et al., hep-ph/9707404
- (32) We thank Vincenzo Cirigliano for clarifying this point.
- (33) Davier daviernote , working with the GS model, has noted that the and values obtained from fits to the bare and vacuum-polarization-dressed versions of the CMD-2 cross-sections differ by MeV. Similar shifts also occur for the other models. These shifts produce corresponding shifts in . The versions associated with the fits to the bare cross-sections, quoted in the text, lie higher than those associated with the fit to the vacuum-polarization-dressed values by , depending on the model. The relevant versions for comparison to the data are, as explained by Davier, those obtained from the fit to the bare cross-sections daviernote .
- (34) M. Davier, Nucl. Phys. Proc. Suppl. 131, 123 (2004)
- (35) The fits to the KLOE data all require significantly larger values of the phase of (or ) than do the corresponding fits to the CMD-2 and SND data sets. Such phase values lead to significantly lower , for the reasons explained in the text. In view of the poor quality of the corresponding fits, we have, however, excluded these results from consideration in arriving at a final assessment of the range of allowed values for . Were one to include them, the range would be considerably expanded, extending even to small negative values.
- (36) Adding an explicit contribution to the GP/CEN∗ model would, of course, allow one to obtain an improved fit to the SND data. Since the original CEN version did not include such a contribution, we do not tabulate results for such a further-modified version of the GP model here.
- (37) The optimized fits to the KLOE data yield and for the GS, KS, HLS and GP/CEN∗ models, respectively.
- (38) K. Maltman and C.E. Wolfe, Phys. Rev. D59 096003 (1999)
- (39) K. Maltman, Phys. Lett. B440, 367 (1998)
- (40) K. Maltman, Phys. Lett. B351, 56 (1995)
- (41) G. Amoros, J. Bijnens and P. Talavera, Nucl. Phys. B602, 87 (2001)
- (42) J. Bijnens, AIP Conf. Proc. 768, 153 (2005)
- (43) M. Davier, Nucl. Phys. Proc. Suppl. 131, 123 (2004)
- (44) See e.g. D. W. Hertzog, Nucl. Phys. Proc. Suppl. 144, 191 (2005)