Particle Ratios in Heavy-Ion Collisions
Abstract
In framework of statistical models, different particle ratios at energies ranging from to GeV are calculated. Assuming that the particle production takes place along the freeze-out curve, we study the sharp peak in ratio observed at SPS energy. We study the responsibility of non-equilibrium quark occupancy of phase space for particle production. Allowing to take values other than that of equilibrium, we got a very well description for ratio at all energies. Using the resulting parameter set, we analyzed the , and ratios. We found that the corresponding peaks all are located at the same value of energy, GeV. At this energy, the entropy per particle is singular. The saddle-point in entropy per particle likely refers to critical phenomenon and change in the phase space.
1 Introduction
The statistical models have been successfully used to describe the particle production in different heavy-ion collisions. Studying the ratios of particle yields [1, 2] is of great interest, not only to determine the freeze-out parameters, and , but also to eliminate the volume fluctuations and the dependence of the freeze-out surface on the initial conditions. On the other hand, serious challenges rise when trying to bring together results from different experiments, like the dependence of on . Although each set of - originally has been calculated by statistical models through combining various particle ratios comparable to the experimental results, it is still debated on the models which try to describe vs. [3, 4, 5, 6, 7, 8].
The ratio represents another challenge for statistical models. The prediction of a sharp peak in ratio at SPS energy [9, 10] wasn’t compatible with the statistical models [11, 12]. The latter merely expect a mild maximum, which ends up with a plateau. There were many attempts to interpret this phenomenon [13, 14].
In this work, we study the ratios of strangeness to non-strangeness particles. We restrict the discussion to the kaon-to-pion and lambda-to-pion ratios. In the experimentally estimated date, we observe that meanwhile there is a sharp peak in ratio, the peak of is much smooth. This is an indication of strangeness asymmetry, which should reflect itself in strange hyperon production. Therefore, a sharp peak in ratio is expected. The observed peak in is smooth. Here . References of experimental data can be found in [14]
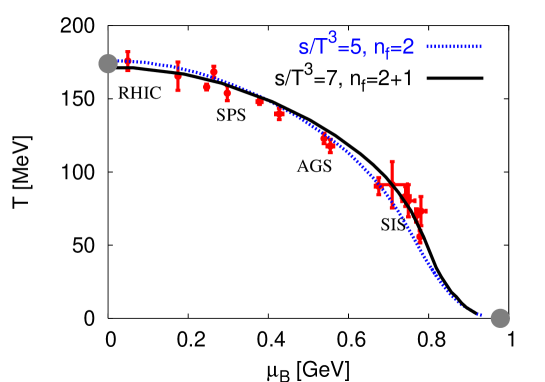
The experimental results on ratio at different energies will be fitted by . are the quark phase space occupancy parameters. They are allowed to take values other than unity; the equilibrium value. The subscript refers to the light and strange quark flavors. This idea has been discussed by Johann Rafelski and his collaborators and implemented in their statistical hadronization model [13, 15]. Note the differences between present work and Ref. [13, 15]! We explicitly assume that the particle production takes place along the freeze-out curve, which is characterized by [6, 7, 8], where is the entropy density. This condition assumes constant degrees of freedom along the line of freeze-out, Fig. 1. Using the parameter set from fitting vs. , we calculate the other ratios. We find that the peak in is not a unique phenomenon [9, 10]. Its height and sharpness are obviously greater than that of the peaks observed in , and . Another worthwhile finding is that all peaks are located at almost one value of energy. This might be an indication for a critical phenomenon.
In the contrast to statistical models with , our calculation with variable results in an excellent agreement with the particle ratios. For non-equilibrium freeze-out, i.e. variable , we find that the entropy per particle which measures the averaged phase space density [16, 17, 18, 19, 20] has a maximum value located at the same collision energy as the peaks of particle ratios do. This can be interpreted as a manifestation of critical phenomenon. According to recent lattice QCD calculations, the critical endpoint might be located at GeV. The corresponding is much close to the energy of the particle ratio peaks. Our estimation for at RHIC energy is qualitatively consistent with the results given in Ref. [18, 21]. To our knowledge, there is no experimental estimation for at lower energies. But there is an indication reported in Ref. [18, 21] that at SPS is higher than at RHIC. This agrees very well with our predictions, Fig. 5.
2 The model
The pressure in hadronic phase is given by the contributions of all hadron resonances treated as a free gas [22, 23, 24, 25]. At finite temperature , strangeness and iso-spin and baryo-chemical potential , the pressure of one hadron reads
| (1) |
where is the single-particle energy and stands for bosons and fermions, respectively. is the spin-isospin degeneracy factor. are the quark phase space occupancy parameters. is the fugacity. is the chemical potential multiplied by the corresponding change. The particle number is given by the derivative of Eq. 1 with respect to the chemical potential of interest. The total pressure is obtained by summation all hadron resonances.
The quark chemistry is given by relating the hadronic chemical potentials and to the quark constituents. with and being the number of light and strange quarks, respectively. and , with and are the light and strange quark quantum number, respectively. The baryo-chemical potential for the light quarks is . is calculated as a function of and under the condition of strangeness conservation. The iso-spin chemical potential .
In carrying out our calculations, we use full grand-canonical statistical set of the thermodynamic parameters. Corrections due to van der Waals repulsive interactions has not been taken into account [25]. Although we do not use Boltzmann approximation, we can for simplicity assume it, in order show on which parameters are the particle ratios depending. For finite iso-spin fugacity we get
| (2) | |||||
| (3) | |||||
| (4) |
The particle numbers at zero chemical potential, , represent the proportional factors in these expressions. is a smooth function of . The fugacity is also smooth function of . Correspondingly a monotonic increase in the particle ratios is expected with energy.
As given in Eq. 1, the statistical parameter appears in the front of Boltzmann exponential, . It gives the averaged occupancy of the phase space relative to equilibrium limit. Therefore, in the equilibrium limit . Assuming the time evolution of the system, we can describe as the ratio between the change in particle number before and after the chemical freeze-out, i.e. . The chemical freeze-out is defined as a time scale, at which there is no longer particle production and the collisions become entirely elastic. In case of phase transition, is expected to be larger than one, because of the large degrees of freedom, weak coupling and expanding phase space above the critical temperature to quark-gluon plasma.
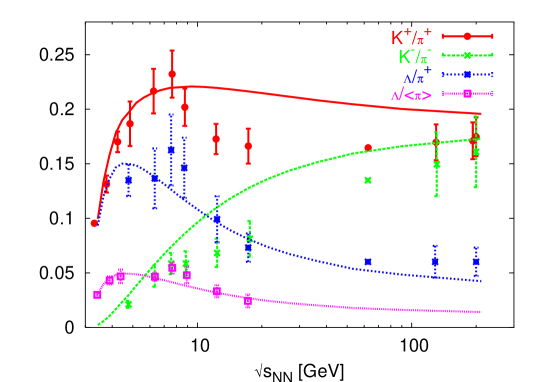
As discussed above, thermal models using can’t describe the characterized peak in . We display this in Fig. 2.
Allowing to take values other than the unity makes it possible to relate to the collision energy. Then we calculate , Eq. (2). The obtained values of and partly given in last two columns of Tab. 1, are greater than one. This is an indication of oversaturation. To be concrete, we emphasize that ratio first increases up to the collision energy at which the sharp peak of ratio is observed. Then it sharply decreases. For higher energies, it smoothly increases. The latter indicates to the fact that the mechanism responsible for the particle production remains unchanged from SPS to RHIC energies. In calculating the other particle ratios, we use the same parameter set. For ratio, the ratio multiplied by , Eq. (3), is the leading parameter. For ratio, the occupancy parameters , Eq. (4), are responsible for the good agreement.
3 Results
In Fig. 2, we plot the predictions from statistical models, i.e. , on the top of the experimentally estimated results at AGS (GeV), SPS (GeV) and RHIC (GeV) energies. For the ratio, there is a good agreement at AGS energy. At the SPS energy, GeV, there is a very mild maximum., which sets on to a plateau. At higher energies, this version of statistical models obviously overestimates the ratio111For instance, at GeV, there is a overestimation. This is in contradiction with the expectations given in Ref. [26]. The value of ratio can be indirectly calculated from the results given in [26]. Accordingly, we find that at the same energy. [14, 27]. Even by taking into consideration the error bars, we find that the resulting values are still above the ”data”. The same behavior can be seen in ratio ( overestimation at GeV but still within the error bars!). The overestimation here starts earlier than . For strange baryons, we find a decreasing population of strange quarks with increasing energy. For , there are underpredictions in two energy regions. The first one is at SPS energy. This indicates to a peak corresponding to that of . The second one is at RHIC energy ( underestimation at GeV, for instance). Here the resulting values lie beneath the error bars. The same behavior is to be observed in .
We can so far summarize this discussion. The maxima do not
all occur at the same energy and therefore, the case for a phase transition is not very
strong [14]. Furthermore, we conclude that the
particle ratios calculated by statistical models with
, disagree
with the experimentally estimated results, especially at RHIC.
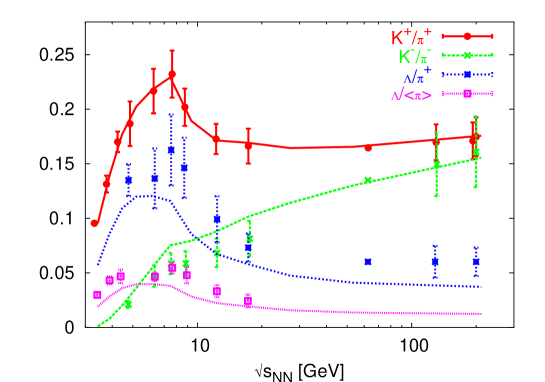
In Fig. 3, we depict the results for variable and
constant . This assumes that only strangeness is out of
equilibrium. The light quark numbers are in
equilibrium. Using variable and has a long
tradition [13, 28, 29]. This
has been based on assuming strangeness saturation as a
signature for QGP [30]. Here, we want to establish the same procedure. We
use as a fit-parameter for
ratio. The results are partly given in Tab. 1. We find that always smaller than
one. This means that the strangeness is always undersaturated. We will leave open the
discussion on the physical interpretation, why the strangeness quantum
number has to be out of equilibrium, while the light quark quantum
numbers are explicitly in equilibrium? The results are convincing. An
obvious underestimation for the particle ratios and
is obtained.
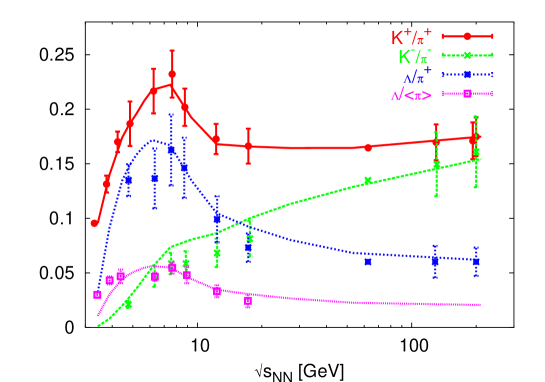
In Fig. 4, we draw the results with varying . In estimating the -values, we fit the experimental results on ratio. is given as an input depending on [13, 31] and correspondingly on . We assumed that the particle production takes place along the freeze-out line, Fig. 1, at which we calculate the temperature, , according to the condition that [6, 7, 8]. is the entropy density. All thermodynamic parameters at fixed. are varying.
It is interesting to note the overall agreement between our predictions and all the experimentally estimated particle ratios. The parameter set obtained from fitting ratio are used to calculate the other particle ratios. There is no fitting done here. Although ratio raises with the energy, we notice a weak slope within the energy region GeV. This might be an indication for strangeness asymmetry. The same behavior can be seen in the experimental data as well. While, our calculations on this particle ratio still lie above the SPS results, the agreement with the AGS and RHIC results is excellent. We also notice that the ratio is not so much sensitive to the change in the light quark occupancy parameter from in Fig. 3 to the non-equilibrium values in this figure.
The worthwhile finding here is that although the heights of the peaks are
different (different strangeness asymmetries), all peaks are located at almost one value of energy,
GeV. This energy value is
corresponding to baryo-chemical potential of
GeV [14]. This value has been reached
by the lead beam at AGeV at CERN-SPS. Another conclusion we can
make so far is that non-equilibrium processes in both light and strange quark
numbers are responsible for particle yields [32].
In present work, we study the responsibility of non-equilibrium quark occupancy of phase space for particle production. We devote this work to strangeness/non-strangeness particle ratios. In the following, we go one step farther in clarifying the physical reason behind the location of the peaks. The dependence of single-particle entropy on the collision energy is related to the averaged phase space density. In Boltzmann limit and for one particle
| (5) |
where is the single-particle energy. In this expression, is related to . Apparently, becomes maximum when the chemical potential gets as large as the single-particle energy . As we assumed Boltzmann limit, the maximum is unity in this case. Depending on the chemical potential , we can insert particles into the phase space. The maximum occupation is reached at . This is an upper limit. Then it becomes prohibited to insert more particles. On the other hand, we can expect - at least theoretically - occupation values larger than this classical upper limit, only if the phase space itself is changed. This situation is most likely provoked by the phase transition. From this discussion we can apparently realize that might play the same role as the statistical parameter does.
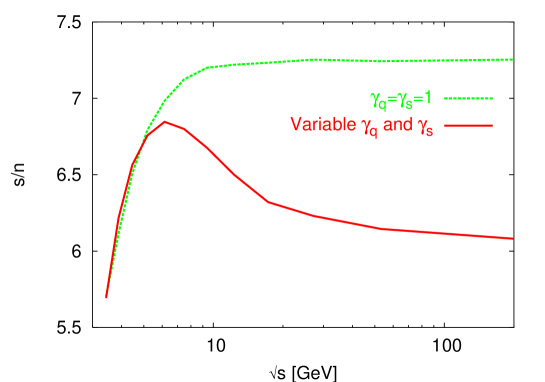
The results on vs. are depicted in
Fig. 5. Again we use here many hadron resonances and full grand-canonical statistical
set of the thermodynamic parameters. In this case, the complete dependence of on
and and consequently on , can straightforwardly be obtained by deriving and
from Eq. 1. For , we find that
increases as the energy raises from AGS to low SPS
(GeV). As we saw in Fig. 2, a
mild maximum in is located at the same value of
. For higher energies, remains constant. Again,
this also is the case in Fig. 2. This
behavior might be an indication that a strong compensation of
the collision energy takes place in this energy region. Although we
introduce more energy in the system, the number of particles
allowed to occupy the phase space remains constant. This is an indirect
signature that the phase space itself remains constant.
For the non-equilibrium case, i.e. variable and , we find almost the same behavior up to GeV. At this energy, there is a singularity in . The singularity might be related to a certain critical phenomenon [33]. For the rest of SPS energies, rapidly decreases. Although the energy is increased and consequently the produced particles, the single-particle entropy decreases. This can only be understood, by assuming that the phase space shrinks. At RHIC, decreases slowly with the energy. The shrinking in phase space becomes slow. If this model would give the correct description, we now might have for the first time a theoretical explanation for the dependence of phase space on energy. The phase space at SPS energy is apparently larger than the phase space at RHIC and LHC. As discussed above, the same behaviour has been found, experimentally [16, 17, 18, 19, 20]. The consequences are that the quark-gluon plasma might be produced at SPS. And detecting its signatures at RHIC might be non-trivial.
About the nature of critical phenomenon, we can’t make any strong statement. One might think of phenomenological models [34] and lattice QCD calculations [35, 36] for critical endpoint. According to lattice, the endpoint so far might be at GeV. According to Ref. [36], GeV. We have to mention here, that the lattice calculations exclusively assume equilibrium and . Therefore the comparison can’t be straightforward.
4 Summary and discussion
We have studied the ratios of strangeness-to-pion in dependence on the collision energies from to GeV. We assumed that the particle production takes place along the freeze-out curve. Fixing all thermodynamic parameters and introducing quark occupancy parameters, we have fitted ratio. Using the resulting parameters, we made predictions for other particle ratios. We found that the agreement is excellent. The and ratios are shown in Ref. [13]. Within the statistical acceptance, we conclude that almost all peaks are located at one value of energy.
Different models have been suggested in order to interpret the maximum observed in the particle ratios. Besides the statistical model at early stage [9, 10] there are two additional models. The first one relates the peak to a transition from baryon-rich to meson-rich hadronic matter [14]. According to the second model [13], the peak separates a high entropy phase from a low entropy one.
As shown, and played the ace in reproducing the particle ratios at all energies. This implies that the particle production is due to non-equilibrium processes in both light and strange quarks. Assuming equilibrium in only one of these quantum numbers is not able to produce the particle ratios as given in Fig. 3.
We introduced as a thermodynamic quantity related to the statistical parameters . In Fig. 5, we found that the sharp peaks of the particle ratios are associated with a singularity in the entropy per particle. The latter can be understood by assuming a rapid modification in the phase space. The entropy per particle seems to play the same role as the statistical parameter does. The dependence of phase space on energy is essential to access the phase transition.
References
- [1] J. Sollfrank, U. W. Heinz, H. Sorge, and N. Xu. J. Phys., G25:363, 1999.
- [2] H. Cleymans, J. Oeschler and K. Redlich. J. Phys., G25:281–285, 1999.
- [3] J. Cleymans and K. Redlich. Phys. Rev., C60:054908, 1999.
- [4] P. Braun-Munzinger and J. Stachel. Nucl. Phys., A606:320–328, 1996.
- [5] V. Magas and H. Satz. Eur. Phys. J., C32:115–119, 2003.
- [6] A. Tawfik. J. Phys., G31:S1105–S1110, 2005.
- [7] A. Tawfik. J. Phys. G 31 S1105 (2005)
- [8] A. Tawfik. Nucl. Phys. A 764 387 (2006)
- [9] M. Gazdzicki and M. I. Gorenstein. Acta Phys. Polon., B30:2705, 1999.
- [10] M. Gazdzicki. J. Phys., G30:S161–S168, 2004.
- [11] P. Braun-Munzinger, J. Cleymans, H. Oeschler, and K. Redlich. Nucl. Phys., A697:902–912, 2002.
- [12] H. Cleymans, J. Oeschler and K. Redlich. Phys. Rev., C59:1663, 1999.
- [13] J. Letessier and J. Rafelski. nucl-th/0504028.
- [14] J. Cleymans, H. Oeschler, K. Redlich, and S. Wheaton. Phys. Lett., B615:50–54, 2005.
- [15] G. Torrieri, et. al., nucl-th/0404083.
- [16] K. K. Gudima, V. D. Toneev, G. Ropke, and H. Schulz. Phys. Rev., C32:1605–1611, 1985.
- [17] D. A. Brown, S. Y. Panitkin, and G. Bertsch. Phys. Rev., C62:014904, 2000.
- [18] J. Cramer. NUCKLEONIKA, 49:S41–S44, 2004.
- [19] B. Tomasik and U. W. Heinz. Phys. Rev., C65:031902, 2002.
- [20] S. V. Akkelin and Yu. M. Sinyukov. nucl-th/0505045.
- [21] C. Nonaka, B. Muller, S. A. Bass, and M. Asakawa. Phys. Rev., C71:051901, 2005.
- [22] F. Karsch, K. Redlich, and A. Tawfik. Eur. Phys. J., C29:549–556, 2003.
- [23] F. Karsch, K. Redlich, and A. Tawfik. Phys. Lett., B571:67–74, 2003.
- [24] K. Redlich, F. Karsch, and A. Tawfik. J. Phys., G30:S1271–S1274, 2004.
- [25] A. Tawfik. Phys. Rev., D71:054502, 2005.
- [26] P. Braun-Munzinger, D. Magestro, K. Redlich, and J. Stachel. Phys. Lett., B518:41–46, 2001.
- [27] D. Zschiesche, S. Schramm, J. Schaffner-Bielich, Horst Stoecker, and W. Greiner. Phys. Lett., B547:7–14, 2002.
- [28] F. Becattini, M. Gazdzicki, A. Keranen, J. Manninen, and R. Stock. Phys. Rev., C69:024905, 2004.
- [29] V. Friese. J. Phys., G31:S911–S918, 2005.
- [30] J. Rafelski, B. Müller, Phys. Rev. Lett. 48 1066 (1982); P. Koch, B. Müller, J. Rafelski, Phys. Rep. 142 167 (1986); J. Rafelski, Phys. Lett. B262 333 (1991)
- [31] J. Rafelski and J. Letessier. hep-ph/0506140.
- [32] H. Stoecker, E. L. Bratkovskaya, M. Bleicher, S. Soff, and X. Zhu. J. Phys., G31:S929–S942, 2005.
- [33] A. M. Tawfik and E. Ganssauge. A. M. Tawfik. hep-ph/0012022. M. I. Adamovich et al. Heavy Ion Phys., 13:213–221, 2001. A. M. Tawfik. hep-ph/0104004. A. M. Tawfik. J. Phys., G27:2283–2296, 2001.
-
[34]
B. Berdnikov and K. Rajagopal, Phys. Rev. D 61, 105017 (2000),
C. Nonaka and M. Asakawa, Phys. Rev. C 71, 044904 (2005). - [35] Z. Fodor and S. D. Katz. JHEP, 04:050, 2004.
- [36] S. Ejiri et al. Prog. Theor. Phys. Suppl., 153:118–126, 2004.