A Critical Study of the BKπ𝐵𝐾𝜋B\to K\pi Puzzle

C. S. Kim1,2111cskim@yonsei.ac.kr, JSPS Fellow,   Sechul Oh3222scoh@phya.yonsei.ac.kr,   and   Chaehyun Yu1333chyu@cskim.yonsei.ac.kr 1Department of Physics, Yonsei University, Seoul 120-479, Korea
2Graduate School of Science, Hiroshima University, Higashi-Hiroshima, Japan 739-8536
3Natural Science Research Institute, Yonsei University, Seoul 120-479, Korea
Abstract

In the light of new experimental results on BKπ𝐵𝐾𝜋B\to K\pi decays, we critically study the decay processes BKπ𝐵𝐾𝜋B\to K\pi in a phenomenological way. Using the quark diagram approach and the currently available data, we determine the allowed values of the relevant theoretical parameters, corresponding to the electroweak (EW) penguin, the color-suppressed tree contribution, etc. In order to find the most likely values of the parameters in a statistically reliable way, we use the χ2superscript𝜒2\chi^{2} minimization technique. Our result shows that the current data for BKπ𝐵𝐾𝜋B\to K\pi decays strongly indicate (large) enhancements of both the EW penguin and the color-suppressed tree contributions. In particular, the color-suppressed tree effect needs to be enhanced by about an order of magnitude to fit the present data.

I Introduction

From B𝐵B factory experiments such as Belle and BaBar, a tremendous amount of experimental data on B𝐵B meson decays are being collected and provide new limits on previously known observables with great precision as well as an opportunity to see very rare processes for the first time. Experimentally plenty of two-body hadronic B𝐵B decays have been observed and some of data for these decay modes, such as BKπ𝐵𝐾𝜋B\to K\pi, are now quite precise, which leads to a precision era for the study of two-body hadronic B𝐵B decays.

There are four different decay channels (and their anti-particle decay channels) for BKπ𝐵𝐾𝜋B\to K\pi processes, depending on the electric charge configuration: B+K0π+superscript𝐵superscript𝐾0superscript𝜋B^{+}\to K^{0}\pi^{+}, B+K+π0superscript𝐵superscript𝐾superscript𝜋0B^{+}\to K^{+}\pi^{0}, B0K+πsuperscript𝐵0superscript𝐾superscript𝜋B^{0}\to K^{+}\pi^{-}, and B0K0π0superscript𝐵0superscript𝐾0superscript𝜋0B^{0}\to K^{0}\pi^{0}. All the BKπ𝐵𝐾𝜋B\to K\pi modes have already been observed in experiment and their CP-averaged branching ratios have been measured within a few percent errors by the BaBar and Belle collaborations HFAG ; Bornheim:2003bv ; Chao:2003ue ; Aubert:2002jb ; Aubert:2004dn ; Aubert:2004km ; Aubert:2004kn . The measurements of direct CP asymmetries for the BKπ𝐵𝐾𝜋B\to K\pi modes had contained large errors so that the results have not led to any decisive conclusions until recently HFAG ; Abe:LP05 ; Chen:2000hv ; Aubert:2004qm ; Chao:2004jy ; Chao:2004mn ; Abe:2004xp . But, the observations of the direct CP asymmetry in B0K±πsuperscript𝐵0superscript𝐾plus-or-minussuperscript𝜋minus-or-plusB^{0}\to K^{\pm}\pi^{\mp} have been recently achieved at the 5.7σ𝜎\sigma level by BaBar and Belle Aubert:2004qm ; Chao:2004jy ; Chao:2004mn . For the other BKπ𝐵𝐾𝜋B\to K\pi modes, the experimental results of the direct CP asymmetries still include large errors. Certain experimental data (e.g.formulae-sequence𝑒𝑔e.g., the branching ratios (BRs)) for BKπ𝐵𝐾𝜋B\to K\pi are currently more precise than the theoretical model predictions based on QCD factorization, perturbative QCD (pQCD), and so on. Thus, these decay modes can provide very useful information for improving the model calculations. Therefore, at the same time, the model-independent study becomes very important.

In the light of those new data, including the direct CP asymmetry in B0K±πsuperscript𝐵0superscript𝐾plus-or-minussuperscript𝜋minus-or-plusB^{0}\to K^{\pm}\pi^{\mp}, many works have been recently done to study the implications of the data Mishima:2004um ; Buras:2004th ; Charng:2004ed ; He:2004ck ; Wu:2004xx ; Baek:2004rp ; Carruthers:2004gj ; Nandi:2004dx ; Morozumi:2004ea . The quark level subprocesses for BKπ𝐵𝐾𝜋B\to K\pi decays are bsqq¯(q=u,d)𝑏𝑠𝑞¯𝑞𝑞𝑢𝑑b\to sq\bar{q}~{}(q=u,d) penguin processes which are potentially sensitive to any new physics effects beyond the Standard Model (SM). Thus, with the currently available precision data, it is very important to investigate these modes as generally and critically as possible. In this work, we critically study the decay processes BKπ𝐵𝐾𝜋B\to K\pi in a phenomenological way. In particular, by noticing that the current data for BKπ𝐵𝐾𝜋B\to K\pi can be divided into two groups (relatively precise ones and the other ones), to be conservative, we try to investigate the implications of the current experimental results systematically in a few steps, as we shall see later. We are mainly interested in investigating whether the conventional SM predictions are consistent with the current data. Furthermore, if there are some deviations between the conventional estimates and the experimental results, we intend to carefully identify the source of the deviations and estimate how large the contribution from the source can be. For this aim, we use the topological amplitudes in the quark diagram approach and try to determine the allowed values of the relevant theoretical parameters, corresponding to the electroweak (EW) penguin, the color-suppressed tree contribution, and so on, by the current data. We should emphasize that the parameter values determined in this way are model-independent. Then, by comparing our result with the conventional SM predictions, we shall be able to verify whether the current data indicate any new physics effects. In order to find the most likely values of the theoretical parameters in a statically reliable way, we will adopt the χ2superscript𝜒2\chi^{2} analysis. In this work, we do not consider Bππ𝐵𝜋𝜋B\to\pi\pi modes simultaneously with BKπ𝐵𝐾𝜋B\to K\pi modes, though they can be connected to each other by using flavor SU(3) symmetry. It is because we do not want that our analysis would be spoiled by the unknown effects of the flavor SU(3) breaking. Also, as it turns out, the data on BKπ𝐵𝐾𝜋B\to K\pi provide enough information for the analysis.

The paper is organized as follows. The relevant formulas for BKπ𝐵𝐾𝜋B\to K\pi modes are presented in Sec. II. In Sec. III, the experimental results for BKπ𝐵𝐾𝜋B\to K\pi are summarized and their implications are investigated. In Sec. IV, the χ2superscript𝜒2\chi^{2} analysis using BKπ𝐵𝐾𝜋B\to K\pi decays is presented. We conclude the analysis in Sec. V.

II The relevant formulas for BKπ𝐵𝐾𝜋B\to K\pi decay modes

In order to specify our notation, let us first summarize the formulas for the relevant decay amplitudes, BRs, direct and indirect (mixing-induced) CP asymmetries. The decay amplitudes for two-body hadronic B𝐵B decays can be represented in terms of the basis of topological quark diagram contributions Gronau:1994rj . The relevant decay amplitudes for BKπ𝐵𝐾𝜋B\to K\pi can be written as Yoshikawa:2003hb

A0+A(B+K0π+)=VubVusA~+VtbVtsP~,superscript𝐴limit-from0𝐴superscript𝐵superscript𝐾0superscript𝜋superscriptsubscript𝑉𝑢𝑏subscript𝑉𝑢𝑠~𝐴superscriptsubscript𝑉𝑡𝑏subscript𝑉𝑡𝑠~𝑃\displaystyle A^{0+}\equiv A(B^{+}\to K^{0}\pi^{+})=V_{ub}^{*}V_{us}\tilde{A}+V_{tb}^{*}V_{ts}\tilde{P}, (1)
A+0A(B+K+π0)=12[VubVus(T~+C~+A~)+VtbVts(P~+P~EW+P~EWC)],superscript𝐴0𝐴superscript𝐵superscript𝐾superscript𝜋012delimited-[]superscriptsubscript𝑉𝑢𝑏subscript𝑉𝑢𝑠~𝑇~𝐶~𝐴superscriptsubscript𝑉𝑡𝑏subscript𝑉𝑡𝑠~𝑃subscript~𝑃𝐸𝑊superscriptsubscript~𝑃𝐸𝑊𝐶\displaystyle A^{+0}\equiv A(B^{+}\to K^{+}\pi^{0})=-{1\over\sqrt{2}}\left[V_{ub}^{*}V_{us}(\tilde{T}+\tilde{C}+\tilde{A})+V_{tb}^{*}V_{ts}(\tilde{P}+\tilde{P}_{EW}+\tilde{P}_{EW}^{C})\right], (2)
A+A(B0K+π)=[VubVusT~+VtbVts(P~+P~EWC)],superscript𝐴absent𝐴superscript𝐵0superscript𝐾superscript𝜋delimited-[]superscriptsubscript𝑉𝑢𝑏subscript𝑉𝑢𝑠~𝑇superscriptsubscript𝑉𝑡𝑏subscript𝑉𝑡𝑠~𝑃superscriptsubscript~𝑃𝐸𝑊𝐶\displaystyle A^{+-}\equiv A(B^{0}\to K^{+}\pi^{-})=-\left[V_{ub}^{*}V_{us}\tilde{T}+V_{tb}^{*}V_{ts}(\tilde{P}+\tilde{P}_{EW}^{C})\right], (3)
A00A(B0K0π0)=12[VubVusC~VtbVts(P~P~EW)],superscript𝐴00𝐴superscript𝐵0superscript𝐾0superscript𝜋012delimited-[]superscriptsubscript𝑉𝑢𝑏subscript𝑉𝑢𝑠~𝐶superscriptsubscript𝑉𝑡𝑏subscript𝑉𝑡𝑠~𝑃subscript~𝑃𝐸𝑊\displaystyle A^{00}\equiv A(B^{0}\to K^{0}\pi^{0})=-{1\over\sqrt{2}}\left[V_{ub}^{*}V_{us}\tilde{C}-V_{tb}^{*}V_{ts}(\tilde{P}-\tilde{P}_{EW})\right], (4)

where Vij(i=u,t;j=s,b)subscript𝑉𝑖𝑗formulae-sequence𝑖𝑢𝑡𝑗𝑠𝑏V_{ij}~{}(i=u,t;~{}j=s,b) are Cabibbo-Kobayashi-Maskawa (CKM) matrix elements and the amplitudes T~~𝑇\tilde{T}, C~~𝐶\tilde{C}, A~~𝐴\tilde{A}, P~~𝑃\tilde{P}, P~EWsubscript~𝑃𝐸𝑊\tilde{P}_{EW}, and P~EWCsuperscriptsubscript~𝑃𝐸𝑊𝐶\tilde{P}_{EW}^{C} are defined as

T~T+Pu+EuPcEc,~𝑇𝑇subscript𝑃𝑢subscript𝐸𝑢subscript𝑃𝑐subscript𝐸𝑐\displaystyle\tilde{T}\equiv T+P_{u}+E_{u}-P_{c}-E_{c}~{}, (5)
C~CPuEu+Pc+Ec,~𝐶𝐶subscript𝑃𝑢subscript𝐸𝑢subscript𝑃𝑐subscript𝐸𝑐\displaystyle\tilde{C}\equiv C-P_{u}-E_{u}+P_{c}+E_{c}~{}, (6)
A~A+Pu+EuPcEc,~𝐴𝐴subscript𝑃𝑢subscript𝐸𝑢subscript𝑃𝑐subscript𝐸𝑐\displaystyle\tilde{A}\equiv A+P_{u}+E_{u}-P_{c}-E_{c}~{}, (7)
P~Pt+EtPcEc13PEWC+23EEWC,~𝑃subscript𝑃𝑡subscript𝐸𝑡subscript𝑃𝑐subscript𝐸𝑐13superscriptsubscript𝑃𝐸𝑊𝐶23superscriptsubscript𝐸𝐸𝑊𝐶\displaystyle\tilde{P}\equiv P_{t}+E_{t}-P_{c}-E_{c}-{1\over 3}P_{EW}^{C}+{2\over 3}E_{EW}^{C}~{}, (8)
P~EWPEW+EEWC,subscript~𝑃𝐸𝑊subscript𝑃𝐸𝑊superscriptsubscript𝐸𝐸𝑊𝐶\displaystyle\tilde{P}_{EW}\equiv P_{EW}+E_{EW}^{C}~{}, (9)
P~EWCPEWCEEWC.superscriptsubscript~𝑃𝐸𝑊𝐶superscriptsubscript𝑃𝐸𝑊𝐶superscriptsubscript𝐸𝐸𝑊𝐶\displaystyle\tilde{P}_{EW}^{C}\equiv P_{EW}^{C}-E_{EW}^{C}~{}. (10)

Here T𝑇T is a color-favored tree amplitude, C𝐶C is a color-suppressed tree, A𝐴A is an annihilation, Pi(i=u,c,t)subscript𝑃𝑖𝑖𝑢𝑐𝑡P_{i}~{}(i=u,c,t) is a QCD penguin, Eisubscript𝐸𝑖E_{i} is a penguin exchange, PEWsubscript𝑃𝐸𝑊P_{EW} is a color-favored EW penguin, PEWCsuperscriptsubscript𝑃𝐸𝑊𝐶P_{EW}^{C} is a color-suppressed EW penguin, EEWCsuperscriptsubscript𝐸𝐸𝑊𝐶E_{EW}^{C} is a color-suppressed EW penguin exchange diagram.

Since the QCD penguin contribution is dominant in BKπ𝐵𝐾𝜋B\to K\pi decays, the decay amplitudes are rewritten as Yoshikawa:2003hb

A0+=|VtbVts|P~[1rAeiδAeiϕ3],superscript𝐴limit-from0superscriptsubscript𝑉𝑡𝑏subscript𝑉𝑡𝑠~𝑃delimited-[]1subscript𝑟𝐴superscript𝑒𝑖superscript𝛿𝐴superscript𝑒𝑖subscriptitalic-ϕ3\displaystyle A^{0+}=-|V_{tb}^{*}V_{ts}|\tilde{P}\left[1-r_{{}_{A}}e^{i\delta^{A}}e^{i\phi_{3}}\right], (11)
A+0=12|VtbVts|P~[1(rTeiδT+rCeiδC+rAeiδA)eiϕ3+rEWeiδEW+rEWCeiδEWC],superscript𝐴012superscriptsubscript𝑉𝑡𝑏subscript𝑉𝑡𝑠~𝑃delimited-[]1subscript𝑟𝑇superscript𝑒𝑖superscript𝛿𝑇subscript𝑟𝐶superscript𝑒𝑖superscript𝛿𝐶subscript𝑟𝐴superscript𝑒𝑖superscript𝛿𝐴superscript𝑒𝑖subscriptitalic-ϕ3subscript𝑟𝐸𝑊superscript𝑒𝑖superscript𝛿𝐸𝑊superscriptsubscript𝑟𝐸𝑊𝐶superscript𝑒𝑖superscript𝛿𝐸𝑊𝐶\displaystyle A^{+0}={1\over\sqrt{2}}|V_{tb}^{*}V_{ts}|\tilde{P}\left[1-(r_{{}_{T}}e^{i\delta^{T}}+r_{{}_{C}}e^{i\delta^{C}}+r_{{}_{A}}e^{i\delta^{A}})e^{i\phi_{3}}+r_{{}_{EW}}e^{i\delta^{EW}}+r_{{}_{EW}}^{C}e^{i\delta^{EWC}}\right], (12)
A+=|VtbVts|P~[1rTeiδTeiϕ3+rEWCeiδEWC],superscript𝐴absentsuperscriptsubscript𝑉𝑡𝑏subscript𝑉𝑡𝑠~𝑃delimited-[]1subscript𝑟𝑇superscript𝑒𝑖superscript𝛿𝑇superscript𝑒𝑖subscriptitalic-ϕ3superscriptsubscript𝑟𝐸𝑊𝐶superscript𝑒𝑖superscript𝛿𝐸𝑊𝐶\displaystyle A^{+-}=|V_{tb}^{*}V_{ts}|\tilde{P}\left[1-r_{{}_{T}}e^{i\delta^{T}}e^{i\phi_{3}}+r_{{}_{EW}}^{C}e^{i\delta^{EWC}}\right], (13)
A00=12|VtbVts|P~[1rEWeiδEW+rCeiδCeiϕ3],superscript𝐴0012superscriptsubscript𝑉𝑡𝑏subscript𝑉𝑡𝑠~𝑃delimited-[]1subscript𝑟𝐸𝑊superscript𝑒𝑖superscript𝛿𝐸𝑊subscript𝑟𝐶superscript𝑒𝑖superscript𝛿𝐶superscript𝑒𝑖subscriptitalic-ϕ3\displaystyle A^{00}=-{1\over\sqrt{2}}|V_{tb}^{*}V_{ts}|\tilde{P}\left[1-r_{{}_{EW}}e^{i\delta^{EW}}+r_{{}_{C}}e^{i\delta^{C}}e^{i\phi_{3}}\right], (14)

where the ratios of each contribution to the dominant one are defined as

rA=|VubVusA~||VtbVtsP~|,rT=|VubVusT~||VtbVtsP~|,rC=|VubVusC~||VtbVtsP~|,formulae-sequencesubscript𝑟𝐴superscriptsubscript𝑉𝑢𝑏subscript𝑉𝑢𝑠~𝐴superscriptsubscript𝑉𝑡𝑏subscript𝑉𝑡𝑠~𝑃formulae-sequencesubscript𝑟𝑇superscriptsubscript𝑉𝑢𝑏subscript𝑉𝑢𝑠~𝑇superscriptsubscript𝑉𝑡𝑏subscript𝑉𝑡𝑠~𝑃subscript𝑟𝐶superscriptsubscript𝑉𝑢𝑏subscript𝑉𝑢𝑠~𝐶superscriptsubscript𝑉𝑡𝑏subscript𝑉𝑡𝑠~𝑃\displaystyle r_{{}_{A}}={|V_{ub}^{*}V_{us}\tilde{A}|\over|V_{tb}^{*}V_{ts}\tilde{P}|}~{},~{}~{}r_{{}_{T}}={|V_{ub}^{*}V_{us}\tilde{T}|\over|V_{tb}^{*}V_{ts}\tilde{P}|}~{},~{}~{}r_{{}_{C}}={|V_{ub}^{*}V_{us}\tilde{C}|\over|V_{tb}^{*}V_{ts}\tilde{P}|}~{}, (15)
rEW=|P~EW||P~|,rEWC=|P~EWC||P~|.formulae-sequencesubscript𝑟𝐸𝑊subscript~𝑃𝐸𝑊~𝑃superscriptsubscript𝑟𝐸𝑊𝐶superscriptsubscript~𝑃𝐸𝑊𝐶~𝑃\displaystyle r_{{}_{EW}}={|\tilde{P}_{EW}|\over|\tilde{P}|}~{},~{}~{}~{}r_{{}_{EW}}^{C}={|\tilde{P}_{EW}^{C}|\over|\tilde{P}|}~{}. (16)

Here δXsuperscript𝛿𝑋\delta^{X} denotes the relative strong phase between each amplitude X~~𝑋\tilde{X} and the dominant P~~𝑃\tilde{P}, and ϕ3(γ)annotatedsubscriptitalic-ϕ3absent𝛾\phi_{3}~{}(\equiv\gamma) is the angle of the unitarity triangle. We note that there exists a conventional hierarchy among the above ratios:

1>rTrEW>rCrEWC>rA.1subscript𝑟𝑇similar-tosubscript𝑟𝐸𝑊subscript𝑟𝐶similar-tosuperscriptsubscript𝑟𝐸𝑊𝐶subscript𝑟𝐴1>r_{{}_{T}}\sim r_{{}_{EW}}>r_{{}_{C}}\sim r_{{}_{EW}}^{C}>r_{A}~{}. (17)

For instance, in the pQCD approach, those ratios are roughly estimated as Mishima:2004um ; Keum:2000wi

rT0.21,rEW0.14,rC0.02,rEWC0.01,rA0.005.formulae-sequencesubscript𝑟𝑇0.21formulae-sequencesubscript𝑟𝐸𝑊0.14formulae-sequencesubscript𝑟𝐶0.02formulae-sequencesuperscriptsubscript𝑟𝐸𝑊𝐶0.01subscript𝑟𝐴0.005\displaystyle r_{{}_{T}}\approx 0.21,~{}r_{{}_{EW}}\approx 0.14,~{}r_{{}_{C}}\approx 0.02,~{}r_{{}_{EW}}^{C}\approx 0.01,~{}r_{A}\approx 0.005~{}. (18)

It is also known that within the SM, under flavor SU(3) symmetry, the relation δTδEWsuperscript𝛿𝑇superscript𝛿𝐸𝑊\delta^{T}\approx\delta^{EW} holds to a good approximation Neubert:1998jq , which can be deduced from the fact that the topology of the color-allowed tree diagram is similar to that of the EW penguin diagram.

Then the CP-averaged BRs are given by

¯0+superscript¯limit-from0\displaystyle\bar{\cal B}^{0+} \displaystyle\equiv ¯(B±Kπ±)12[|A0+|2+|A0|2]proportional-to¯superscript𝐵plus-or-minus𝐾superscript𝜋plus-or-minus12delimited-[]superscriptsuperscript𝐴limit-from02superscriptsuperscript𝐴limit-from02\displaystyle\bar{\cal B}(B^{\pm}\to K\pi^{\pm})\propto\frac{1}{2}\left[|A^{0+}|^{2}+|A^{0-}|^{2}\right] (19)
=\displaystyle= |VtbVts|2|P~|2[12rAcosδAcosϕ3],superscriptsuperscriptsubscript𝑉𝑡𝑏subscript𝑉𝑡𝑠2superscript~𝑃2delimited-[]12subscript𝑟𝐴superscript𝛿𝐴subscriptitalic-ϕ3\displaystyle|V_{tb}^{*}V_{ts}|^{2}|\tilde{P}|^{2}\left[1-2r_{{}_{A}}\cos{\delta^{A}}\cos{\phi_{3}}\right],
2¯+02superscript¯0\displaystyle 2\bar{\cal B}^{+0} \displaystyle\equiv 2¯(B±K±π0)[|A+0|2+|A0|2]proportional-to2¯superscript𝐵plus-or-minussuperscript𝐾plus-or-minussuperscript𝜋0delimited-[]superscriptsuperscript𝐴02superscriptsuperscript𝐴02\displaystyle 2\bar{\cal B}(B^{\pm}\to K^{\pm}\pi^{0})\propto\left[|A^{+0}|^{2}+|A^{-0}|^{2}\right]
=\displaystyle= |VtbVts|2|P~|2{1+2rEWcosδEW+2rEWCcosδEWC\displaystyle|V_{tb}^{*}V_{ts}|^{2}|\tilde{P}|^{2}\left\{1+2r_{{}_{EW}}\cos{\delta^{EW}}+2r_{{}_{EW}}^{C}\cos{\delta^{EWC}}\right.
2(rTcosδT+rCcosδC+rAcosδA)cosϕ3+rT2+rEW2+rC22subscript𝑟𝑇superscript𝛿𝑇subscript𝑟𝐶superscript𝛿𝐶subscript𝑟𝐴superscript𝛿𝐴subscriptitalic-ϕ3superscriptsubscript𝑟𝑇2superscriptsubscript𝑟𝐸𝑊2superscriptsubscript𝑟𝐶2\displaystyle\left.-2\left(r_{{}_{T}}\cos{\delta^{T}}+r_{{}_{C}}\cos{\delta^{C}}+r_{{}_{A}}\cos{\delta^{A}}\right)\cos{\phi_{3}}+r_{{}_{T}}^{2}+r_{{}_{EW}}^{2}+r_{{}_{C}}^{2}\right.
2[rTrEWcos(δTδEW)+rCrEWcos(δCδEW)rTrCcos(δTδC)]cosϕ3},\displaystyle\left.-2\left[r_{{}_{T}}r_{{}_{EW}}\cos{(\delta^{T}-\delta^{EW})}+r_{{}_{C}}r_{{}_{EW}}\cos{(\delta^{C}-\delta^{EW})}-r_{{}_{T}}r_{{}_{C}}\cos{(\delta^{T}-\delta^{C})}\right]\cos{\phi_{3}}\right\},
¯+superscript¯absent\displaystyle\bar{\cal B}^{+-} \displaystyle\equiv ¯(BdK±π)12[|A+|2+|A+|2]proportional-to¯subscript𝐵𝑑superscript𝐾plus-or-minussuperscript𝜋minus-or-plus12delimited-[]superscriptsuperscript𝐴absent2superscriptsuperscript𝐴absent2\displaystyle\bar{\cal B}(B_{d}\to K^{\pm}\pi^{\mp})\propto\frac{1}{2}\left[|A^{+-}|^{2}+|A^{-+}|^{2}\right] (21)
=\displaystyle= |VtbVts|2|P~|2[12rTcosδTcosϕ3+2rEWCcosδEWC+rT2],superscriptsuperscriptsubscript𝑉𝑡𝑏subscript𝑉𝑡𝑠2superscript~𝑃2delimited-[]12subscript𝑟𝑇superscript𝛿𝑇subscriptitalic-ϕ32superscriptsubscript𝑟𝐸𝑊𝐶superscript𝛿𝐸𝑊𝐶superscriptsubscript𝑟𝑇2\displaystyle|V_{tb}^{*}V_{ts}|^{2}|\tilde{P}|^{2}\left[1-2r_{{}_{T}}\cos{\delta^{T}}\cos{\phi_{3}}+2r_{{}_{EW}}^{C}\cos{\delta^{EWC}}+r_{{}_{T}}^{2}\right],
2¯002superscript¯00\displaystyle 2\bar{\cal B}^{00} \displaystyle\equiv 2¯(BdKπ0)[|A00|2+|A00|2]proportional-to2¯subscript𝐵𝑑𝐾superscript𝜋0delimited-[]superscriptsuperscript𝐴002superscriptsuperscript𝐴002\displaystyle 2\bar{\cal B}(B_{d}\to K\pi^{0})\propto\left[|A^{00}|^{2}+|A^{00}|^{2}\right] (22)
=\displaystyle= |VtbVts|2|P~|2[12rEWcosδEW+2rCcosδCcosϕ3+rEW2+rC2]superscriptsuperscriptsubscript𝑉𝑡𝑏subscript𝑉𝑡𝑠2superscript~𝑃2delimited-[]12subscript𝑟𝐸𝑊superscript𝛿𝐸𝑊2subscript𝑟𝐶superscript𝛿𝐶subscriptitalic-ϕ3superscriptsubscript𝑟𝐸𝑊2superscriptsubscript𝑟𝐶2\displaystyle|V_{tb}^{*}V_{ts}|^{2}|\tilde{P}|^{2}\left[1-2r_{{}_{EW}}\cos{\delta^{EW}}+2r_{{}_{C}}\cos{\delta^{C}}\cos{\phi_{3}}+r_{{}_{EW}}^{2}+r_{{}_{C}}^{2}\right]
2rEWrCcos(δEWδC)cosϕ3].\displaystyle\left.-2r_{{}_{EW}}r_{{}_{C}}\cos{(\delta^{EW}-\delta^{C})}\cos{\phi_{3}}\right].

Here we neglect the r2superscript𝑟2r^{2} terms which include tiny quantities rAsubscript𝑟𝐴r_{{}_{A}} and rEWCsuperscriptsubscript𝑟𝐸𝑊𝐶r_{{}_{EW}}^{C}. However, because recent studies on two-body hadronic B𝐵B decays show that the color-suppressed tree contribution could be enhanced to a large amount through certain mechanisms Cheng:2004ru ; Kim:2004hx ; Keum:2003js , we keep the r2superscript𝑟2r^{2} terms including rCsubscript𝑟𝐶r_{{}_{C}}, in order to take that possibility into account. This treatment differs from that in Refs. Mishima:2004um ; Yoshikawa:2003hb , where all the r2superscript𝑟2r^{2} terms including rAsubscript𝑟𝐴r_{{}_{A}} and rEWCsuperscriptsubscript𝑟𝐸𝑊𝐶r_{{}_{EW}}^{C} as well as rCsubscript𝑟𝐶r_{{}_{C}} were simply neglected. In fact, we shall see that a large enhancement of the color-suppressed tree contribution is indicated by the present experimental data for BKπ𝐵𝐾𝜋B\to K\pi modes.

The ratios between the BRs for the BKπ𝐵𝐾𝜋B\to K\pi modes can be also defined as

R1=τ+¯+τ0¯0+=12rTcosδTcosϕ3+rT2,subscript𝑅1superscript𝜏superscript¯absentsuperscript𝜏0superscript¯limit-from012subscript𝑟𝑇superscript𝛿𝑇subscriptitalic-ϕ3superscriptsubscript𝑟𝑇2\displaystyle R_{1}=\frac{\tau^{+}\bar{\cal B}^{+-}}{\tau^{0}\bar{\cal B}^{0+}}=1-2r_{{}_{T}}\cos\delta^{T}\cos\phi_{3}+r_{{}_{T}}^{2}, (23)
Rc=2¯+0¯0+=1+2rEWcosδEW2(rTcosδT+rCcosδC)cosϕ3subscript𝑅𝑐2superscript¯0superscript¯limit-from012subscript𝑟𝐸𝑊superscript𝛿𝐸𝑊2subscript𝑟𝑇superscript𝛿𝑇subscript𝑟𝐶superscript𝛿𝐶subscriptitalic-ϕ3\displaystyle R_{c}=\frac{2\bar{\cal B}^{+0}}{\bar{\cal B}^{0+}}=1+2r_{{}_{EW}}\cos\delta^{EW}-2\left(r_{{}_{T}}\cos\delta^{T}+r_{{}_{C}}\cos\delta^{C}\right)\cos\phi_{3}
+rT2+rEW2+rC2+2rTrCcos(δTδC)superscriptsubscript𝑟𝑇2superscriptsubscript𝑟𝐸𝑊2superscriptsubscript𝑟𝐶22subscript𝑟𝑇subscript𝑟𝐶superscript𝛿𝑇superscript𝛿𝐶\displaystyle\hskip 68.28644pt+r_{{}_{T}}^{2}+r_{{}_{EW}}^{2}+r_{{}_{C}}^{2}+2r_{{}_{T}}r_{{}_{C}}\cos(\delta^{T}-\delta^{C})
2[rEWrTcos(δEWδT)+rEWrCcos(δEWδC)]cosϕ3,2delimited-[]subscript𝑟𝐸𝑊subscript𝑟𝑇superscript𝛿𝐸𝑊superscript𝛿𝑇subscript𝑟𝐸𝑊subscript𝑟𝐶superscript𝛿𝐸𝑊superscript𝛿𝐶subscriptitalic-ϕ3\displaystyle\hskip 68.28644pt-2\left[r_{{}_{EW}}r_{{}_{T}}\cos(\delta^{EW}-\delta^{T})+r_{{}_{EW}}r_{{}_{C}}\cos(\delta^{EW}-\delta^{C})\right]\cos\phi_{3}, (24)
Rn=¯+2¯00=1+2rEWcosδEW2(rTcosδT+rCcosδC)cosϕ3subscript𝑅𝑛superscript¯absent2superscript¯0012subscript𝑟𝐸𝑊superscript𝛿𝐸𝑊2subscript𝑟𝑇superscript𝛿𝑇subscript𝑟𝐶superscript𝛿𝐶subscriptitalic-ϕ3\displaystyle R_{n}=\frac{\bar{\cal B}^{+-}}{2\bar{\cal B}^{00}}=1+2r_{{}_{EW}}\cos\delta^{EW}-2\left(r_{{}_{T}}\cos\delta^{T}+r_{{}_{C}}\cos\delta^{C}\right)\cos\phi_{3}
+rT2rEW2rC2+4rEW2cos2δEWsuperscriptsubscript𝑟𝑇2superscriptsubscript𝑟𝐸𝑊2superscriptsubscript𝑟𝐶24superscriptsubscript𝑟𝐸𝑊2superscript2superscript𝛿𝐸𝑊\displaystyle\hskip 68.28644pt+r_{{}_{T}}^{2}-r_{{}_{EW}}^{2}-r_{{}_{C}}^{2}+4r_{{}_{EW}}^{2}\cos^{2}\delta^{EW}
+2rEW[rCcos(δEWδC)2rTcosδEWcosδT4rCcosδEWcosδC]cosϕ32subscript𝑟𝐸𝑊delimited-[]subscript𝑟𝐶superscript𝛿𝐸𝑊superscript𝛿𝐶2subscript𝑟𝑇superscript𝛿𝐸𝑊superscript𝛿𝑇4subscript𝑟𝐶superscript𝛿𝐸𝑊superscript𝛿𝐶subscriptitalic-ϕ3\displaystyle\hskip 68.28644pt+2r_{{}_{EW}}\left[r_{{}_{C}}\cos(\delta^{EW}-\delta^{C})-2r_{{}_{T}}\cos\delta^{EW}\cos\delta^{T}-4r_{{}_{C}}\cos\delta^{EW}\cos\delta^{C}\right]\cos\phi_{3}
+4rCcosδC(rCcosδC+rTcosδT)cos2ϕ3,4subscript𝑟𝐶superscript𝛿𝐶subscript𝑟𝐶superscript𝛿𝐶subscript𝑟𝑇superscript𝛿𝑇superscript2subscriptitalic-ϕ3\displaystyle\hskip 68.28644pt+4r_{{}_{C}}\cos\delta^{C}\left(r_{{}_{C}}\cos\delta^{C}+r_{{}_{T}}\cos\delta^{T}\right)\cos^{2}\phi_{3}, (25)

where τ+(τ0)superscript𝜏superscript𝜏0\tau^{+}~{}(\tau^{0}) is a life time of B+(B0)superscript𝐵superscript𝐵0B^{+}~{}(B^{0}) and τ+/τ0=1.086±0.017superscript𝜏superscript𝜏0plus-or-minus1.0860.017\tau^{+}/\tau^{0}=1.086\pm 0.017 Eidelman:2004wy . We notice that R1subscript𝑅1R_{1} depends only on rTsubscript𝑟𝑇r_{{}_{T}}, δTsuperscript𝛿𝑇\delta^{T}, and ϕ3subscriptitalic-ϕ3\phi_{3}. If rTsubscript𝑟𝑇r_{{}_{T}} and ϕ3subscriptitalic-ϕ3\phi_{3} can be determined by other observations, R1subscript𝑅1R_{1} becomes dependent only on δTsuperscript𝛿𝑇\delta^{T} which is the relative strong phase between the effective tree and the effective strong penguin contribution. Subsequently, using the experimental value of R1subscript𝑅1R_{1}, one can determine the value of δTsuperscript𝛿𝑇\delta^{T}, as shown in the next section.

The direct CP asymmetries are given by

𝒜CP0+superscriptsubscript𝒜𝐶𝑃limit-from0\displaystyle{\cal A}_{CP}^{0+} \displaystyle\equiv (BK¯0π)(B+K0π+)(BK¯0π)+(B+K0π+)=2rAsinδAsinϕ3,superscript𝐵superscript¯𝐾0superscript𝜋superscript𝐵superscript𝐾0superscript𝜋superscript𝐵superscript¯𝐾0superscript𝜋superscript𝐵superscript𝐾0superscript𝜋2subscript𝑟𝐴superscript𝛿𝐴subscriptitalic-ϕ3\displaystyle\frac{{\cal B}(B^{-}\to\bar{K}^{0}\pi^{-})-{\cal B}(B^{+}\to K^{0}\pi^{+})}{{\cal B}(B^{-}\to\bar{K}^{0}\pi^{-})+{\cal B}(B^{+}\to K^{0}\pi^{+})}=-2r_{{}_{A}}\sin{\delta^{A}}\sin{\phi_{3}}, (26)
𝒜CP+0superscriptsubscript𝒜𝐶𝑃0\displaystyle{\cal A}_{CP}^{+0} \displaystyle\equiv (BKπ0)(B+K+π0)(BKπ0)+(B+K+π0)superscript𝐵superscript𝐾superscript𝜋0superscript𝐵superscript𝐾superscript𝜋0superscript𝐵superscript𝐾superscript𝜋0superscript𝐵superscript𝐾superscript𝜋0\displaystyle\frac{{\cal B}(B^{-}\to K^{-}\pi^{0})-{\cal B}(B^{+}\to K^{+}\pi^{0})}{{\cal B}(B^{-}\to K^{-}\pi^{0})+{\cal B}(B^{+}\to K^{+}\pi^{0})} (27)
=\displaystyle= 2[rTsinδTrCsinδCrAsinδA+rTrEWsin(δT+δEW)\displaystyle-2\left[r_{{}_{T}}\sin{\delta^{T}}-r_{{}_{C}}\sin{\delta^{C}}-r_{{}_{A}}\sin{\delta^{A}}+r_{{}_{T}}r_{{}_{EW}}\sin{(\delta^{T}+\delta^{EW})}\right.
+rCrEWsin(δC+δEW)]sinϕ3\displaystyle\left.+r_{{}_{C}}r_{{}_{EW}}\sin{(\delta^{C}+\delta^{EW})}\right]\sin{\phi_{3}}
[2rTrCsin(δT+δC)+rT2sin2δT+rC2sin2δC]sin2ϕ3,delimited-[]2subscript𝑟𝑇subscript𝑟𝐶superscript𝛿𝑇superscript𝛿𝐶superscriptsubscript𝑟𝑇22superscript𝛿𝑇superscriptsubscript𝑟𝐶22superscript𝛿𝐶2subscriptitalic-ϕ3\displaystyle-\left[2r_{{}_{T}}r_{{}_{C}}\sin{(\delta^{T}+\delta^{C})}+r_{{}_{T}}^{2}\sin{2\delta^{T}}+r_{{}_{C}}^{2}\sin{2\delta^{C}}\right]\sin{2\phi_{3}},
𝒜CP+superscriptsubscript𝒜𝐶𝑃absent\displaystyle{\cal A}_{CP}^{+-} \displaystyle\equiv (B¯0Kπ+)(B0K+π)(B¯0Kπ+)+(B0K+π)superscript¯𝐵0superscript𝐾superscript𝜋superscript𝐵0superscript𝐾superscript𝜋superscript¯𝐵0superscript𝐾superscript𝜋superscript𝐵0superscript𝐾superscript𝜋\displaystyle\frac{{\cal B}(\bar{B}^{0}\to K^{-}\pi^{+})-{\cal B}(B^{0}\to K^{+}\pi^{-})}{{\cal B}(\bar{B}^{0}\to K^{-}\pi^{+})+{\cal B}(B^{0}\to K^{+}\pi^{-})} (28)
=\displaystyle= 2rTsinδTsinϕ3rT2sin2δTsin2ϕ3,2subscript𝑟𝑇superscript𝛿𝑇subscriptitalic-ϕ3superscriptsubscript𝑟𝑇22superscript𝛿𝑇2subscriptitalic-ϕ3\displaystyle-2r_{{}_{T}}\sin{\delta^{T}}\sin{\phi_{3}}-r_{{}_{T}}^{2}\sin{2\delta^{T}}\sin{2\phi_{3}},
𝒜CP00superscriptsubscript𝒜𝐶𝑃00\displaystyle{\cal A}_{CP}^{00} \displaystyle\equiv (B¯0K¯0π0)(B0K0π0)(B¯0K¯0π0)+(B0K0π0)superscript¯𝐵0superscript¯𝐾0superscript𝜋0superscript𝐵0superscript𝐾0superscript𝜋0superscript¯𝐵0superscript¯𝐾0superscript𝜋0superscript𝐵0superscript𝐾0superscript𝜋0\displaystyle\frac{{\cal B}(\bar{B}^{0}\to\bar{K}^{0}\pi^{0})-{\cal B}(B^{0}\to K^{0}\pi^{0})}{{\cal B}(\bar{B}^{0}\to\bar{K}^{0}\pi^{0})+{\cal B}(B^{0}\to K^{0}\pi^{0})} (29)
=\displaystyle= 2[rCsinδC+rEWrCsin(δEW+δC)]sinϕ3rC2sin2δCsin2ϕ3.2delimited-[]subscript𝑟𝐶superscript𝛿𝐶subscript𝑟𝐸𝑊subscript𝑟𝐶superscript𝛿𝐸𝑊superscript𝛿𝐶subscriptitalic-ϕ3superscriptsubscript𝑟𝐶22superscript𝛿𝐶2subscriptitalic-ϕ3\displaystyle 2\left[r_{{}_{C}}\sin{\delta^{C}}+r_{{}_{EW}}r_{{}_{C}}\sin{(\delta^{EW}+\delta^{C})}\right]\sin{\phi_{3}}-r_{{}_{C}}^{2}\sin{2\delta^{C}}\sin{2\phi_{3}}.

Notice that considering the conventional hierarchy given in (17) and (18), the direct CP asymmetries 𝒜CP+0superscriptsubscript𝒜𝐶𝑃0{\cal A}_{CP}^{+0} (27) and 𝒜CP+superscriptsubscript𝒜𝐶𝑃absent{\cal A}_{CP}^{+-} (28) are expected to be almost same including their signs, because the dominant contribution to them is identical. However, the current experimental data show that 𝒜CP+0superscriptsubscript𝒜𝐶𝑃0{\cal A}_{CP}^{+0} and 𝒜CP+superscriptsubscript𝒜𝐶𝑃absent{\cal A}_{CP}^{+-} are quite different from each other and even have the opposite signs to each other, as shown in Table 1.

The time-dependent CP asymmetry for B0KSπ0superscript𝐵0subscript𝐾𝑆superscript𝜋0B^{0}\to K_{{}_{S}}\pi^{0} is defined as

𝒜KSπ0(t)subscript𝒜subscript𝐾𝑆superscript𝜋0𝑡\displaystyle{\cal A}_{K_{{}_{S}}\pi^{0}}(t) \displaystyle\equiv Γ(B¯0(t)KSπ0)Γ(B0(t)KSπ0)Γ(B¯0(t)KSπ0)+Γ(B0(t)KSπ0)Γsuperscript¯𝐵0𝑡subscript𝐾𝑆superscript𝜋0Γsuperscript𝐵0𝑡subscript𝐾𝑆superscript𝜋0Γsuperscript¯𝐵0𝑡subscript𝐾𝑆superscript𝜋0Γsuperscript𝐵0𝑡subscript𝐾𝑆superscript𝜋0\displaystyle\frac{\Gamma(\bar{B}^{0}(t)\to K_{{}_{S}}\pi^{0})-\Gamma(B^{0}(t)\to K_{{}_{S}}\pi^{0})}{\Gamma(\bar{B}^{0}(t)\to K_{{}_{S}}\pi^{0})+\Gamma(B^{0}(t)\to K_{{}_{S}}\pi^{0})} (30)
\displaystyle\equiv SKSπ0sin(Δmdt)CKSπ0cos(Δmdt),subscript𝑆subscript𝐾𝑆superscript𝜋0Δsubscript𝑚𝑑𝑡subscript𝐶subscript𝐾𝑆superscript𝜋0Δsubscript𝑚𝑑𝑡\displaystyle S_{K_{{}_{S}}\pi^{0}}\sin(\Delta m_{d}~{}t)-C_{K_{{}_{S}}\pi^{0}}\cos(\Delta m_{d}~{}t)~{},

where ΓΓ\Gamma denotes the relevant decay rate and ΔmdΔsubscript𝑚𝑑\Delta m_{d} is the mass difference between the two B0superscript𝐵0B^{0} mass eigenstates. The SKSπ0subscript𝑆subscript𝐾𝑆superscript𝜋0S_{K_{{}_{S}}\pi^{0}} and CKSπ0subscript𝐶subscript𝐾𝑆superscript𝜋0C_{K_{{}_{S}}\pi^{0}} are CP violating parameters. In the case that the tree contributions are neglected for B0KSπ0superscript𝐵0subscript𝐾𝑆superscript𝜋0B^{0}\to K_{{}_{S}}\pi^{0}, the mixing-induced CP violating parameter SKSπ0subscript𝑆subscript𝐾𝑆superscript𝜋0S_{K_{{}_{S}}\pi^{0}} is equal to sin(2ϕ1)2subscriptitalic-ϕ1\sin(2\phi_{1}) [ϕ1(β)annotatedsubscriptitalic-ϕ1absent𝛽\phi_{1}~{}(\equiv\beta) is the angle of the unitarity triangle]. The expression for SKSπ0subscript𝑆subscript𝐾𝑆superscript𝜋0S_{K_{{}_{S}}\pi^{0}} (up to r2superscript𝑟2r^{2} order) is given by

SKSπ0subscript𝑆subscript𝐾𝑆superscript𝜋0\displaystyle S_{K_{{}_{S}}\pi^{0}} =\displaystyle= sin(2ϕ1)(12rC2sin2ϕ3)+cos(2ϕ1)[2rCcosδCsinϕ3\displaystyle\sin(2\phi_{1})\left(1-2r_{{}_{C}}^{2}\sin^{2}\phi_{3}\right)+\cos(2\phi_{1})\left[2r_{{}_{C}}\cos\delta^{C}\sin\phi_{3}\right. (31)
+2rEWrCcos(δEW+δC)sinϕ3rC2cos(2δC)sin(2ϕ3)].\displaystyle\left.+2r_{{}_{EW}}r_{{}_{C}}\cos(\delta^{EW}+\delta^{C})\sin\phi_{3}-r_{{}_{C}}^{2}\cos(2\delta^{C})\sin(2\phi_{3})\right].

The measured value of SKSπ0subscript𝑆subscript𝐾𝑆superscript𝜋0S_{K_{{}_{S}}\pi^{0}} (Table 1) is different from the well-established value of sin(2ϕ1)=0.725±0.0372subscriptitalic-ϕ1plus-or-minus0.7250.037\sin(2\phi_{1})=0.725\pm 0.037 measured through BJ/ψK()𝐵𝐽𝜓superscript𝐾B\to J/\psi K^{(*)} HFAG . It may indicate that the subleading terms including rCsubscript𝑟𝐶r_{{}_{C}} and rEWsubscript𝑟𝐸𝑊r_{{}_{EW}} in Eq. (31) play an important role.

III The BKπ𝐵𝐾𝜋B\to K\pi puzzle and its implication

We first summarize the present status of the experimental results on BKπ𝐵𝐾𝜋B\to K\pi modes in Table I, which includes the BRs, the direct CP asymmetries (𝒜CP)subscript𝒜𝐶𝑃({\cal A}_{CP}), and the mixing-induced CP asymmetry (SKsπ0)subscript𝑆subscript𝐾𝑠superscript𝜋0(S_{K_{s}\pi^{0}}). We see that the averages of the current experimental values for the BRs include only a few percent errors. Furthermore, the direct CP asymmetry in B0K±πsuperscript𝐵0superscript𝐾plus-or-minussuperscript𝜋minus-or-plusB^{0}\to K^{\pm}\pi^{\mp} has been recently observed by the BaBar and Belle collaborations whose values are in good agreement with each other (Table I): the world average value is

𝒜CP+=0.115±0.018.superscriptsubscript𝒜𝐶𝑃absentplus-or-minus0.1150.018{\cal A}_{CP}^{+-}=-0.115\pm 0.018~{}. (32)

The direct CP asymmetry data for the other BKπ𝐵𝐾𝜋B\to K\pi modes involve large uncertainties. We also present the values of R1subscript𝑅1R_{1}, Rcsubscript𝑅𝑐R_{c}, and Rnsubscript𝑅𝑛R_{n}, defined in Eqs. (23) - (25), which are obtained from the experimental results given in Table I:

R1=0.82±0.06,subscript𝑅1plus-or-minus0.820.06\displaystyle R_{1}=0.82\pm 0.06~{}, (33)
Rc=1.00±0.09,subscript𝑅𝑐plus-or-minus1.000.09\displaystyle R_{c}=1.00\pm 0.09~{}, (34)
Rn=0.82±0.08.subscript𝑅𝑛plus-or-minus0.820.08\displaystyle R_{n}=0.82\pm 0.08~{}. (35)

It has been also claimed that within the SM, RcRn0subscript𝑅𝑐subscript𝑅𝑛0R_{c}-R_{n}\approx 0 Buras:2004th ; Buras:2003dj . From Eqs. (24) and (25), it is indeed clear that RcRnsubscript𝑅𝑐subscript𝑅𝑛R_{c}\approx R_{n}, if the r2superscript𝑟2r^{2} order terms including rEWsubscript𝑟𝐸𝑊r_{{}_{EW}} or rCsubscript𝑟𝐶r_{{}_{C}} are negligible. In other words, any difference between Rcsubscript𝑅𝑐R_{c} and Rnsubscript𝑅𝑛R_{n} would arise from the contributions from the subdominant r2superscript𝑟2r^{2} order terms including rEWsubscript𝑟𝐸𝑊r_{{}_{EW}} or rCsubscript𝑟𝐶r_{{}_{C}}. The above experimental data show the pattern Rc>Rnsubscript𝑅𝑐subscript𝑅𝑛R_{c}>R_{n} Buras:2004th ; Buras:2003dj , which would imply the enhancement of the EW penguin and/or the color-suppressed tree contributions. We will investigate the implication of the data below.

We remind that assuming the conventional hierarchy as in Eqs. (17) and (18), 𝒜CP+0superscriptsubscript𝒜𝐶𝑃0{\cal A}_{CP}^{+0} is expected to be almost the same as 𝒜CP+superscriptsubscript𝒜𝐶𝑃absent{\cal A}_{CP}^{+-}: in particular, they would have the same sign. However, the data show that 𝒜CP+0superscriptsubscript𝒜𝐶𝑃0{\cal A}_{CP}^{+0} differs by 3.5σ𝜎\sigma from 𝒜CP+superscriptsubscript𝒜𝐶𝑃absent{\cal A}_{CP}^{+-}. This is a very interesting observation with the new measurements of 𝒜CP+superscriptsubscript𝒜𝐶𝑃absent{\cal A}_{CP}^{+-} by BaBar and Belle, even though the measurements of 𝒜CP+0superscriptsubscript𝒜𝐶𝑃0{\cal A}_{CP}^{+0} still include sizable errors. One may need to explain on the theoretical basis how this feature can happen.

Table 1: Experimental data on the CP-averaged branching ratios (¯¯\bar{\cal B} in units of 106superscript10610^{-6}), the direct CP asymmetries (𝒜CPsubscript𝒜𝐶𝑃{\cal A}_{CP}), and the mixing-induced CP asymmetry (SKsπ0subscript𝑆subscript𝐾𝑠superscript𝜋0S_{K_{s}\pi^{0}}) for BKπ𝐵𝐾𝜋B\to K\pi modes. The SKsπ0subscript𝑆subscript𝐾𝑠superscript𝜋0S_{K_{s}\pi^{0}} is equal to sin(2ϕ1)2subscriptitalic-ϕ1\sin(2\phi_{1}) in the case that tree amplitudes are neglected for B0Ksπ0superscript𝐵0subscript𝐾𝑠superscript𝜋0B^{0}\to K_{s}\pi^{0} HFAG ; Bornheim:2003bv ; Chao:2003ue ; Aubert:2002jb ; Aubert:2004dn ; Aubert:2004km ; Aubert:2004kn ; Abe:LP05 ; Chen:2000hv ; Aubert:2004qm ; Chao:2004jy ; Chao:2004mn ; Abe:2004xp .
CLEO Belle BaBar Average
¯(B±K0π±)¯superscript𝐵plus-or-minussuperscript𝐾0superscript𝜋plus-or-minus\bar{\cal B}(B^{\pm}\to K^{0}\pi^{\pm}) 18.83.31.8+3.7+2.1subscriptsuperscript18.83.72.13.31.818.8^{+3.7+2.1}_{-3.3-1.8} 22.0±1.9±1.1plus-or-minus22.01.91.122.0\pm 1.9\pm 1.1 26.0±1.3±1.0plus-or-minus26.01.31.026.0\pm 1.3\pm 1.0 24.1±1.3plus-or-minus24.11.324.1\pm 1.3
¯(B±K±π0)¯superscript𝐵plus-or-minussuperscript𝐾plus-or-minussuperscript𝜋0\bar{\cal B}(B^{\pm}\to K^{\pm}\pi^{0}) 12.92.21.1+2.4+1.2subscriptsuperscript12.92.41.22.21.112.9^{+2.4+1.2}_{-2.2-1.1} 12.0±1.30.9+1.3plus-or-minus12.0subscriptsuperscript1.31.30.912.0\pm 1.3^{+1.3}_{-0.9} 12.0±0.7±0.6plus-or-minus12.00.70.612.0\pm 0.7\pm 0.6 12.1±0.8plus-or-minus12.10.812.1\pm 0.8
¯(B0K±π)¯superscript𝐵0superscript𝐾plus-or-minussuperscript𝜋minus-or-plus\bar{\cal B}(B^{0}\to K^{\pm}\pi^{\mp}) 18.02.10.9+2.3+1.2subscriptsuperscript18.02.31.22.10.918.0^{+2.3+1.2}_{-2.1-0.9} 18.5±1.0±0.7plus-or-minus18.51.00.718.5\pm 1.0\pm 0.7 19.2±0.6±0.6plus-or-minus19.20.60.619.2\pm 0.6\pm 0.6 18.9±0.7plus-or-minus18.90.718.9\pm 0.7
¯(B0K0π0)¯superscript𝐵0superscript𝐾0superscript𝜋0\bar{\cal B}(B^{0}\to K^{0}\pi^{0}) 12.83.31.4+4.0+1.7subscriptsuperscript12.84.01.73.31.412.8^{+4.0+1.7}_{-3.3-1.4} 11.7±2.31.3+1.2plus-or-minus11.7subscriptsuperscript2.31.21.311.7\pm 2.3^{+1.2}_{-1.3} 11.4±0.9±0.6plus-or-minus11.40.90.611.4\pm 0.9\pm 0.6 11.5±1.0plus-or-minus11.51.011.5\pm 1.0
𝒜CP0+superscriptsubscript𝒜𝐶𝑃limit-from0{\cal A}_{CP}^{0+} +0.18±0.24±0.02plus-or-minus0.180.240.02+0.18\pm 0.24\pm 0.02 +0.05±0.05±0.01plus-or-minus0.050.050.01+0.05\pm 0.05\pm 0.01 0.09±0.05±0.01plus-or-minus0.090.050.01-0.09\pm 0.05\pm 0.01 0.02±0.04plus-or-minus0.020.04-0.02\pm 0.04
𝒜CP+0superscriptsubscript𝒜𝐶𝑃0{\cal A}_{CP}^{+0} 0.29±0.23±0.02plus-or-minus0.290.230.02-0.29\pm 0.23\pm 0.02 +0.04±0.04±0.02plus-or-minus0.040.040.02+0.04\pm 0.04\pm 0.02 +0.06±0.06±0.01plus-or-minus0.060.060.01+0.06\pm 0.06\pm 0.01 +0.04±0.04plus-or-minus0.040.04+0.04\pm 0.04
𝒜CP+superscriptsubscript𝒜𝐶𝑃absent{\cal A}_{CP}^{+-} 0.04±0.16±0.02plus-or-minus0.040.160.02-0.04\pm 0.16\pm 0.02 0.113±0.022±0.008plus-or-minus0.1130.0220.008-0.113\pm 0.022\pm 0.008 0.133±0.030±0.009plus-or-minus0.1330.0300.009-0.133\pm 0.030\pm 0.009 0.115±0.018plus-or-minus0.1150.018-0.115\pm 0.018444This average also includes the CDF result: 0.04±0.08±0.01plus-or-minus0.040.080.01-0.04\pm 0.08\pm 0.01.
𝒜CP00superscriptsubscript𝒜𝐶𝑃00{\cal A}_{CP}^{00} - +0.16±0.29±0.05plus-or-minus0.160.290.05+0.16\pm 0.29\pm 0.05 0.06±0.18±0.03plus-or-minus0.060.180.03-0.06\pm 0.18\pm 0.03 +0.001±0.155plus-or-minus0.0010.155+0.001\pm 0.155
SKsπ0subscript𝑆subscript𝐾𝑠superscript𝜋0S_{K_{s}\pi^{0}} - +0.30±0.59±0.11plus-or-minus0.300.590.11+0.30\pm 0.59\pm 0.11 +0.350.33+0.30±0.04plus-or-minussubscriptsuperscript0.350.300.330.04+0.35^{+0.30}_{-0.33}\pm 0.04 +0.34±0.29plus-or-minus0.340.29+0.34\pm 0.29

Based on the current experimental data shown in Table I, we critically investigate their implications to the underlying theory on the BKπ𝐵𝐾𝜋B\to K\pi processes. There are nine observables available for the BKπ𝐵𝐾𝜋B\to K\pi modes as shown in Table 1, but if the expectedly very small annihilation term rAsubscript𝑟𝐴r_{{}_{A}} is neglected, the observable 𝒜CP0+superscriptsubscript𝒜𝐶𝑃limit-from0{\cal A}_{CP}^{0+} becomes irrelevant and only eight observables remain relevant. There are also eight parameters (|P|𝑃|P|, rTsubscript𝑟𝑇r_{{}_{T}}, rEWsubscript𝑟𝐸𝑊r_{{}_{EW}}, rCsubscript𝑟𝐶r_{{}_{C}}, δTsuperscript𝛿𝑇\delta^{T}, δEWsuperscript𝛿𝐸𝑊\delta^{EW}, δCsuperscript𝛿𝐶\delta^{C}, ϕ3subscriptitalic-ϕ3\phi_{3}) relevant to the above observables, neglecting the very small terms including rAsubscript𝑟𝐴r_{{}_{A}} and rEWCsuperscriptsubscript𝑟𝐸𝑊𝐶r_{{}_{EW}}^{C} [see Eqs. (19- (29)]. In our numerical analysis, we take into account the above eight parameters. [Equivalently, we can use only seven observables (i.e.formulae-sequence𝑖𝑒i.e., three Ri(i=1,c,n)subscript𝑅𝑖𝑖1𝑐𝑛R_{i}~{}(i=1,c,n) and the CP asymmetries in Table 1), and take into account the seven parameters (except for |P|𝑃|P| among the above eight parameters).]

We remind that among the data shown in Table I, five of them, such as the BRs and 𝒜CP+superscriptsubscript𝒜𝐶𝑃absent{\cal A}_{CP}^{+-}, involve relatively small uncertainties, but the others still include large errors. Based on this observation, we consider four different cases as follows. (i) We first use only the four BRs in our analysis. (ii) Then, the data for 𝒜CP+superscriptsubscript𝒜𝐶𝑃absent{\cal A}_{CP}^{+-} are also considered in addition to the BRs. Since the observables used in the cases (i) and (ii) are measured relatively accurately, the result from these cases would provide more solid implications. (iii) Then, we also use the data for SKsπ0subscript𝑆subscript𝐾𝑠superscript𝜋0S_{K_{s}\pi^{0}} besides those used in the case (ii). (iv) Finally we use all the currently available data.

In Fig. 1, we show the excluded region for rCsubscript𝑟𝐶r_{{}_{C}} and rEWsubscript𝑟𝐸𝑊r_{{}_{EW}} by the current data for the cases (i)-(iv). The graph has been obtained by using the current data given in Table I as constraints and directly solving Eqs. (19)-(22), (27)-(29), and (31) for 54ϕ367superscript54subscriptitalic-ϕ3superscript6754^{\circ}\leq\phi_{3}\leq 67^{\circ} and 0rT0.40subscript𝑟𝑇0.40\leq r_{{}_{T}}\leq 0.4. [Here we use the value of ϕ3subscriptitalic-ϕ3\phi_{3} given by the unitarity triangle fit Bona:2005vz . In order to study the effect of rTsubscript𝑟𝑇r_{{}_{T}} to the result, we vary the value of rTsubscript𝑟𝑇r_{{}_{T}} from 0 to 0.4.] The bold straight (parallel and vertical) lines denote the conventional values of rC0.02subscript𝑟𝐶0.02r_{{}_{C}}\approx 0.02 and rEW0.14subscript𝑟𝐸𝑊0.14r_{{}_{EW}}\approx 0.14, respectively. The solid, dotted, dashed, dot-dashed lines, respectively, correspond to each case of (i)-(iv) in order: i.e.formulae-sequence𝑖𝑒i.e., each case of using (i) only 4 BRs, (ii) 4BRs+𝒜CP+4BRssuperscriptsubscript𝒜𝐶𝑃absent4~{}{\rm BRs}+{\cal A}_{CP}^{+-}, (iii) 4BRs+𝒜CP++SKsπ04BRssuperscriptsubscript𝒜𝐶𝑃absentsubscript𝑆subscript𝐾𝑠superscript𝜋04~{}{\rm BRs}+{\cal A}_{CP}^{+-}+S_{K_{s}\pi^{0}}, and (iv) all the available data.

One should keep in mind that in the cases (i)-(iii) only the “excluded” regions for rCsubscript𝑟𝐶r_{{}_{C}} and rEWsubscript𝑟𝐸𝑊r_{{}_{EW}} are meaningful at 1σ𝜎\sigma level in Fig. 1, because in these cases the number of parameters are larger than that of the relevant equations so that the other regions (except for the excluded regions) do not exactly mean the “allowed” regions for rCsubscript𝑟𝐶r_{{}_{C}} and rEWsubscript𝑟𝐸𝑊r_{{}_{EW}} at 1σ𝜎\sigma level.

Refer to caption

Figure 1: The excluded region for rCsubscript𝑟𝐶r_{{}_{C}} and rEWsubscript𝑟𝐸𝑊r_{{}_{EW}}. The bold straight (parallel and vertical) lines denote the conventional values of rC0.02subscript𝑟𝐶0.02r_{{}_{C}}\approx 0.02 and rEW0.14subscript𝑟𝐸𝑊0.14r_{{}_{EW}}\approx 0.14, respectively. The solid, dotted, dashed, dot-dashed lines, respectively, correspond to the case of using only 4 BRs, 4BRs+𝒜CP+4BRssuperscriptsubscript𝒜𝐶𝑃absent4~{}{\rm BRs}+{\cal A}_{CP}^{+-}, 4BRs+𝒜CP++SKsπ04BRssuperscriptsubscript𝒜𝐶𝑃absentsubscript𝑆subscript𝐾𝑠superscript𝜋04~{}{\rm BRs}+{\cal A}_{CP}^{+-}+S_{K_{s}\pi^{0}}, and all the available data. Here 54ϕ367superscript54subscriptitalic-ϕ3superscript6754^{\circ}\leq\phi_{3}\leq 67^{\circ} and 0rT0.40subscript𝑟𝑇0.40\leq r_{{}_{T}}\leq 0.4 were used.

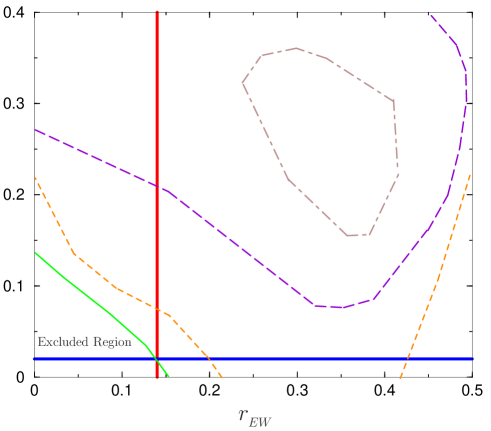
The result shows that when the data only for the BRs of BKπ𝐵𝐾𝜋B\to K\pi modes are taken into account [solid line; case (i)], the conventional SM predictions of both rEW0.14subscript𝑟𝐸𝑊0.14r_{{}_{EW}}\approx 0.14 and rC0.02subscript𝑟𝐶0.02r_{{}_{C}}\approx 0.02 are not completely excluded by the data. But, we should add a remark that this fact holds only for rT0.4subscript𝑟𝑇0.4r_{{}_{T}}\approx 0.4 (which is larger than the conventional SM estimate of rT0.2subscript𝑟𝑇0.2r_{{}_{T}}\approx 0.2), because for smaller rTsubscript𝑟𝑇r_{{}_{T}} larger values of rEWsubscript𝑟𝐸𝑊r_{{}_{EW}} and rCsubscript𝑟𝐶r_{{}_{C}} are excluded: e.g.formulae-sequence𝑒𝑔e.g., for rT=0.3subscript𝑟𝑇0.3r_{{}_{T}}=0.3 or smaller, rEW0.14subscript𝑟𝐸𝑊0.14r_{{}_{EW}}\approx 0.14 together with rC0.02subscript𝑟𝐶0.02r_{{}_{C}}\approx 0.02 is no more allowed. In other words, for the conventional value of rT0.2subscript𝑟𝑇0.2r_{{}_{T}}\approx 0.2, the data for the BRs indicates that the EW penguin and/or the color-suppressed tree term need(s) to be enhanced. [This conclusion equivalently holds when the data only for Ri(i=1,c,n)subscript𝑅𝑖𝑖1𝑐𝑛R_{i}~{}(i=1,c,n) given in Eqs. (33- (35) are considered.]

When the constraint from the measured ACP+superscriptsubscript𝐴𝐶𝑃absentA_{CP}^{+-} is added to the case (i), the conventional values of rEWsubscript𝑟𝐸𝑊r_{{}_{EW}} and rCsubscript𝑟𝐶r_{{}_{C}} are not allowed at the same time (dotted line). For instance, if rEW0.14subscript𝑟𝐸𝑊0.14r_{{}_{EW}}\approx 0.14, then the values of rCsubscript𝑟𝐶r_{{}_{C}} smaller than 0.07 are excluded. On the other hand, if rC0.02subscript𝑟𝐶0.02r_{{}_{C}}\approx 0.02, then the values of rEWsubscript𝑟𝐸𝑊r_{{}_{EW}} smaller than 0.19 are not allowed by the data. It would be also possible that both rEWsubscript𝑟𝐸𝑊r_{{}_{EW}} and rCsubscript𝑟𝐶r_{{}_{C}} are simultaneously enhanced: e.g.formulae-sequence𝑒𝑔e.g., rEW0.17subscript𝑟𝐸𝑊0.17r_{{}_{EW}}\approx 0.17 and rC0.05subscript𝑟𝐶0.05r_{{}_{C}}\approx 0.05 are not excluded in this case (ii). Thus, we see that even in this conservative case of considering only 5 (relatively precisely measured) observables, the data strongly indicate a sizable enhancement of the EW penguin term rEWsubscript𝑟𝐸𝑊r_{{}_{EW}} or the color-suppressed tree term rCsubscript𝑟𝐶r_{{}_{C}}, or both of them.

The dashed line shows the result for the case of adding one more constraint from SKsπ0subscript𝑆subscript𝐾𝑠superscript𝜋0S_{K_{s}\pi^{0}} to the case (ii). It is interesting to note that the values of rCsubscript𝑟𝐶r_{{}_{C}} smaller than 0.08 are completely excluded in this case (iii), independent of values of rEWsubscript𝑟𝐸𝑊r_{{}_{EW}}.

Finally we consider all the available data for BKπ𝐵𝐾𝜋B\to K\pi modes shown in Table I. In this case, the number of parameters are the same as that of the relevant equations so that one can determine the “allowed” values of the parameters by solving the equations numerically. In order to find the allowed region for the parameters, when combining all the data, we carefully regulate the errors in the data to be within 1σ𝜎\sigma in total. The result is represented as the dot-dashed line [case (iv)]. The allowed values for rEWsubscript𝑟𝐸𝑊r_{{}_{EW}} and rCsubscript𝑟𝐶r_{{}_{C}} are limited to a rather small region at 1σ𝜎\sigma level: roughly, 0.24rEW0.410.24subscript𝑟𝐸𝑊0.410.24\leq r_{{}_{EW}}\leq 0.41 and 0.16rC0.360.16subscript𝑟𝐶0.360.16\leq r_{{}_{C}}\leq 0.36. Notice that simultaneous enhancements of rCsubscript𝑟𝐶r_{{}_{C}} and rEWsubscript𝑟𝐸𝑊r_{{}_{EW}} are indicated in this case. In order to confirm this result in a statistically more reliable way, we shall use the χ2superscript𝜒2\chi^{2} minimization technique in the next section.
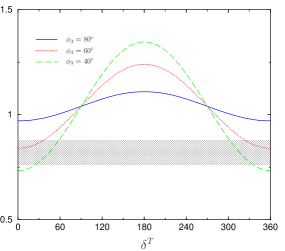
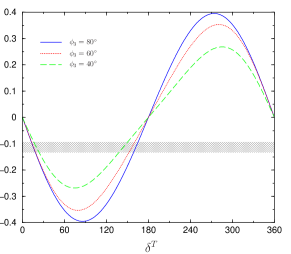
Refer to caption
Refer to caption
Figure 2: R1subscript𝑅1R_{1} and ACP+superscriptsubscript𝐴𝐶𝑃absentA_{CP}^{+-} as a function of δTsuperscript𝛿𝑇\delta^{T} for three different values of ϕ3=40,60,80subscriptitalic-ϕ3superscript40superscript60superscript80\phi_{3}=40^{\circ},60^{\circ},80^{\circ}, respectively. The shaded regions denote the experimental limits.

In Fig. 2, we present R1subscript𝑅1R_{1} and ACP+superscriptsubscript𝐴𝐶𝑃absentA_{CP}^{+-} as a function of δTsuperscript𝛿𝑇\delta^{T}. We remind that both R1subscript𝑅1R_{1} and ACP+superscriptsubscript𝐴𝐶𝑃absentA_{CP}^{+-} depend only on rTsubscript𝑟𝑇r_{{}_{T}}, δTsuperscript𝛿𝑇\delta^{T} and ϕ3subscriptitalic-ϕ3\phi_{3}. The left one of the figure shows R1subscript𝑅1R_{1} as a function of δTsuperscript𝛿𝑇\delta^{T} for ϕ3=40,60,80subscriptitalic-ϕ3superscript40superscript60superscript80\phi_{3}=40^{\circ},60^{\circ},80^{\circ}, respectively, where rTsubscript𝑟𝑇r_{{}_{T}} is fixed as 0.20.20.2. The allowed regions are δT40superscript𝛿𝑇superscript40\delta^{T}\leq 40^{\circ} or δT320superscript𝛿𝑇superscript320\delta^{T}\geq 320^{\circ}. The possibility of the vanishing δTsuperscript𝛿𝑇\delta^{T} is not excluded in this case. In the right one of the figure, ACP+superscriptsubscript𝐴𝐶𝑃absentA_{CP}^{+-} versus δTsuperscript𝛿𝑇\delta^{T} is presented for rT=0.2subscript𝑟𝑇0.2r_{{}_{T}}=0.2 and ϕ3=40,60,80subscriptitalic-ϕ3superscript40superscript60superscript80\phi_{3}=40^{\circ},60^{\circ},80^{\circ}, respectively. Combining the results from the left and right ones, we find that the possibility of a large δTsuperscript𝛿𝑇\delta^{T} is ruled out and the favored value of δTsuperscript𝛿𝑇\delta^{T} is non-zero and in between 20superscript2020^{\circ} and 30superscript3030^{\circ} for rT=0.2subscript𝑟𝑇0.2r_{{}_{T}}=0.2 and 40ϕ380superscript40subscriptitalic-ϕ3superscript8040^{\circ}\leq\phi_{3}\leq 80^{\circ} Mishima:2004um ; Yoshikawa:2003hb .

IV The χ2superscript𝜒2\chi^{2} analysis using BKπ𝐵𝐾𝜋B\to K\pi decays

In the numerical analysis, we use 8 observables, as shown in Table I (except 𝒜CP0+superscriptsubscript𝒜𝐶𝑃limit-from0{\cal A}_{CP}^{0+} which becomes irrelevant if rAsubscript𝑟𝐴r_{{}_{A}} is neglected).

Case (a): In this case, we have eight observables as above and seven parameters (|P~|,rT,rEW,rC,δT,δEW,δC)~𝑃subscript𝑟𝑇subscript𝑟𝐸𝑊subscript𝑟𝐶superscript𝛿𝑇superscript𝛿𝐸𝑊superscript𝛿𝐶(|\tilde{P}|,~{}r_{{}_{T}},~{}r_{{}_{EW}},~{}r_{{}_{C}},~{}\delta^{T},~{}\delta^{EW},~{}\delta^{C}) so that the degrees of freedom (d.o.f.) for the fit is 1. The parameter values for the best fit are presented in Table 2 for three different values of ϕ3subscriptitalic-ϕ3\phi_{3} chosen from the unitarity triangle fit: ϕ3=54,60subscriptitalic-ϕ3superscript54superscript60\phi_{3}=54^{\circ},~{}60^{\circ}, or 67superscript6767^{\circ}. The minimum values of χ2superscript𝜒2\chi^{2} (χmin2)subscriptsuperscript𝜒2𝑚𝑖𝑛(\chi^{2}_{min}) in each case are also shown in the table.

Table 2: The theoretical parameter values for the best fit in Case (a).
 ϕ3subscriptitalic-ϕ3\phi_{3}   |P|𝑃|P|  (in 106superscript10610^{-6} GeV)    rTsubscript𝑟𝑇r_{{}_{T}}    rEWsubscript𝑟𝐸𝑊r_{{}_{EW}}   rCsubscript𝑟𝐶r_{{}_{C}}    δTsuperscript𝛿𝑇\delta^{T}    δEWsuperscript𝛿𝐸𝑊\delta^{EW}    δCsuperscript𝛿𝐶\delta^{C}    χmin2/d.o.f.formulae-sequencesubscriptsuperscript𝜒2min𝑑𝑜𝑓\chi^{2}_{\rm min}/d.o.f.
54superscript54{\it 54^{\circ}} 1.231.231.23 0.200.200.20 0.350.350.35 0.250.250.25 17.9superscript17.917.9^{\circ} 254.9superscript254.9254.9^{\circ} 195.1superscript195.1195.1^{\circ} 0.010.010.01
60superscript60{\it 60^{\circ}} 1.231.231.23 0.250.250.25 0.370.370.37 0.250.250.25 13.0superscript13.013.0^{\circ} 260.4superscript260.4260.4^{\circ} 197.8superscript197.8197.8^{\circ} 0.0050.0050.005
67superscript67{\it 67^{\circ}} 1.221.221.22 0.340.340.34 0.400.400.40 0.270.270.27 8.6superscript8.68.6^{\circ} 256.6superscript256.6256.6^{\circ} 202.2superscript202.2202.2^{\circ} 0.450.450.45

For instance, in the case of ϕ3=60subscriptitalic-ϕ3superscript60\phi_{3}=60^{\circ}, we find the best fit with χmin2/d.o.f.=0.005\chi^{2}_{min}/d.o.f.=0.005. The corresponding parameters are

|P~|=1.23×10⁶GeV,rT=0.25,rEW=0.37,rC=0.25,formulae-sequence~𝑃1.23superscript106GeVformulae-sequencesubscript𝑟𝑇0.25formulae-sequencesubscript𝑟𝐸𝑊0.37subscript𝑟𝐶0.25\displaystyle|\tilde{P}|=1.23\times 10^{-6}~{}{\rm GeV},~{}~{}r_{{}_{T}}=0.25,~{}~{}r_{{}_{EW}}=0.37,~{}~{}r_{{}_{C}}=0.25, (36)
δT=13.0,δEW=260.4,δC=197.8.formulae-sequencesuperscript𝛿𝑇superscript13.0formulae-sequencesuperscript𝛿𝐸𝑊superscript260.4superscript𝛿𝐶superscript197.8\displaystyle\delta^{T}=13.0^{\circ},~{}~{}\delta^{EW}=260.4^{\circ},~{}~{}\delta^{C}=197.8^{\circ}. (37)

Using these parameter values, the observables are predicted as

¯0+=24.08×10⁶,¯+0=12.10×10⁶,formulae-sequencesuperscript¯limit-from024.08superscript106superscript¯012.10superscript106\displaystyle\bar{\cal B}^{0+}=24.08\times 10^{-6},~{}~{}~{}~{}\bar{\cal B}^{+0}=12.10\times 10^{-6}, (38)
¯+=18.21×10⁶,¯00=11.51×10⁶,formulae-sequencesuperscript¯absent18.21superscript106superscript¯0011.51superscript106\displaystyle\bar{\cal B}^{+-}=18.21\times 10^{-6},~{}~{}~{}~{}\bar{\cal B}^{00}=11.51\times 10^{-6}, (39)
𝒜CP+0=+0.04,𝒜CP+=0.119,𝒜CP00=0.007,SKsπ0=+0.33,formulae-sequencesuperscriptsubscript𝒜𝐶𝑃00.04formulae-sequencesuperscriptsubscript𝒜𝐶𝑃absent0.119formulae-sequencesuperscriptsubscript𝒜𝐶𝑃000.007subscript𝑆subscript𝐾𝑠superscript𝜋00.33\displaystyle{\cal A}_{CP}^{+0}=+0.04,~{}~{}{\cal A}_{CP}^{+-}=-0.119,~{}~{}{\cal A}_{CP}^{00}=-0.007,~{}~{}S_{K_{s}\pi^{0}}=+0.33, (40)

which are in good agreement with the central values of all the data.

Refer to caption

Figure 3: Case (a): the allowed values of rEWsubscript𝑟𝐸𝑊r_{{}_{EW}} and rCsubscript𝑟𝐶r_{{}_{C}} by the current data for BKπ𝐵𝐾𝜋B\to K\pi. The “x” marks denote the best fit values together with the corresponding values of rTsubscript𝑟𝑇r_{{}_{T}} for ϕ3=54,60,67subscriptitalic-ϕ3superscript54superscript60superscript67\phi_{3}=54^{\circ},~{}60^{\circ},~{}67^{\circ}, respectively. The regions surrounded by the solid, the dotted, and the dashed lines represent the allowed values of rEWsubscript𝑟𝐸𝑊r_{{}_{EW}} and rCsubscript𝑟𝐶r_{{}_{C}} at 1σ𝜎\sigma level for ϕ3=54,60,67subscriptitalic-ϕ3superscript54superscript60superscript67\phi_{3}=54^{\circ},~{}60^{\circ},~{}67^{\circ}, respectively.

We see that in this case the best fit value of the color-suppressed tree contribution rCsubscript𝑟𝐶r_{{}_{C}} is comparable to that of the color-allowed tree contribution rTsubscript𝑟𝑇r_{{}_{T}}, and the best fit value of the EW penguin contribution rEWsubscript𝑟𝐸𝑊r_{{}_{EW}} is also about 2.6 times larger than the conventionally estimated one. Table 2 shows that as ϕ3subscriptitalic-ϕ3\phi_{3} increase from 54superscript5454^{\circ} to 67superscript6767^{\circ}, the best fit values of rTsubscript𝑟𝑇r_{{}_{T}}, rEWsubscript𝑟𝐸𝑊r_{{}_{EW}} and rCsubscript𝑟𝐶r_{{}_{C}} also increases from 0.20, 0.35 and 0.25 to 0.34, 0.40 and 0.27, respectively. The best fit indicates that in comparison to the conventional estimates within the SM, the color-suppressed tree contribution should be enhanced by more than an order of magnitude, and the EW penguin contribution needs to be enhanced up to a factor of 3.
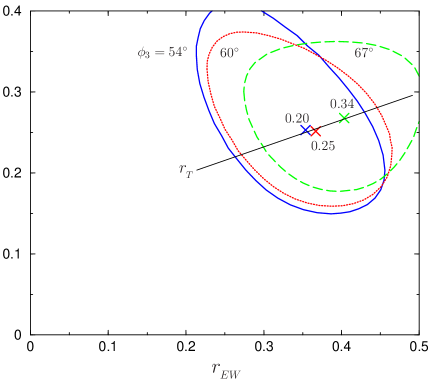
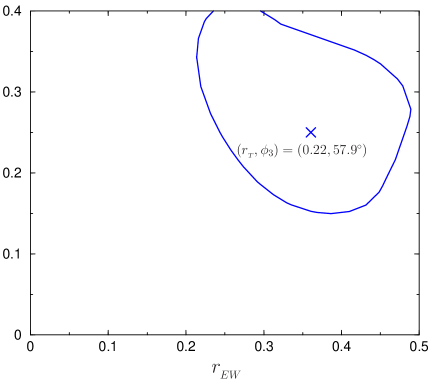
In Fig. 3, the allowed values of rEWsubscript𝑟𝐸𝑊r_{{}_{EW}} and rCsubscript𝑟𝐶r_{{}_{C}} are presented. The “x” marks denote the best fit values together with the corresponding values of rT=0.20,0.25,0.34subscript𝑟𝑇0.200.250.34r_{{}_{T}}=0.20,~{}0.25,~{}0.34 for ϕ3=54,60,67subscriptitalic-ϕ3superscript54superscript60superscript67\phi_{3}=54^{\circ},~{}60^{\circ},~{}67^{\circ}, respectively. The regions surrounded by the solid, the dotted, and the dashed lines represent the allowed values of rEWsubscript𝑟𝐸𝑊r_{{}_{EW}} and rCsubscript𝑟𝐶r_{{}_{C}} at 1σ𝜎\sigma level for ϕ3=54,60,67subscriptitalic-ϕ3superscript54superscript60superscript67\phi_{3}=54^{\circ},~{}60^{\circ},~{}67^{\circ}, respectively. It is obvious that the smallest allowed value of rCsubscript𝑟𝐶r_{{}_{C}} at 1σ𝜎\sigma level is at least 7 times larger than the conventional value (0.02absent0.02\approx 0.02), and the allowed value of rEWsubscript𝑟𝐸𝑊r_{{}_{EW}} is also larger than its conventional SM estimate (0.14absent0.14\approx 0.14): rEW>0.21subscript𝑟𝐸𝑊0.21r_{{}_{EW}}>0.21 for 54ϕ367superscript54subscriptitalic-ϕ3superscript6754^{\circ}\leq\phi_{3}\leq~{}67^{\circ}. Therefore, the current experimental results for BKπ𝐵𝐾𝜋B\to K\pi decays strongly imply (large) enhancements of both the EW penguin and the color-suppressed tree contributions.

Refer to caption

Figure 4: Case (b): the allowed values of rEWsubscript𝑟𝐸𝑊r_{{}_{EW}} and rCsubscript𝑟𝐶r_{{}_{C}} by the current data for BKπ𝐵𝐾𝜋B\to K\pi. Here all the eight parameters, including ϕ3subscriptitalic-ϕ3\phi_{3}, are varied. The “x” mark denotes the best fit value where rT=0.31subscript𝑟𝑇0.31r_{{}_{T}}=0.31 and ϕ3=63subscriptitalic-ϕ3superscript63\phi_{3}=63^{\circ}.

Case (b): Now we use all the eight parameters including ϕ3subscriptitalic-ϕ3\phi_{3} together with the same eight observables as before. In this case, the ϕ3subscriptitalic-ϕ3\phi_{3} varies from 54 to 67, which are chosen from the unitarity triangle fit. The result at 1σ𝜎\sigma level is shown in Fig. 4. We note that this result confirms that of the case (iv) (the dot-dashed line) shown in Fig. 1. The best fit values are

|P~|=1.23×10⁶GeV,rT=0.22,rEW=0.36,rC=0.25,formulae-sequence~𝑃1.23superscript106GeVformulae-sequencesubscript𝑟𝑇0.22formulae-sequencesubscript𝑟𝐸𝑊0.36subscript𝑟𝐶0.25\displaystyle|\tilde{P}|=1.23\times 10^{-6}~{}{\rm GeV},~{}~{}r_{{}_{T}}=0.22,~{}~{}r_{{}_{EW}}=0.36,~{}~{}r_{{}_{C}}=0.25, (41)
δT=14.8,δEW=258.5,δC=196.7,ϕ3=57.9.formulae-sequencesuperscript𝛿𝑇superscript14.8formulae-sequencesuperscript𝛿𝐸𝑊superscript258.5formulae-sequencesuperscript𝛿𝐶superscript196.7subscriptitalic-ϕ3superscript57.9\displaystyle\delta^{T}=14.8^{\circ},~{}~{}\delta^{EW}=258.5^{\circ},~{}~{}\delta^{C}=196.7^{\circ},~{}~{}\phi_{3}=57.9^{\circ}. (42)

The conclusion claimed in the case (a) holds in this case as well. That is, the present experimental results for BKπ𝐵𝐾𝜋B\to K\pi decays strongly indicate simultaneous (large) enhancements of the EW penguin and the color-suppressed tree contributions.

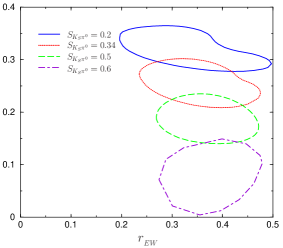
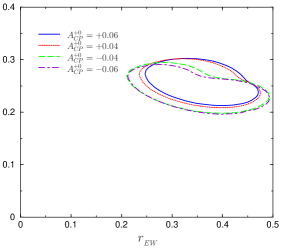
Finally we would like to make a comment on sensitivity between the parameter rCsubscript𝑟𝐶r_{{}_{C}} and the observable SKsπ0subscript𝑆subscript𝐾𝑠superscript𝜋0S_{K_{s}\pi^{0}}. As implied in Eq. (31), the theoretical prediction of SKsπ0subscript𝑆subscript𝐾𝑠superscript𝜋0S_{K_{s}\pi^{0}} can be sensitive to the parameter rCsubscript𝑟𝐶r_{{}_{C}}. For illustration, in the left one of Fig. 5, we show the allowed values of rEWsubscript𝑟𝐸𝑊r_{{}_{EW}} and rCsubscript𝑟𝐶r_{{}_{C}} at 1σ𝜎\sigma level by the current data for BKπ𝐵𝐾𝜋B\to K\pi, when the value of SKsπ0subscript𝑆subscript𝐾𝑠superscript𝜋0S_{K_{s}\pi^{0}} changes, keeping the values of the other observables fixed as in Table 1. We first vary SKsπ0subscript𝑆subscript𝐾𝑠superscript𝜋0S_{K_{s}\pi^{0}} around the present experimental value: specifically, SKsπ0subscript𝑆subscript𝐾𝑠superscript𝜋0S_{K_{s}\pi^{0}} is assumed to be (0.20±0.04)plus-or-minus0.200.04(0.20\pm 0.04), (0.34±0.068)plus-or-minus0.340.068(0.34\pm 0.068), (0.50±0.10)plus-or-minus0.500.10(0.50\pm 0.10), (0.60±0.12)plus-or-minus0.600.12(0.60\pm 0.12), respectively. Here just for the illustrative purpose, we set 20% errors in each case. (Also, to be consistent, we set 20% errors to all the data whose current errors are larger than 20%, such as ACPijsuperscriptsubscript𝐴𝐶𝑃𝑖𝑗A_{CP}^{ij}.) It is clear that as SKsπ0subscript𝑆subscript𝐾𝑠superscript𝜋0S_{K_{s}\pi^{0}} varies, the allowed region for rCsubscript𝑟𝐶r_{{}_{C}} varies sensitively: as SKsπ0subscript𝑆subscript𝐾𝑠superscript𝜋0S_{K_{s}\pi^{0}} increases, the allowed value of rCsubscript𝑟𝐶r_{{}_{C}} decreases. In contrast, rEWsubscript𝑟𝐸𝑊r_{{}_{EW}} is not sensitive to the change of SKsπ0subscript𝑆subscript𝐾𝑠superscript𝜋0S_{K_{s}\pi^{0}}. Just for comparison, in the right one of Fig. 5, we also present the case that the value of ACP+0superscriptsubscript𝐴𝐶𝑃0A_{CP}^{+0} changes, keeping the values of the other ones fixed as in Table 1. Again for the illustrative purpose, ACP+0superscriptsubscript𝐴𝐶𝑃0A_{CP}^{+0} is assumed to be (+0.040(0.040)±0.008)plus-or-minus0.0400.0400.008(+0.040(-0.040)\pm 0.008), (0.060(0.060)±0.012)plus-or-minus0.0600.0600.012(0.060(-0.060)\pm 0.012), respectively. (To be consistent, we also set 20% errors to all the data whose current errors are larger than 20%, such as SKsπ0subscript𝑆subscript𝐾𝑠superscript𝜋0S_{K_{s}\pi^{0}} and ACPijsuperscriptsubscript𝐴𝐶𝑃𝑖𝑗A_{CP}^{ij}.) In contrast to the case of the left figure, both rEWsubscript𝑟𝐸𝑊r_{{}_{EW}} and rCsubscript𝑟𝐶r_{{}_{C}} are insensitive to the change of ACP+0superscriptsubscript𝐴𝐶𝑃0A_{CP}^{+0}.

Refer to caption
Refer to caption
Figure 5: Illustration of the allowed values of rEWsubscript𝑟𝐸𝑊r_{{}_{EW}} and rCsubscript𝑟𝐶r_{{}_{C}} at 1σ𝜎\sigma level by the current data for BKπ𝐵𝐾𝜋B\to K\pi, for a given SKsπ0subscript𝑆subscript𝐾𝑠superscript𝜋0S_{K_{s}\pi^{0}} (left figure) or ACP+0superscriptsubscript𝐴𝐶𝑃0A_{CP}^{+0} (right figure). In the left figure, SKsπ0subscript𝑆subscript𝐾𝑠superscript𝜋0S_{K_{s}\pi^{0}} is assumed to be 0.20,0.34,0.50,0.600.200.340.500.600.20,~{}0.34,~{}0.50,~{}0.60, respectively (plus 20% error in each case). In the right one, ACP+0superscriptsubscript𝐴𝐶𝑃0A_{CP}^{+0} is assumed to be ±0.040,±0.060plus-or-minus0.040plus-or-minus0.060\pm 0.040,~{}\pm 0.060, respectively (plus 20% error in each case).

V Conclusion

We have studied the decay processes BKπ𝐵𝐾𝜋B\to K\pi in a phenomenological way. Using the currently available experimental data for all the BKπ𝐵𝐾𝜋B\to K\pi modes, we have determined the allowed values of the relevant theoretical parameters, such as |P~|,rT,rEW,rC,δT,δEW,δC,ϕ3~𝑃subscript𝑟𝑇subscript𝑟𝐸𝑊subscript𝑟𝐶superscript𝛿𝑇superscript𝛿𝐸𝑊superscript𝛿𝐶subscriptitalic-ϕ3|\tilde{P}|,~{}r_{{}_{T}},~{}r_{{}_{EW}},~{}r_{{}_{C}},~{}\delta^{T},~{}\delta^{EW},~{}\delta^{C},~{}\phi_{3}. In order to find the most likely values of the parameters in a statically reliable way, we used the χ2superscript𝜒2\chi^{2} analysis.

Our result shows that the current data for BKπ𝐵𝐾𝜋B\to K\pi decays strongly indicate (large) enhancements of both the EW penguin and the color-suppressed tree contributions: e.g.formulae-sequence𝑒𝑔e.g., roughly, 0.21rEW0.490.21subscript𝑟𝐸𝑊0.490.21\leq r_{{}_{EW}}\leq 0.49 and 0.15rC0.430.15subscript𝑟𝐶0.430.15\leq r_{{}_{C}}\leq 0.43 at 1σ𝜎\sigma level. The best fit values are rEW=0.36subscript𝑟𝐸𝑊0.36r_{{}_{EW}}=0.36 and rC=0.25subscript𝑟𝐶0.25r_{{}_{C}}=0.25. The favored values of rEWsubscript𝑟𝐸𝑊r_{{}_{EW}} and rCsubscript𝑟𝐶r_{{}_{C}} are larger than the SM estimates (rEW0.14subscript𝑟𝐸𝑊0.14r_{{}_{EW}}\approx 0.14 and rC0.02subscript𝑟𝐶0.02r_{{}_{C}}\approx 0.02) by about a factor of 2.5 and 12, respectively.

It should be noted that in the case of using only the BRs (i.e.formulae-sequence𝑖𝑒i.e., not including CP asymmetries), the conventional values of rEWsubscript𝑟𝐸𝑊r_{{}_{EW}} and rCsubscript𝑟𝐶r_{{}_{C}} may not be completely excluded, if the large value of rTsubscript𝑟𝑇r_{{}_{T}} (e.g.formulae-sequence𝑒𝑔e.g., rT0.4subscript𝑟𝑇0.4r_{{}_{T}}\approx 0.4) is assumed.

ACKNOWLEDGEMENTS

The work of C.S.K. was supported by in part by the Korea Research Foundation Grant funded by the Korean Government (MOEHRD) No. R02-2003-000-10050-0. The work of S.O. was supported by Korea Research Foundation Grant (KRF-2004-050-C00005). The work of C.Y. was supported in part by Brain Korea 21 Program and in part by Grant No. F01-2004-000-10292-0 of KOSEF-NSFC International Collaborative Research Grant and in part by the Korea Research Foundation Grant funded by the Korean Government (MOEHRD) No. R02-2003-000-10050-0.

References

  • (1) Heavy Flavor Averaging Group, http://www.slac.stanford.edu/xorg/hfag/ (2005).
  • (2) A. Bornheim et al. [CLEO Collaboration], Phys. Rev. D 68, 052002 (2003) [arXiv:hep-ex/0302026].
  • (3) Y. Chao et al. [Belle Collaboration], Phys. Rev. D 69, 111102 (2004) [arXiv:hep-ex/0311061].
  • (4) B. Aubert et al. [BABAR Collaboration], Phys. Rev. Lett.  89, 281802 (2002) [arXiv:hep-ex/0207055].
  • (5) B. Aubert et al. [BABAR Collaboration], arXiv:hep-ex/0408062.
  • (6) B. Aubert et al. [BABAR Collaboration], arXiv:hep-ex/0408080.
  • (7) B. Aubert et al. [BABAR Collaboration], arXiv:hep-ex/0408081.
  • (8) K. Abe, XXII International Symposium on Lepton-Photon Interactions at High Energy, June 30-July 5, Uppsala, Sweden (2005).
  • (9) S. Chen et al. [CLEO Collaboration], Phys. Rev. Lett.  85, 525 (2000) [arXiv:hep-ex/0001009].
  • (10) B. Aubert et al. [BaBar Collaboration], Phys. Rev. Lett.  93, 131801 (2004) [arXiv:hep-ex/0407057].
  • (11) Y. Chao et al. [BELLE Collaboration], Phys. Rev. D 71, 031502 (2005) [arXiv:hep-ex/0407025].
  • (12) Y. Chao et al. [Belle Collaboration], Phys. Rev. Lett.  93, 191802 (2004) [arXiv:hep-ex/0408100].
  • (13) K. Abe et al. [BELLE Collaboration], arXiv:hep-ex/0409049.
  • (14) S. Mishima and T. Yoshikawa, Phys. Rev. D 70, 094024 (2004) [arXiv:hep-ph/0408090].
  • (15) Y. L. Wu and Y. F. Zhou, Phys. Rev. D 71, 021701 (2005) [arXiv:hep-ph/0409221]; arXiv:hep-ph/0503077.
  • (16) A. J. Buras, R. Fleischer, S. Recksiegel and F. Schwab, Acta Phys. Polon. B 36, 2015 (2005) [arXiv:hep-ph/0410407]; arXiv:hep-ph/0411373.
  • (17) Y. Y. Charng and H. n. Li, Phys. Rev. D 71, 014036 (2005) [arXiv:hep-ph/0410005].
  • (18) X. G. He and B. H. J. McKellar, arXiv:hep-ph/0410098.
  • (19) S. Baek, P. Hamel, D. London, A. Datta and D. A. Suprun, Phys. Rev. D 71, 057502 (2005) [arXiv:hep-ph/0412086].
  • (20) T. Carruthers and B. H. J. McKellar, arXiv:hep-ph/0412202.
  • (21) S. Nandi and A. Kundu, arXiv:hep-ph/0407061.
  • (22) T. Morozumi, Z. H. Xiong and T. Yoshikawa, arXiv:hep-ph/0408297.
  • (23) M. Gronau, O. F. Hernandez, D. London and J. L. Rosner, Phys. Rev. D 50, 4529 (1994) [arXiv:hep-ph/9404283]; M. Gronau, J. L. Rosner and D. London, Phys. Rev. Lett.  73, 21 (1994) [arXiv:hep-ph/9404282]; O. F. Hernandez, D. London, M. Gronau and J. L. Rosner, Phys. Lett. B 333, 500 (1994) [arXiv:hep-ph/9404281]; M. Gronau, O. F. Hernandez, D. London and J. L. Rosner, Phys. Rev. D 52, 6374 (1995) [arXiv:hep-ph/9504327]; C. S. Kim, D. London and T. Yoshikawa, Phys. Rev. D 57, 4010 (1998) [arXiv:hep-ph/9708356].
  • (24) T. Yoshikawa, Phys. Rev. D 68, 054023 (2003) [arXiv:hep-ph/0306147].
  • (25) Y. Y. Keum, H. N. Li and A. I. Sanda, Phys. Rev. D 63, 054008 (2001) [arXiv:hep-ph/0004173]; Phys. Lett. B 504, 6 (2001) [arXiv:hep-ph/0004004]; AIP Conf. Proc.  618, 229 (2002) [arXiv:hep-ph/0201103].
  • (26) M. Neubert and J. L. Rosner, Phys. Rev. Lett.  81, 5076 (1998) [arXiv:hep-ph/9809311].
  • (27) H. Y. Cheng, C. K. Chua and A. Soni, Phys. Rev. D 71, 014030 (2005) [arXiv:hep-ph/0409317].
  • (28) C. S. Kim, S. Oh and C. Yu, Phys. Lett. B 621, 259 (2005) [arXiv:hep-ph/0412418].
  • (29) Y. Y. Keum, T. Kurimoto, H. N. Li, C. D. Lu and A. I. Sanda, Phys. Rev. D 69, 094018 (2004) [arXiv:hep-ph/0305335].
  • (30) S. Eidelman et al. [Particle Data Group], Phys. Lett. B 592, 1 (2004).
  • (31) A. J. Buras, R. Fleischer, S. Recksiegel and F. Schwab, Phys. Rev. Lett.  92, 101804 (2004) [arXiv:hep-ph/0312259]; Nucl. Phys. B 697, 133 (2004) [arXiv:hep-ph/0402112].
  • (32) M. Bona et al. [UTfit Collaboration], JHEP 0507, 028 (2005) [arXiv:hep-ph/0501199].