Resolving Neutrino Mass Hierarchy and CP Degeneracy by
Two Identical Detectors with Different Baselines
Abstract
We explore the possibility of simultaneous determination of neutrino mass hierarchy and the CP violating phase by using two identical detectors placed at different baseline distances. We focus on a possible experimental setup using neutrino beam from J-PARC facility in Japan with beam power of 4MW and megaton (Mton)-class water Cherenkov detectors, one placed in Kamioka and the other at somewhere in Korea. We demonstrate, under reasonable assumptions of systematic uncertainties, that the two-detector complex with each fiducial volume of 0.27 Mton has potential of resolving neutrino mass hierarchy up to (0.055) at 2 (3) CL for any values of and at the same time has the sensitivity to CP violation by 4 + 4 years running of and appearance measurement. The significantly enhanced sensitivity is due to clean detection of modulation of neutrino energy spectrum, which is enabled by cancellation of systematic uncertainties between two identical detectors which receive the neutrino beam with the same energy spectrum in the absence of oscillations.
pacs:
14.60.Pq,14.60.Lm,13.15.+gI introduction
Despite the great progresses made in varying neutrino oscillation experiments SKatm ; solar ; KamLAND ; K2K ; CHOOZ which revealed the structure of the lepton flavor mixing matrix, the Maki-Nakagawa-Sakata (MNS) matrix MNS , there still remains several unanswered questions. One of the most intriguing one is the problem of neutrino mass hierarchy, a tantalizing dualism of the normal ordering and the inverted one where the former (latter) implies that a pair of neutrinos with a mass gap responsible for solar neutrino oscillations are lighter (heavier) than the third neutrino. Picking out one from the two alternatives of neutrino mass patterns may bring us one of the most significant hints for underlying physics of neutrino mass. Another challenging goal of the next-generation neutrino oscillation experiments is to uncover leptonic CP violation. It will not only shed light to deep structure behind the complete parallelism between quarks and leptons, but also may give us a hint for understanding baryon number asymmetry in the universe leptogenesis .
In this paper, we develop a new experimental strategy of resolving the above two unknowns at the same time. For the sake of concreteness, we confine ourselves into a general framework of the neutrino program supported by Japan Proton Accelerator Research Complex (J-PARC) located in Tokai village JPARC . In particular, we focus on its phase II project with upgraded beam of 4 MW and a megaton (Mton) water Cherenkov detector, Hyper-Kamiokande (HK). The fiducial mass of this detector, in its current design, is 0.54 Mton. We propose, instead of placing a 1 Mton detector in the Kamioka mine, to break it into two 0.5 Mton detectors111 A two-detector method for measuring CP violation is first described in MNplb97 . and place the one in Kamioka and the other one at somewhere in Korea.222 The present proposal may not require significant modification of the design of HK, because the current design of HK consists of two tanks (detectors) located in two separated caves due to the constraint on the size of the available site nakamura . Use of two identical detectors has a definite advantage that the systematic errors largely cancel between detectors, which allows clean measurement of modulation of neutrino energy spectrum due to oscillations.
Principle of determination of mass hierarchy is quite simple. It may be carried out by measuring interference between vacuum and matter effects in neutrino oscillations. However, it requires sufficiently long baseline of the order of 1000 km. Then, the natural possibility one can think of is to place a second detector along the beam direction from Tokai to Kamioka at somewhere in Eurasian Continent eurasian ; MNjhep01 ; NOVE_mina ; SEESAW_hagi . Despite many attempts in developing ideas for determining mass hierarchy along the line quoted above, no immediately feasible proposal has emerged so far. Probably, the closest one to the goal is the NOA project (with an upgraded proton driver) in the United States NOVA .
It is expected in phase II of the J-PARC neutrino program that the leptonic CP violating phase can be measured, if is not too small, by combining 2 and 6 year measurements of appearance channels and , respectively JPARC . Though powerful with enormous statistics enabled by intense neutrino beam and a huge detector, the measurement of the leptonic CP violating phase in the T2K experiment suffers from the obstruction due to the unknown mass hierarchy, the fact observed with varying degree of robustness and contexts sb-vs-nf ; reactorCP ; NOON04_yasuda ; SEESAW_hagi . In a nutshell, CP violating solution can be confused with CP conserving one due to the degeneracy associated with the sign of MNjhep01 , i.e., the undetermined mass hierarchy. Thus, the problems of measuring and determining mass hierarchy inherently couple with each other through the parameter degeneracy.
In this paper we explore a completely different strategy from these previous attempts. The tightly coupled feature of problems of determining mass hierarchy and naturally suggests a new radical approach of simultaneous determination of these two quantities. For this purpose, we focus on a two detector system, one detector in Kamioka and another one at somewhere in Korean peninsula.
The T2K experiment will use an off-axis beam, where the direction of the charged pions (with some contamination of kaons and muons) is 2 to 3 degrees different from the direction to the neutrino detector from the target. By selecting an angle between the directions of the charged particles and the neutrinos (off-axis angle) low energy neutrino beam whose maximum energy ranges from about 500 MeV (for 3 degree off-axis angle) to 800 MeV (for 2 degree off-axis angle) can be produced. Because of the curvature of the surface of the earth, the direction to Kamioka, which is 295 km away from the target, is 1.3 degrees below the horizon as seen from the neutrino production target. According to the design of the T2K beam-line, the 2-to-3-degree off-axis beam is realized by directing the charged pion beam by 1.0 degree north of HK and 3.0 to 4.1 degrees below the horizon. The Korean peninsula is about 1000 to 1250 km away from the J-PARC facility. Therefore, the direction to the Korean peninsula is 4.5 to 5.6 degrees below the horizon. With this beam-line configuration, we find that the off-axis beam with the off-axis angle larger than 1 degree is automatically available in South Korea SEESAW_hagi for the 2.5 degree off-axis beam in Kamioka. We, therefore, find that the 2.5 degree (or more generally any angle between 2 and 3 degrees) off-axis beam in Kamioka and Korea is simultaneously available with the present T2K beam-line configuration. Later we find that the identical beam spectrum at two different positions is very powerful in determining the mass hierarchy.
In Sec. II, we develop our strategy of how to resolve the mass hierarchy and CP degeneracies. In Sec. III, we present a pedagogical discussion of the parameter degeneracy to a minimal level for reader’s understanding, and then illustrate how it can be resolved by spectral informations. Those who are familiar to the phenomenon should skip this section. In Sec. IV, we present quantitative analysis of sensitivity of resolving the parameter degeneracy and determining neutrino mass hierarchy. In Sec. V, we give concluding remarks.
II Right and wrong ways of using the Korean Detector
II.1 A detector in Korea is not always powerful
We start by giving a cautionary remark. One must be aware that a detector in Korea which receives the same neutrino beam from J-PARC facility is not immediately a good idea for detecting the matter effect and thereby determining the neutrino mass hierarchy. To understand the point, we draw in Fig. 1 regions spanned by probabilities of neutrino and anti-neutrino appearance probabilities and in a bi-probability space MNjhep01 . For a given variation of from 0 to gives an ellipse and it forms a region when is varied. Left and right plots in Fig. 1 are, respectively, for a detector in Kamioka and a one in Korea. (See MNjhep01 for a detailed explanation of properties of the bi-probability plot.)
The two regions with dark-gray (red) and light-gray (blue) correspond to the normal () and inverted () mass hierarchies, respectively. Here, we define the mass squared difference of neutrinos as where is the eigenvalue of the th mass-eigenstate. As one can see, the fraction of overlap between the two regions in the Korean detector is as large as the one in Kamioka, indicating that there exists confusion of mass hierarchy in Korea as heavy as that in Kamioka. If one relies on the usual method of comparing to , the Korean detector is as bad as that in Kamioka. Of course, it implies that overall the Korean detector is worse because the number of events is an order of magnitude smaller for a given flux.
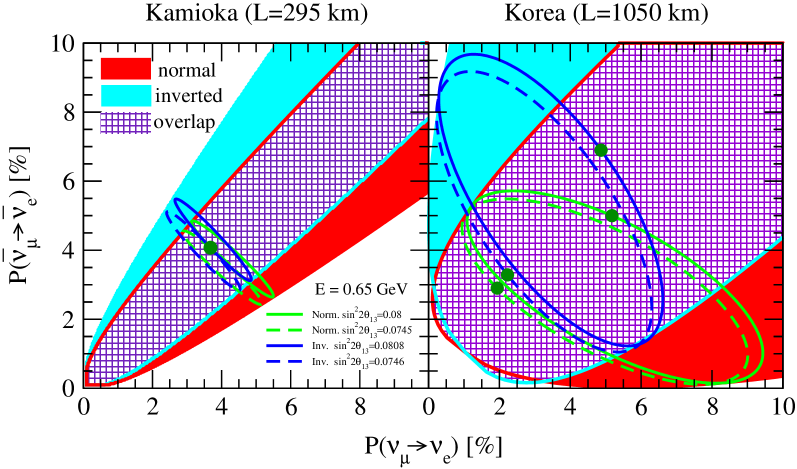
The behavior we just saw above can be understood qualitatively by looking into the appearance oscillation probability (and its charge-conjugation) valid to first-order in matter effect AKS ,
| (1) | |||||
In (1), wolfenstein where is the Fermi constant, denotes the electron number density at in the earth, denotes the reduced Jarlskog factor, is the neutrino energy, is the baseline distance, and the upper and lower sign refer to the neutrino and anti-neutrino channels, respectively. We have added a term due to solar mass scale oscillations, the last term in (1), whose value of order 0.01 at a Korean detector is non-negligible. One can easily observe that when we move from the first to the second oscillation maxima, the size of CP phase effects become larger by a factor of 3 while the matter effect stays the same. At off the oscillation maxima the first term in last line of (1) makes additional contributions which render the fraction of matter effect larger, but only up to a level given in Fig. 1 due to a modest size of the matter effect, . Therefore, a second detector at the second oscillation maximum, though attractive because of a factor of 3 larger effect of CP phase is not the best place to discriminate the mass hierarchy NOVE_mina .
In summary, it appears that there is no obvious merit of placing a detector in Korea to measure the matter effect. To really utilize the attractive feature of a factor of 3 larger CP effect we must go beyond the level of our above discussions, as we will pursue in the next subsections.
II.2 Energy dependence is far more dynamic if seen by the Korean detector
To uncover possible advantages of the Korean detector we have examined how the appearance probabilities depend upon the energy and baseline. We observed that after neutrinos pass through the second oscillation maximum the appearance probabilities sharply fall. The behavior, together with an enhanced matter effect, produces a dynamic behavior of the energy spectrum of oscillated neutrinos. The features of the oscillation probabilities suggest the baselines between the second oscillation maximum and the subsequent minimum, between about 900 and 1200 km, as appropriate ones. It is an accidental coincidence that the mountainous area with which neutrino beam from J-PARC facility first encounter is located at about 1000-1100 km away from Tokai village. Therefore, we take the baseline distance of 1050 km as a typical distance to the Korean detector throughout our analysis in this paper. Noting that , km corresponds to about 10% off the second oscillation maximum at peak energy. The choice matches with our earlier observation that it is better to stay somewhat away from the second oscillation maximum to enhance the matter effect so that the last term in Eq. (1) makes some contributions to the probabilities.
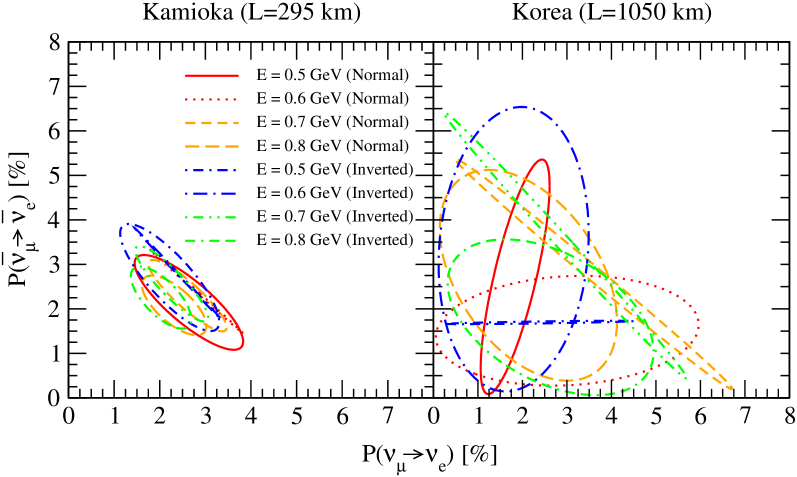
To demonstrate the dynamical behavior of the oscillated neutrino spectrum, we draw another bi-probability plot in Fig. 2 to represent how different are the energy dependence of the oscillation probabilities when they are seen by detectors in Kamioka and in Korea. We notice the striking difference between the left and right panels of Fig. 2; In contrast to the quiet behavior in Kamioka, the ellipses are larger in size and are extremely dynamic in movement in Korea, when the energy is varied from 0.5 to 0.8 GeV.
Let us summarize the notable differences between Kamioka and Korea, because they are all crucially important as the building blocks of our strategy.
-
•
The variation of the appearance probabilities due to is larger by a factor of 2-3 in Korea compared to that in Kamioka. It is notable that the ellipses with energies from 0.5 to 0.8 GeV span almost entire area of triangular region of appearance probabilities less than 0.07. It is partly due to about a factor 3 larger CP effect, and to the enhanced solar term which scales approximately as (see Eq. (1)).
-
•
The energy dependence of the ellipse is very dramatic in the Korean detector. When the energy is varied from 0.5 to 0.8 GeV, the slope of the major axis moves counterclockwise (clockwise) by more than in the case of normal (inverted) hierarchy, which is represented with the symbol exhibited in Fig. 2. (For electronic version, the ellipses of the normal and the inverted hierarchies are represented by warm and cold colored lines, respectively.) It implies that CP phase affects differently onto different part of the energy spectrum. Notice that positive slope of the major axis has never been observed in region around the first oscillation maximum. In contrast to such violent behavior the energy dependence of the ellipse is very quiet in Kamioka.
This strong energy dependence of the appearance oscillation probabilities in Korea, which are different for normal and inverted hierarchies and are helped by their enhanced size, is the key to the enormous sensitivity of the two-detector complex as we will fully explore in Sec. IV.
We want to mention here about the BNL proposal in which a wide-band beam from upgraded AGS will be detected by the far detector located at 2950 km to observe the effects of multiple (1-3) oscillation maxima BNL . The dramatic difference in the energy dependence of the neutrino oscillation probability between the first and the second oscillation maxima may have been contributed to the high sensitivity (despite such a long baseline) obtained in the proposal.
II.3 Determination of mass hierarchy through resolving degeneracy
Now we have reached to the point to establish our new strategy for the determination of the neutrino mass hierarchy. In a nutshell we do it by resolving the parameter degeneracy associated with the unknown sign of . While we postpone an organized discussion of the parameter degeneracy to Sec. III, it will be shown there that to resolve the -sign degeneracy, the spectrum shape analysis of the appearance events in two detectors in different baseline (or at different energy) is crucial. Then, by placing the two detectors in Kamioka and in Korea, we can fully utilize the remarkable difference in energy dependence of the oscillation probabilities to solve the parameter degeneracy.
There exists great merit of using two identical detectors together with the neutrino beam of identical spectrum shape (in the absence of oscillations) which makes demonstration of the CP violation and resolution of the mass hierarchy degeneracy much cleaner.333 We are not aware to whom the idea of error cancellation with use of identical detectors can be attributed. It was utilized, for example, in the Bugey experiment bugey , and there were many examples of constructing near detectors more or less identical with far detectors. We will also fully utilize this characteristics of Kamioka-Korea two identical detector complex in our analysis in Sec. IV.
III Parameter degeneracy and its resolution by spectral analysis
In this section, we briefly summarize the parameter degeneracy in neutrino oscillations Burguet-C ; MNjhep01 ; octant ; BMW1 ; KMN02 ; MNP2 to the extent that is necessary to understand the rest of this paper. We then illustrate how it can be resolved with use of the Kamioka-Korea two identical detectors, which greatly differ in energy dependences they observe. Those who are familiar to the parameter degeneracy should skip this section and directly go to Sec. IV, where full details of the quantitative analysis of resolving power of the degeneracy will be presented.
It should be obvious from Fig. 1 that a set of measurement of and at a particular baseline and an energy allows four solutions (crossing points of the ellipses) of and . The origin of the four-fold solutions may be understood as the intrinsic degeneracy of and Burguet-C (a single crossing point allows two ellipses), duplicated by the unknown sign of MNjhep01 which admits opposite -sign solutions. The mixed -sign degenerate solution occurs in the cross-hatched region in Fig. 1. A degenerate solution in Kamioka (left panel) splits into four separate points (right panel) in the Korean detector. The importance of the Korean detector is clearly understood.
In fact, the four-fold degeneracy is further multiplied by the octant ambiguity of for a given octant , leading to the total eight-fold degeneracy BMW1 . But we do not try to resolve the degeneracy in this paper by simply assuming that in most part of our analysis. We, however, examine the effect of non-maximal on resolution of neutrino mass hierarchy and CP degeneracy.444 It is well recognized that it is very difficult to resolve the degeneracy associated with if we rely only on accelerator measurement using beam. It in turn implies that our discussion in this paper may be stable against inclusion of deviation of from the maximal. Lifting the degeneracy may be done only when the accelerator measurement of is combined with either pure measurement of by reactor experiments MSYIS , or the complementary information from the silver channel, silver .
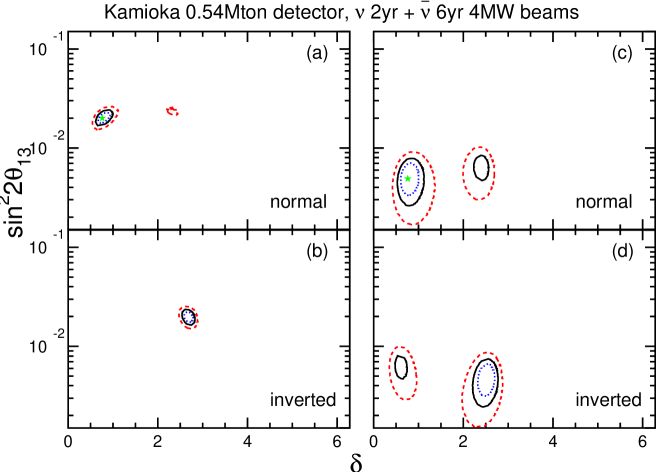
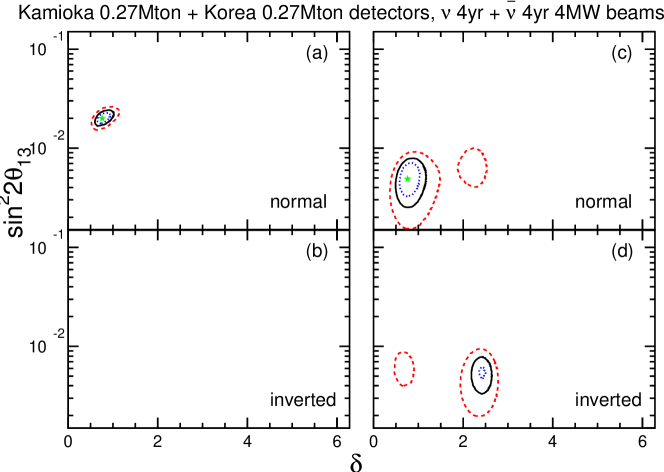
Now we present in Fig. 3 a four-fold degenerate solutions to show how it looks like in the plane spanned by and obtained as a result of our analysis whose details will be fully explained in Sec. IV. These solutions are obtained by assuming the operation of the J-PARC experiment for total 8 years running with and appearance channels. The upper figure: 2 years running of the neutrino mode and 6 years running of anti-neutrino mode with single detector of 0.54 Mton of the fiducial volume placed in Kamioka only. The lower figure: 4 years of running of both in neutrino and anti-neutrino modes with two detectors of 0.27 Mton of the fiducial volume placed one in Kamioka and the other in Korea. In each figures the left and the right panels are for cases with true values of given by and , respectively, with positive value of , as inputs.
Let us understand the features of the four solutions represented in Fig. 3. First, we focus on the right panel of Fig. 3. We observe two distinct pairs of solutions, the same -sign (intrinsic) degeneracy and the mixed -sign degeneracy.
-
•
the same -sign degeneracy
One can identify a pair of the solutions in each mass hierarchy, which obviously corresponds to the intrinsic degeneracy. It is known that the two solutions of are approximately symmetric with respect to reflection at , that is MNP2 ; nufact03_mina . Within the same mass hierarchy, the transformation produces flipping the sign of term in the appearance probability in Eq.(1). Therefore, the oscillation probabilities with these two degenerate solutions have different energy dependence, and hence they are discriminable by doing spectrum analysis. This is what happens, though incompletely, in the case of (right panels). For (left panels) the spectral information is powerful enough to resolve (almost) the intrinsic degeneracy even for a single detector in Kamioka, as seen in the left panels of the upper plots in Fig. 3. Use of the spectral informations to solve the parameter degeneracies has been discussed by many authors; See for example Burguet-C ; MNjhep01 ; sb-vs-nf ; spectral_resol .
-
•
the mixed -sign degeneracy
One can also identify another pair of solutions which are still allowed even at 68% CL in the opposite-sign panels. This is the degenerate solution due to the unknown sign of (or type of mass hierarchy). It arises because of the approximate symmetry under the simultaneous transformation MNjhep01 (which applies if the matter effect is small)
| (2) |
Since it is valid apart from tiny corrections of the order of these two solutions cannot be distinguished only by spectrum analysis at the single detector with small matter effect. It is the reason why we need a Korean detector to resolve the degeneracy due to mass hierarchy. The fact that the same transformation of appears in (2) explains the reason why two pairs of the mixed -sign solutions forms X (cross) shape in Fig. 3.
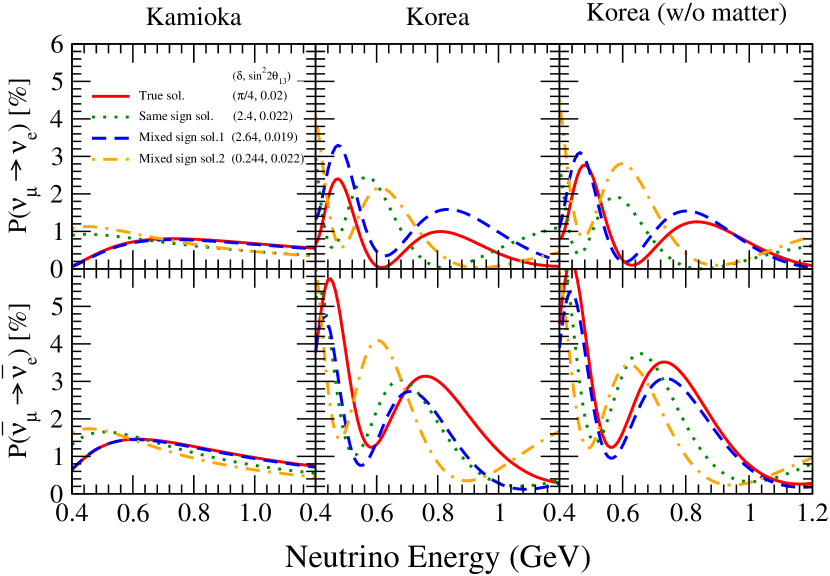
To have a feeling on how the spectrum information helps to resolve the degeneracies, we present in Fig. 4 the energy dependences of the oscillation probabilities to be observed at detectors in Kamioka (left panels) and in Korea (middle and right panels). In the right panels, we artificially switch off the matter effect to illuminate its role in resolving the degeneracy. We pick up a set of mixing parameters which correspond to a degenerate solution in Kamioka from the rate only analysis, which are shown in the figure, and indicate how these four solutions differ in energy dependences in Kamioka and Korea. The value taken for , , is large enough for the Kamioka-Korea two-detector complex to solve all the degeneracies, but is too small for a single detector in Kamioka to do the job, as indicated in the left panels of Fig. 3. It is obvious from Fig. 4 that the Korean detector sees very different energy spectrum of neutrinos. We also note the several characteristic features:
(1) In Kamioka (left panels), there are some differences between the same-sign degeneracy and the mixed-sign degeneracy. In the former case energy dependences of a pair of the solutions are somewhat different, leading to resolution of intrinsic degeneracy (as is seen in the left panels of Fig. 3) if the statistics is sufficient and the systematic error is controlled.
(2) In Korea (middle panels), the energy dependences of the four solutions are so distinct, and it is conceivable that the spectral information solves all the four-fold degeneracies, provided that the statistics is sufficiently large.
(3) Comparison between the middle and the right panels of Fig. 4 reveals that the matter effect plays a key role in resolving the -sign degeneracy (see solid red and blue dashed curves).
IV Sensitivities of resolving mass hierarchy and CP degeneracy
In the first subsection we give a full details of our analysis, including treatment of experimental errors, treatment of background, and the statistical procedure which is used to investigate the sensitivity of resolving the degeneracies. In the next subsections we give our results and perform stability checks of the results against the uncertainty of the matter density, the change in the systematic errors, and the possible deviation of from the maximal value.
IV.1 Assumptions and the definition of
In order to understand the advantage of the two detector system at 295 km (Kamioka) and 1050 km (Korea), we carry out a detailed analysis. We use various numbers and distributions available from references related to T2K JPARC ; JPARC-detail . Here we summarize the main assumptions and the methods used in the analysis.
We use the reconstructed neutrino energy for single-Cherenkov-ring electron-like events (about 80% of which are quasi-elastic charged-current (CC) interactions). The resolution in the reconstructed neutrino energy is 80 MeV for quasi-elastic events. We assume that and should be known precisely by the time when the experiments we consider in this report will be carried out. We take for these parameters and . Hence, we assume that the energy spectrum of the beam is the one expected by the 2.5 degree off-axis-beam in T2K. The shape of the energy spectrum for the anti-neutrino beam is assumed to be identical to that of the neutrino beam. The event rate for the anti-neutrino beam in the absence of neutrino oscillations is smaller by a factor of 3.4 due mostly to the lower neutrino interaction cross sections and partly to the slightly lower neutrino flux.
In the T2K experiment, 28 background events are expected for the reconstructed neutrino energies between 350 and 850 MeV for measurement with the neutrino beam. The energy dependence of the background rate and the rate itself are taken from JPARC-detail . The background rate is expected to be higher in the lower neutrino energies. The expected number of signal events is 122 for 0.1 with the same detector exposure and beam, assuming the normal mass hierarchy and . The background rate for the anti-neutrino beam is smaller than that for the neutrino beam by a factor of 1.6. Since the signal rate for the anti-neutrino beam is smaller by a factor of 3.4, the signal to noise ratio is worse for the anti-neutrino beam than that for the neutrino beam by a factor of about 2.
We assume that the experiment has a front detector that measures the background and the signal detection efficiency. We assume that both the overall background rate and the background shape (i.e., the energy dependence of the background) are understood within the uncertainty of 5%. More details on the assumed uncertainty in the background will be discussed later in this subsection when we define the for the analysis. We stress that in the present setting the detectors located in Kamioka and in Korea are not only identical but also they receive neutrino beams with the same energy distribution (due to the same off-axis angle) in the absence of oscillations. Therefore, the dependence on the assumed value of the experimental systematic errors must be weak, as we will verify by repeating the same analysis with different values of the uncertainties. As we will see later, the error cancellation between identical detectors gives us a very powerful constraint in our analysis.
We compute neutrino oscillation probabilities by numerically integrating neutrino evolution equation under the constant density approximation. The average density is assumed to be 2.3 and 2.8 g/cm3 for the matter along the beam line between the production target and Kamioka and between the target and Korea, respectively.555 The former number, as quoted in koike-sato , is the average value of the matter density profile which is obtained by M. Komazawa at Geographical Survey Institute in Japan by measuring surface gravity in many points around the path from KEK to Kamioka for the K2K experiment. The latter one is a commonly taken value for the matter density in earth crust, which is roughly equal to the average density of the distribution expected by “Preliminary Reference Earth Model” Dziewonski . We assume that the number of electron with respect to that of nucleons to be 0.5 to convert the matter density to the electron number density.
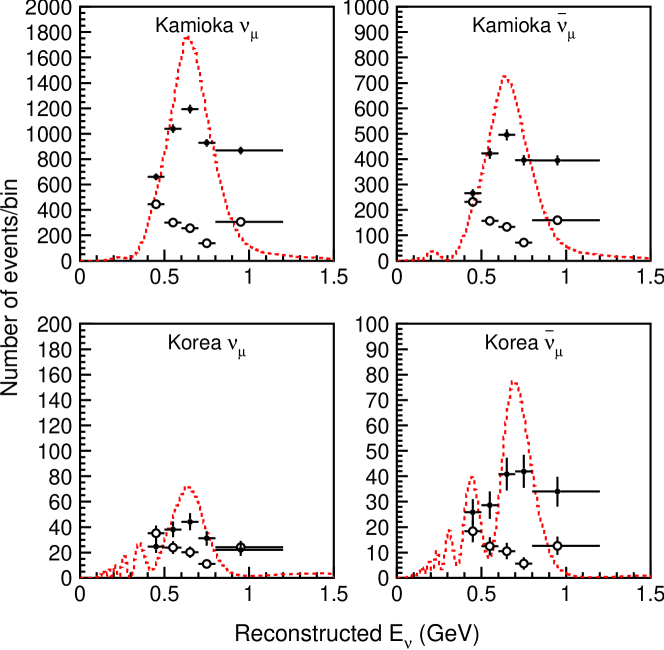
Fig. 5 shows an example of the energy spectrum of electron events to be observed in Kamioka and Korea for 4 years of neutrino beam and 4 years of anti-neutrino beam. Even with the 4 MW proton beam and with 0.27 Mton fiducial volume, the number of expected events in Korea is limited due to the large distance between the production point and the detector. However, it is seen that the overall signal rate and the energy dependence of the signal events are different between Kamioka and Korea. Therefore, we use these features to obtain information on neutrino oscillation parameters.
The statistical significance of the measurement considered in this paper was estimated by using the following definition of pull :
| (3) | |||
| (4) |
The first sums are for the number of observed single-ring electron events in the energy bin, is the number of events to be observed for the given oscillation parameter set, and is the expected number of events for the assumed , and the mass hierarchy in the analysis, where and correspond to the four combinations of the detectors in Kamioka and in Korea with the neutrino and anti-neutrino beams, respectively. Both and include background events. The energy ranges of the five energy bins are respectively 400-500 MeV, 500-600 MeV, 600-700 MeV, 700-800 MeV and 800-1200 MeV. denotes the statistical uncertainties in the expected data. The energy resolution of 80 MeV is taken into account with a Gaussian resolution function.
During the fit, the values of are recalculated to account for neutrino oscillations, and so are the systematic variations in the predicted rates due to the uncertainties in the estimated signal and background. The overall background normalization is assumed to be uncertain by 5%, and the effect is taken into account through in (3). In addition, it is also assumed that the background has an energy dependent uncertainty with the functional form of ). The energy-dependent part is also assumed to be uncertain by 5%. The uncertainty in the detection efficiency of the electron and positron signals is assumed to be 5%. In summary, for , and 3.
is the number of background events for the bin. We note that the number of the background events at detectors in Kamioka and in Korea are related simply by , where is the distance between the neutrino production point and the detector. is the number of events that are appeared by neutrino oscillations, and depend on , and the mass hierarchy. The uncertainties in and are represented by 3 parameters . The parameter represents the fractional change in the predicted event rate in the bin due to a variation of the parameter . The third sum in the definition collects the contributions from variables which parameterize the systematic uncertainties in the expected number of background events. During the fit, these 3 parameters are varied to minimize for each choice of the oscillation parameters.
IV.2 Sensitivity achievable by two-detector complex
We have shown in Fig. 3 typical results of the sensitivity analysis by taking as an example two values of , and 0.02 with normal mass hierarchy as inputs. In the upper and the lower figures the cases of a single 0.54 Mton detector in Kamioka and two detectors of 0.27 Mton each in Kamioka and in Korea, respectively, are examined. Now, we proceed to the sensitivity analysis of mass hierarchy and CP violation, which covers the entire region of the relevant parameter space.
We examine five different detector configurations, namely 5 cases of volume ratios of Kamioka to Korean detectors, keeping the total volume constant; (a) a single 0.54 Mton fiducial mass detector (the total mass of which should be about 1 Mton) in Kamioka, (b) 0.27 Mton detectors in Kamioka and in Korea, (c) a 0.16 Mton detector in Kamioka and a 0.38 Mton detector in Korea (volume ratio of 3:7), (d) 0.05 Mton detector in Kamioka and a 0.49 Mton detector in Korea (volume ratio of 1:9), and (e) a single 0.54 Mton detector in Korea. It is assumed that the experiment will continue for 8 years with 4 year of neutrino beam and 4 years of anti-neutrino beam. We use the same definition of as in (3) which embodies cancellation of errors between identical detectors even in the cases of two detectors with different volumes. For this simplification and the other reasons our analysis cannot be considered as a real optimization procedure for the volume ratio, but we feel that such study may give some insights on how the sensitivity varies with the detector mass ratio.
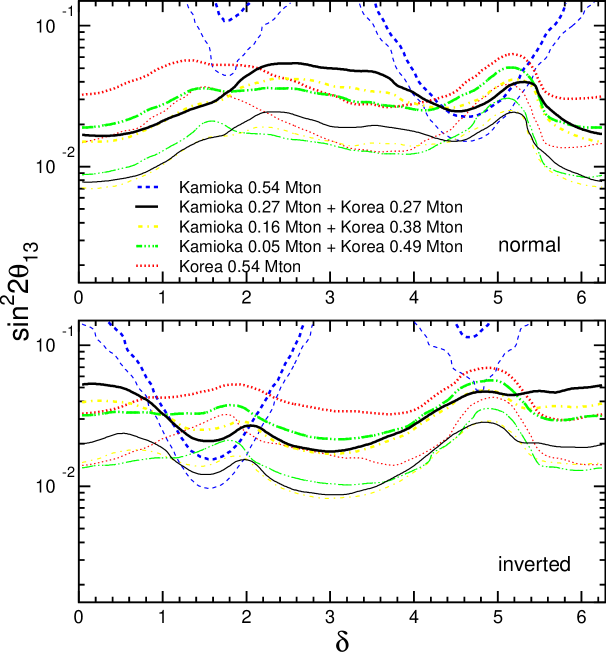
We show in Fig. 6 the contours of sensitivity to the mass hierarchy at 2 and 3 standard deviations on - plane for these 5 detector configurations. Here, the 2 and 3 standard deviations are defined to be 4 and 9, respectively. In the upper and the lower panels of Fig. 6, cases of the normal and the inverted mass hierarchies as a true mass hierarchies are presented. As expected, better sensitivities are obtained for detector configurations with detectors both in Kamioka and in Korea. While the best sensitivity is obtained for the case of (c) 3:7 volume ratio, we find that the sensitivity on the mass hierarchy does not depend strongly on the mass ratio of the two detectors. It is interesting to note that there are some sensitivities to mass hierarchy in a limited region of even in the setting with a single detector in Kamioka, as expected MNjhep01 ; nufact01_mina .
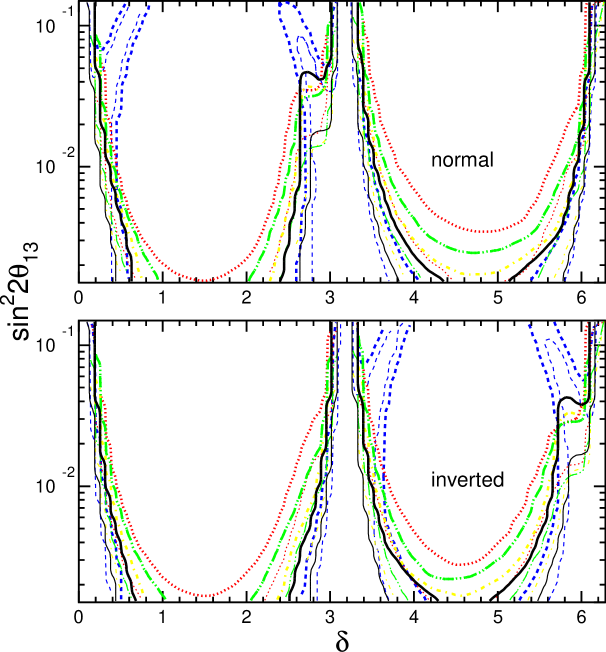
We show in Fig. 7 the sensitivity to leptonic CP violation by drawing the contours above which hypothesis of or can be rejected at 2 and 3 standard deviations. The 2 and 3 standard deviations are defined to be 4 and 9, respectively. As in the upper and the lower panels of Fig. 6, the cases of the normal and the inverted mass hierarchies as a true mass hierarchies are presented. Notice that while the type of true hierarchy is assumed in each case, the fit is performed without assuming the mass hierarchy. This statement applies to all the figures presented in this section. For small a single 0.54 Mton detector in Kamioka has the best sensitivity. Whereas for large , the two detector configuration gives the better sensitivity. It is due to the fact that in the two detector configurations, the mass hierarchy can be resolved for large , and therefore the value of is uniquely measured in the case of the two detector configurations. Among the two detector configurations, 0.27 Mton detectors at Kamioka and Korea gives the best sensitivity to the CP violation measurement.
We observe that the sensitivities to the mass hierarchy and CP violation do not change appreciably as the volume ratio is varied. A larger Korean detector seems to be favored to resolve the mass hierarchy. On the other hand, the sensitivity to CP violation disfavors the larger Korean detector, and in fact the best choice would be a 0.54 Mton detector in Kamioka for small values. Overall, two 0.27 Mt detectors one in Kamioka and the other in Korea seems to be close to the optimal choice. Anyhow the difference is so small that the real optimization process must involve other factors, such as the site availability and conditions, as well as additional physics capabilities, etc.
We note, in passing, that in the case of a single 0.54 Mton detector in Kamioka the spectral analysis is so powerful that allows larger sensitivity region of discovering CP violation than the one presented in JPARC (which relied on rate only analysis), as one can see in Fig. 7. It is highly nontrivial because we used relaxed values of systematic errors of 5%. Moreover, one can recognize the power of the spectrum information to solve the intrinsic degeneracy.
¿From the results obtained in this subsection, we select out the two identical detector configuration with 0.27 Mton each in Kamioka and in Korea for further studies of the sensitivities of resolving the mass hierarchy and the CP degeneracy, which is to be carried out in the following subsections.
IV.3 Optimization of neutrino and anti-neutrino running time
Since we found that the best detector configuration is the identical detectors in Kamioka and in Korea, we search for the best option for dividing assumed whole period of 8 years into the neutrino and anti-neutrino running. We examine the following three cases: (i) 8 years of the neutrino beam, (ii) 4 years of the neutrino and anti-neutrino beams (4+4), and (iii) 2 years of the neutrino beam and 6 years of the anti-neutrino beam (2+6). The last option is studied in Ref. JPARC where the sensitivity on the CP violation is discussed with a single detector in Kamioka. Figure 8 (upper panels) shows the sensitivity to the mass hierarchy in - space at 2 and 3 standard deviations for the three beam options. We find that the (4+4) option gives the best sensitivity while the (2+6) option gives similar but somewhat lower sensitivity.
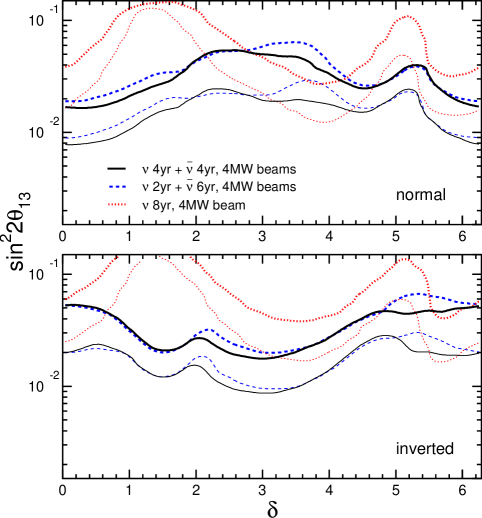
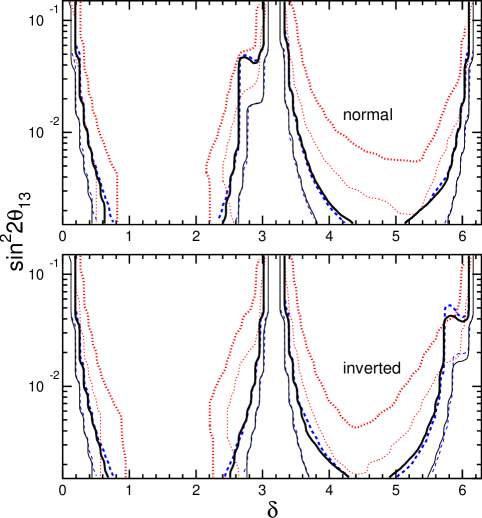
Figure 8 (lower panels) shows the sensitivity to the leptonic CP violation in - space at 2 and 3 standard deviations for the three beam options. The (4+4) and (2+6) options have almost the same sensitivity to the leptonic CP violation. We note that this study suggests that the leptonic CP violation can be demonstrated by running the experiment with the neutrino beam alone for some values of and though the sensitivity is substantially lower than the neutrino plus anti-neutrino beam options. This can be understood because the energy spectrum data from the detectors in Kamioka and Korea contain information on .
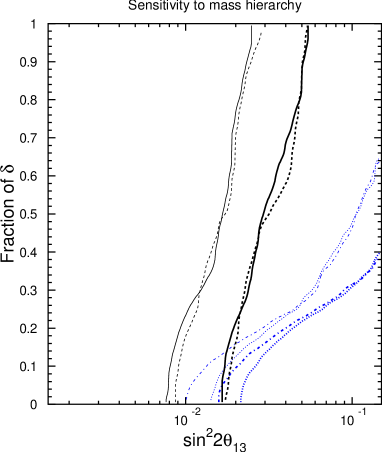
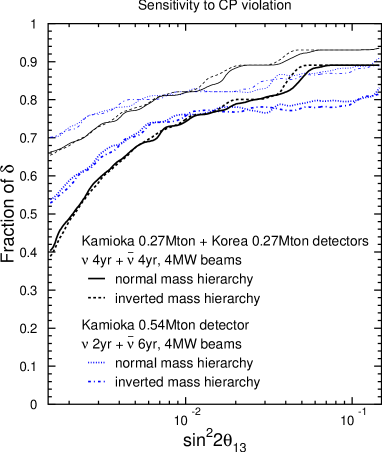
In Fig. 9 we present sensitivity regions for the mass hierarchy and CP violation at 2 and 3 standard deviations in space spanned by and the fraction of . The plot probably needs explanation: For a given value of , one can draw the region, as we did in Fig. 6, Fig. 7, and Fig. 8 in the previous subsections, where the mass hierarchy can be resolved (or CP violation can be signaled) at 2 or 3 standard deviations. The plot can be converted to the one in Fig. 9 by computing the fraction of the region of above the resolution contour at the given value of . In this way, the plot gives an alternative way of representing how sensitive is the experiment to the mass hierarchy or CP violation, and is used e.g., in the proposal of the NOA experiment NOVA .
In the proposed experiment, the mass hierarchy can be resolved if is larger than 0.055 (0.03) at the 3 (2) standard deviation level for any values. (Note, however, that the sensitivity is better in most of the region of as can be seen in Fig. 6.)
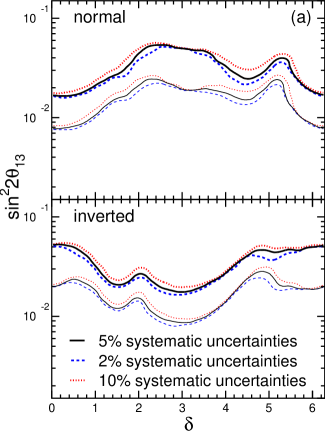
IV.4 Systematic uncertainties and the sensitivity
In order to study the robustness of the results, we carry out several tests. First, we test stability of the results by varying the systematic uncertainties in the background estimation and the signal detection efficiency. We examine three values, 2, 5, and 10%. Figure 10a shows the sensitivity region to the mass hierarchy in - space at 2 and 3 standard deviations for the three values of systematic uncertainties. It is remarkable that the dependence of the sensitivity to the systematic error is extremely weak. We point out that, because of the identical energy spectrum and the detectors in Kamioka and in Korea, their background rates must be related simply by . Because of this relation, the difference in the signal events in Kamioka and Korea cannot be explained by the uncertainty in the background, and therefore the measurement of the background rate by front detectors with a very high precision is not crucial in the identical two detector setup.
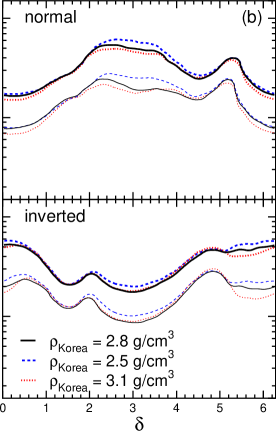
The matter density along the neutrino beam is not precisely known. Uncertainty in the matter density between J-PARC and Korea could be non-negligible, while the matter effect could be more important. We study the systematic effect due to the uncertainty in the matter density by changing only the mean matter density between the target and Korea. The true mean matter density is assumed to be either 2.5, 2.8 or 3.1 g/cm3, while the analysis is carried out assuming the density of 2.8 g/cm3. Figure 10b (middle panel) shows contours of the sensitivity to mass hierarchy in - space for three cases of the matter density. As indicated in the figure, there is only a small difference in the sensitivity to the mass hierarchy.
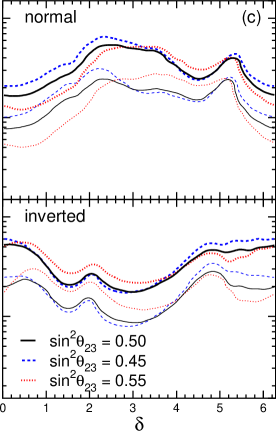
Even if is measured to an accuracy of 1%, the uncertainty in is relatively large. To examine the dependence of the sensitivity to , we have assumed that the true value of is either 0.45, 0.5 or 0.55, while the analysis is carried out assuming 0.5. Figure 10c (right panel) shows the sensitivity to the mass hierarchy in - space for the three values of . Although the sensitivity to mass hierarchy is somewhat influenced by the uncertainty of , the mass hierarchy can still be resolved without any significant overall change in the sensitivity. The effect of the uncertainty in to the sensitivity to the leptonic CP violation is very small.
In summary, we find that the conclusion we presented in the previous subsection does not depend strongly on the assumptions we have made.
V Concluding remarks
In this paper, we have explored physics capabilities of the two identical megaton-class detector complex (twin HK), one placed in the Kamioka mine and the other in Korea under the assumption that they receive the same neutrino beam from J-PARC with 4MW beam power. Unlike the foregoing analyses of such two detector setup, we have employed a radical new strategy of resolving the -sign degeneracy to determine simultaneously the neutrino mass hierarchy and the CP violating phase . We have demonstrated that the two-detector complex can determine neutrino mass hierarchy down to (0.05) for 80% coverage of the whole range of , and (0.054) for any value of both at 2 (3) CL, as indicated in Fig. 9. Importantly, the sensitivity to the CP violation of the current design of J-PARC phase II project is essentially kept or even enhanced at . The key to the enormous sensitivities is the use of two identical detectors that allows significant reduction of systematic errors by cancellation. It allows unambiguous detection of spectral distortion of neutrino energy distribution due to oscillations, which is crucial to resolve the -sign (the intrinsic) degeneracy with (without) help of the matter effect.
We have shown that our proposal elevates the current design of the phase II of J-PARC neutrino program which aims at discovering leptonic CP violation to a dual-purpose experiment, in which one can determine neutrino mass hierarchy and CP violation up to a level achievable by conventional superbeam experiments. We emphasize that, in our setting, the total volume of the two HK is the same as the planned HK with 1 Mton water in Kamioka, and the current design of the latter option already contains two tanks. Hence, the cost of the present proposal should be roughly the same as that of the conventional design. Yet, we neither addressed the issue of site availability in Korea, nor the precise estimate of systematic errors which requires specification of the site as well as actual design of the detectors.
There exist several other proposals for the next-generation long-baseline experiments in the world, NOA NOVA , the very-long-baseline project BNL , and the beta beam beta . With different assumptions and conditions, it is difficult to compare the present proposal with the existing ones. Nonetheless, we would like to emphasize that the present proposal is at least competitive to them not only on the sensitivity to the CP violation but also on resolving power of the neutrino mass hierarchy.
Acknowledgements.
One of the authors (TK) thanks Edward Witten for the encouragement of exploring the possibility discussed in this paper. This work was supported in part by the Grant-in-Aid for Scientific Research, Nos. 15204016 and 16340078, Japan Society for the Promotion of Science and by Conselho Nacional de Ciência e Tecnologia (CNPq).References
- (1) Y. Fukuda et al. [Kamiokande Collaboration], Phys. Lett. B 335, 237 (1994); Y. Fukuda et al. [Super-Kamiokande Collaboration], Phys. Rev. Lett. 81, 1562 (1998) [arXiv:hep-ex/9807003]; Y. Ashie et al. [Super-Kamiokande Collaboration], Phys. Rev. Lett. 93 (2004) 101801 [arXiv:hep-ex/0404034]; Y. Ashie et al. [Super-Kamiokande Collaboration], arXiv:hep-ex/0501064.
- (2) B. T. Cleveland et al., Astrophys. J. 496, 505 (1998); J. N. Abdurashitov et al. [SAGE Collaboration], Phys. Rev. C 60, 055801 (1999) [arXiv:astro-ph/9907113]; W. Hampel et al. [GALLEX Collaboration], Phys. Lett. B 447, 127 (1999); S. Fukuda et al. [Super-Kamiokande Collaboration], Phys. Lett. B 539, 179 (2002) [arXiv:hep-ex/0205075]; M. B. Smy et al. [Super-Kamiokande Collaboration], Phys. Rev. D 69, 011104 (2004) [arXiv:hep-ex/0309011]; Q. R. Ahmad et al. [SNO Collaboration], Phys. Rev. Lett. 87, 071301 (2001) [arXiv:nucl-ex/0106015]; ibid. 89, 011301 (2002) [arXiv:nucl-ex/0204008]; B. Aharmim et al. [SNO Collaboration], arXiv:nucl-ex/0502021.
- (3) K. Eguchi et al. [KamLAND Collaboration], Phys. Rev. Lett. 90, 021802 (2003) [arXiv:hep-ex/0212021]; T. Araki et al. [KamLAND Collaboration], Phys. Rev. Lett. 94, 081801 (2005) [arXiv:hep-ex/0406035].
- (4) M. H. Ahn et al. [K2K Collaboration], Phys. Rev. Lett. 90, 041801 (2003) [arXiv:hep-ex/0212007]; E. Aliu et al. [K2K Collaboration], Phys. Rev. Lett. 94, 081802 (2005) [arXiv:hep-ex/0411038].
- (5) M. Apollonio et al. [CHOOZ Collaboration], Phys. Lett. B 466, 415 (1999) [arXiv:hep-ex/9907037]. See also, The Palo Verde Collaboration, F. Boehm et al., Phys. Rev. D 64 (2001) 112001 [arXiv:hep-ex/0107009].
- (6) Z. Maki, M. Nakagawa and S. Sakata, Prog. Theor. Phys. 28, 870 (1962). See also, B. Pontecorvo, Zh. Eksp. Teor. Fyz. 53, 1717 (1967) [Sov. Phys. JETP 26, 984 (1968)].
- (7) M. Fukugita and T. Yanagida, Phys. Lett. B 174, 45 (1986).
-
(8)
Y. Itow et al., arXiv:hep-ex/0106019.
For an updated version, see: http://neutrino.kek.jp/jhfnu/loi/loi.v2.030528.pdf - (9) H. Minakata and H. Nunokawa, Phys. Lett. B 413, 369 (1997) [arXiv:hep-ph/9706281].
- (10) K. Nakamura, Talk at Next Generation of Nucleon Decay and Neutrino Detectors (NNN05), Aussois, Savoie, France, April 7-9, 2005. http://nnn05.in2p3.fr/
-
(11)
A partial list of early references which focused on high-energy beams includes:
S. B. Kim, Talk at KOSEF-JSPS Joint Seminar on New Developments in Neutrino Physics, October 16-20, 2000, Seoul Korea, published in Proceedings, page 182; M. Aoki, K. Hagiwara, Y. Hayato, T. Kobayashi, T. Nakaya, K. Nishikawa and N. Okamura, Phys. Rev. D 67, 093004 (2003) [arXiv:hep-ph/0112338]. Y. F. Wang, K. Whisnant, Z. h. Xiong, J. M. Yang and B. L. Young [VLBL Study Group H2B-4], Phys. Rev. D 65, 073021 (2002) [arXiv:hep-ph/0111317]. - (12) H. Minakata and H. Nunokawa, JHEP 0110, 001 (2001) [arXiv:hep-ph/0108085]; Nucl. Phys. Proc. Suppl. 110, 404 (2002) [arXiv:hep-ph/0111131].
- (13) H. Minakata, in Venice 2003, Neutrino oscillations, 303, edited by M. Baldo Ceolin. Padova, Papergraf, 2003 [arXiv:hep-ph/0402197].
- (14) K. Hagiwara, Nucl. Phys. Proc. Suppl. 137, 84 (2004) [arXiv:hep-ph/0410229].
- (15) D. Ayres et al. [Nova Collaboration], arXiv:hep-ex/0210005; arXiv:hep-ex/0503053.
- (16) P. Huber, M. Lindner and W. Winter, Nucl. Phys. B 645, 3 (2002) [arXiv:hep-ph/0204352].
- (17) H. Minakata and H. Sugiyama, Phys. Lett. B580, 216 (2004) [arXiv:hep-ph/0309323].
- (18) O. Yasuda, arXiv:hep-ph/0405222. See also H. Minakata, Nucl. Phys. Proc. Suppl. 137, 74 (2004).
- (19) J. Arafune, M. Koike and J. Sato, Phys. Rev. D 56 (1997) 3093 [Erratum-ibid. D 60 (1999) 119905], [arXiv:hep-ph/9703351].
- (20) L. Wolfenstein, Phys. Rev. D 17, 2369 (1978).
- (21) D. Beavis et al., arXiv:hep-ex/0205040; M. V. Diwan et al., Phys. Rev. D 68, 012002 (2003) [arXiv:hep-ph/0303081].
- (22) Y. Declais et al. Nucl. Phys. B 434, 503 (1995).
- (23) J. Burguet-Castell, M. B. Gavela, J. J. Gomez-Cadenas, P. Hernandez and O. Mena, Nucl. Phys. B 608, 301 (2001) [arXiv:hep-ph/0103258].
- (24) G. Fogli and E. Lisi, Phys. Rev. D54, 3667 (1996) [arXiv:hep-ph/9604415].
- (25) V. Barger, D. Marfatia and K. Whisnant, Phys. Rev. D 65, 073023 (2002) [arXiv:hep-ph/0112119];
- (26) T. Kajita, H. Minakata and H. Nunokawa, Phys. Lett. B 528, 245 (2002) [arXiv:hep-ph/0112345].
- (27) H. Minakata, H. Nunokawa and S. Parke, Phys. Rev. D 66, 093012 (2002) [arXiv:hep-ph/0208163].
- (28) Minakata, H. Sugiyama, O. Yasuda, K. Inoue and F. Suekane, Phys. Rev. D 68, 033017 (2003) [Erratum-ibid. D 70, 059901 (2004)] [arXiv:hep-ph/0211111].
- (29) A. Donini, D. Meloni and P. Migliozzi, Nucl. Phys. B 646, 321 (2002) [arXiv:hep-ph/0206034].
-
(30)
H. Minakata, Talk at 5th International Workshop on Neutrino Factories
and Superbeams (NuFact 03), 5-11 Jun 2003, New York, New York
http://www.cap.bnl.gov/nufact03/agenda-wg1.xhtml; AIP Conf. Proc. 721, 206 (2004). - (31) J. Burguet-Castell, M. B. Gavela, J. J. Gomez-Cadenas, P. Hernandez and O. Mena, Nucl. Phys. B 646, 301 (2002) [arXiv:hep-ph/0207080]; J. Burguet-Castell, D. Casper, J. J. Gomez-Cadenas, P. Hernandez and F. Sanchez, Nucl. Phys. B 695, 217 (2004) [arXiv:hep-ph/0312068]; A. Donini, E. Fernandez-Martinez, P. Migliozzi, S. Rigolin and L. Scotto Lavina, Nucl. Phys. B 710, 402 (2005) [arXiv:hep-ph/0406132]; O. Mena and S. J. Parke, Phys. Rev. D 70, 093011 (2004) [arXiv:hep-ph/0408070]. See also P. Huber, M. Lindner and W. Winter, arXiv:hep-ph/0412199 for extensive related references cited therein.
- (32) T. Kobayashi, J. Phys. G29, 1493 (2003); S. Mine, talk presented at the Neutrino Session of NP04 workshop, Aug. 2004, KEK, Tsukuba, Japan (http://jnusrv01.kek.jp/jhfnu/NP04nu/); T. Kobayashi, talk presented at the 8th Neutrino Workshop (in Japanese), Nov. 2001, ICRR, Kashiwa, Japan.
- (33) M. Koike and J. Sato, Mod. Phys. Lett. A 14, 1297 (1999) [arXiv:hep-ph/9803212].
- (34) A. M. Dziewonski and D. L. Anderson, Phys. Earth Planet. Interiors 25, 297 (1981).
- (35) G. L. Fogli, E. Lisi, A. Marrone, D. Montanino and A. Palazzo, Phys. Rev. D 66, 053010 (2002) [arXiv:hep-ph/0206162].
- (36) H. Minakata and H. Nunokawa, Nucl. Instrum. Meth. A 503, 218 (2003) [arXiv:hep-ph/0111130].
- (37) J. Bouchez, M. Lindroos and M. Mezzetto, AIP Conf. Proc. 721, 37 (2004) [arXiv:hep-ex/0310059]; M. Mezzetto, Nucl. Phys. Proc. Suppl. 143, 309 (2005) [arXiv:hep-ex/0410083].