QCD Predictions for Charm and Bottom Production at RHIC
Abstract
We make up-to-date QCD predictions for open charm and bottom production at RHIC in nucleon-nucleon collisions at GeV. We also calculate the electron spectrum resulting from heavy flavor decays to allow direct comparison to the data. A rigorous benchmark, including the theoretical uncertainties, is established against which nuclear collision data can be compared to obtain evidence for nuclear effects.
Over the past few years, heavy quark production at colliders has received considerable attention since a variety of measurements (photon-photon, photoproduction and collisions) seemed to suggest a discrepancy, in particular for bottom production, with respect to standard next-to-leading order (NLO) Quantum Chromodynamics (QCD) predictions. New theoretical analyses and better measurements have, however, largely reduced this discrepancy to the point that, in most cases, it no longer appears significant (see Refs. [1, 2] for a review and relevant references).
It is important to continue to validate this theoretical framework and its phenomenological inputs***We emphasize that such inputs were not chosen in order to fit the data, but rather consistently extracted from other experimental measurements. in new measurements such as the recent heavy flavor data obtained at the Relativistic Heavy Ion Collider (RHIC) by the PHENIX [3] and STAR [4, 5] Collaborations. Data taken in and d+Au collisions at GeV and compared to theoretical benchmark calculations will aid in the interpretation of heavy flavor production in nucleus-nucleus collisions at the same energies. In these heavy ion collisions, which seek to establish the existence of the quark-gluon plasma (QGP), a number of effects on heavy flavor production have been predicted. Of particular interest are effects which modify the transverse momentum spectra of heavy flavor hadrons and their decay products, including energy loss [6, 7, 8, 9], transverse momentum broadening in both cold nuclear matter [10] and in passage through a hadronizing QGP [11] as well as collective effects such as transverse flow [12, 13]. In addition, regeneration in a QGP from the initial open charm yield has been suggested [14, 15, 16]. Thus up-to-date benchmark calculations of both the total charm yield and the transverse momentum spectra are imperative.
The RHIC data are conveniently presented as real observables, either as reconstructed hadronic decays of charm mesons or as the heavy flavor decay electron spectra, with contributions from both charm and bottom hadron decays. In both cases, the transverse momentum spectra are presented. Such concrete observables, which can be directly compared to predictions of the same quantities, stand in contrast to the often adopted procedure of experimental ‘deconvolution’ to a more basic level. Such a deconvolution to the bare heavy quark level and the subsequent extrapolation to full phase space, sometimes involving large factors, risks biasing the data since theoretical prejudice enters in both the deconvolution and the extrapolation, and should therefore be avoided.
The purpose of this paper is neither to review all possible methods to evaluate the heavy quark cross section in heavy ion collisions, nor to perform a detailed analysis of the data. Instead, besides comparing the RHIC data to the most up-to-date QCD predictions, we establish the aforementioned benchmark calculation for further comparisons. To this end, we thus adhere to the rigorous QCD framework shown to be successful in collisions. Significant deviations from this benchmark could thus signal the presence of effects specific to the high density environment of heavy ion collisions, such as those mentioned previously.
To make comparisons at various levels (while preferring the final observable), in this letter we present predictions of the transverse momentum, , distributions of charm and bottom quarks, the charm and bottom hadron distributions resulting from fragmentation and, finally, the electrons produced in semileptonic decays of the hadrons. At each step, we clarify the theoretical framework as well as the parameters and phenomenological inputs. Theoretical uncertainties are estimated as extensively as possible since comparisons of data with theory should not be performed at the ‘central value’ level only but should also include the respective uncertainties. Our final prediction is thus not a single curve but rather an uncertainty band which has a reasonably large probability of containing the ‘true’ theoretical prediction†††Since a rigorous statistical estimate for this probability is not possible in the frequentist sense for theoretical errors, one might resort to a Bayesian analysis to quantify it. While refraining from such an effort, we roughly estimate this probability as -90%..
The theoretical prediction of the electron spectrum includes three main components: the and rapidity distributions of the heavy quark in collisions at GeV, calculated in perturbative QCD; fragmentation of the heavy quarks into heavy hadrons, , described by phenomenological input extracted from data; and the decay of into electrons according to spectra available from other measurements. This cross section is schematically written as
| (1) | |||||
| (2) |
where the symbol denotes a generic convolution. The electron decay spectrum term also implicitly accounts for the proper branching ratio.
The distribution is evaluated at the Fixed-Order plus Next-to-Leading-Log (FONLL) level, implemented in Ref. [17]. In addition to including the full fixed-order NLO result [18, 19], the FONLL calculation also resums [20] large perturbative terms proportional to to all orders with next-to-leading logarithmic (NLL) accuracy (i.e. ) where is the heavy quark mass. The perturbative parameters are the heavy quark mass and the value of the strong coupling, . We take GeV and GeV as reference values and vary the masses over the range GeV for charm and GeV for bottom to estimate the resulting mass uncertainties. The QCD scale at five flavors, , is set to 0.226 GeV, i.e. the value provided by the CTEQ6M parton densities. The perturbative calculation also depends on the unphysical factorization () and renormalization () scales. The sensitivity of the cross section to their variation can be used to estimate the perturbative uncertainty due to the absence of higher orders. We have taken as a central value and varied the two scales independently within a ‘fiducial’ region defined by with and . In practice, we use the following seven sets: = {(1,1), (2,2), (0.5,0.5), (1,0.5), (2,1), (0.5,1), (1,2)}. The envelope containing the resulting curves defines the uncertainty. Finally, the uncertainties stemming from mass and scale variations are added in quadrature.
These ‘perturbative’ inputs lead to a FONLL total cross section in collisions of b at GeV. The theoretical uncertainty is evaluated as described above. The corresponding NLO prediction‡‡‡Earlier papers [10] used GeV and as reference parameters. With this choice we find b. is b. Thus the two calculations are equivalent at the total cross section level within the large perturbative uncertainties, as expected. The total cross section for bottom production is b.
The fragmentation functions and , where and indicate a generic admixture of charm and bottom hadrons, are consistently extracted from data in the context of a FONLL-type calculation, as described in Refs. [21, 23, 22]. The charm fragmentation function [23] depends on the parameter [24] with for GeV, for GeV, and for GeV from fits. Bottom fragmentation instead depends on the parameter in a functional form by Kartvelishvili et al. [25]: for GeV, for GeV, and for GeV (see Ref. [22]). It is worth noting that using the Peterson et al. fragmentation function [26], with standard parameter choices and would not provide a valid description of fragmentation in FONLL [21]. Fragmentation is numerically performed by rescaling the quark three-momentum at a constant angle in the laboratory frame. This choice is, to some extent, arbitrary. Alternatively, one might rescale the transverse momentum at constant rapidity. While all choices are equivalent at , they will, in general, lead to different results at , where a large fraction of the RHIC data lie. The ensuing uncertainty is, however, not larger than the perturbative ones [22] and will therefore not be considered in more detail.
The decay of the and mesons into electrons is controlled by the experimentally measured decay spectra and branching ratios (BR). The spectrum for primary decays has been measured recently by BaBar[28] and CLEO[29]. We have used a model that fits the data well and assume it to be valid for all bottom hadrons. Preliminary CLEO data on the inclusive electron spectrum in semi-leptonic decays have been shown [30]. We fitted this spectrum and we assume it to be identical for all charm hadrons. Finally, the contribution of electrons from the secondary decays has also been accounted for. The relevant electron spectrum has been obtained as a convolution of the spectrum mentioned above with a parton-model prediction for the decay. The resulting electron spectrum is very soft, suggesting that its contribution to the total will most likely be negligible.
To normalize the decay spectra, we use the branching ratios for bottom and charm hadron mixtures§§§Note that the experimental uncertainties on the BRs have not been included in the overall uncertainty of the predictions, since they are much smaller than those of perturbative origin. appropriate to this high energy regime [27]: BR%, BR%, and BR%.
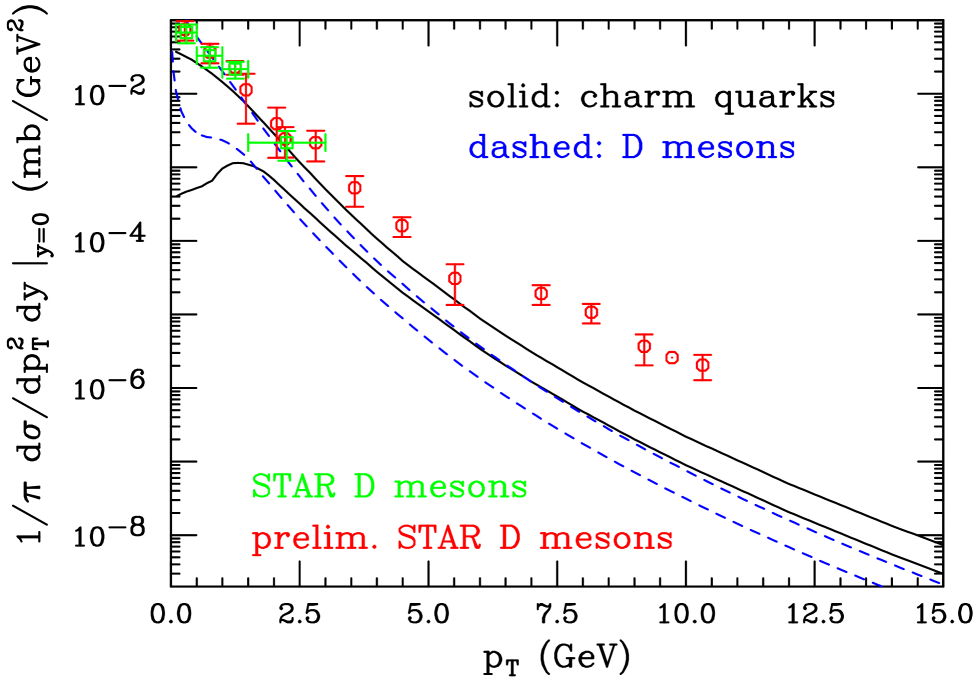
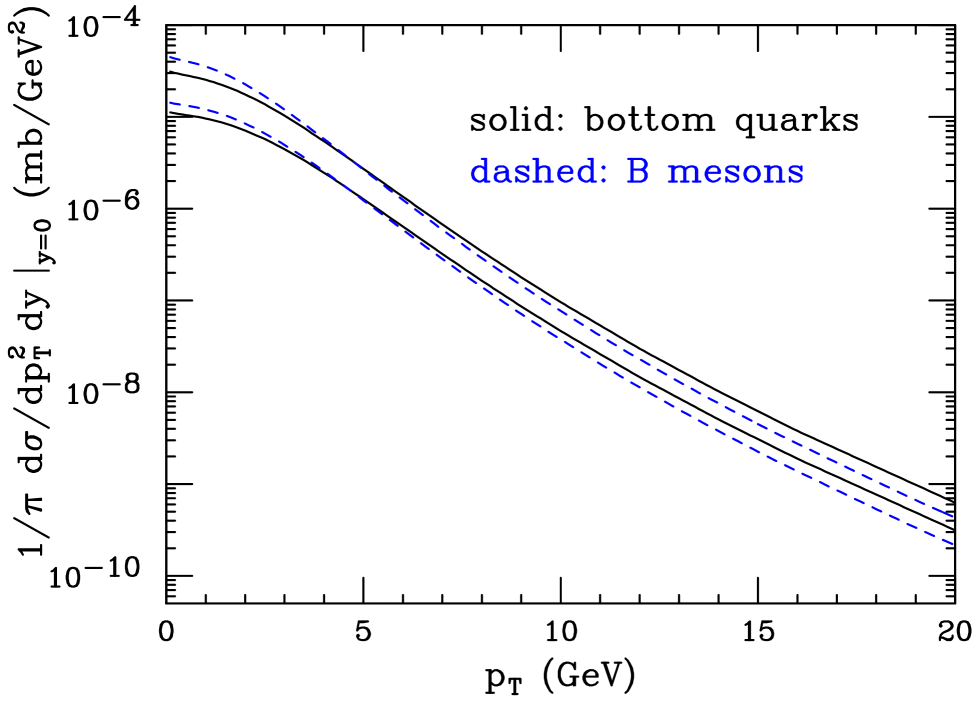
We first present the transverse momentum distributions for charm quarks and charm hadrons. Figure 1 shows the theoretical uncertainty bands for the two distributions, obtained by summing the mass and scale uncertainties in quadrature¶¶¶ For example, the value of the upper curve is , where C stands for the central values, is the maximum cross section obtained by choosing GeV with the scale factors in our seven fiducial sets, and is the maximum cross section obtained with and and GeV.. Note that the band is enlarged at low due to the large value of at low scales and the increased sensitivity of the cross section to the charm quark mass. It is also worth noting that, due to the fairly hard fragmentation function, the meson and quark distributions begin to differ outside the uncertainty bands only for GeV. The same comparison is shown in Fig. 2 for bottom quarks and the subsequent mesons. As a result of the harder fragmentation function, the two bands partially overlap for GeV and beyond.
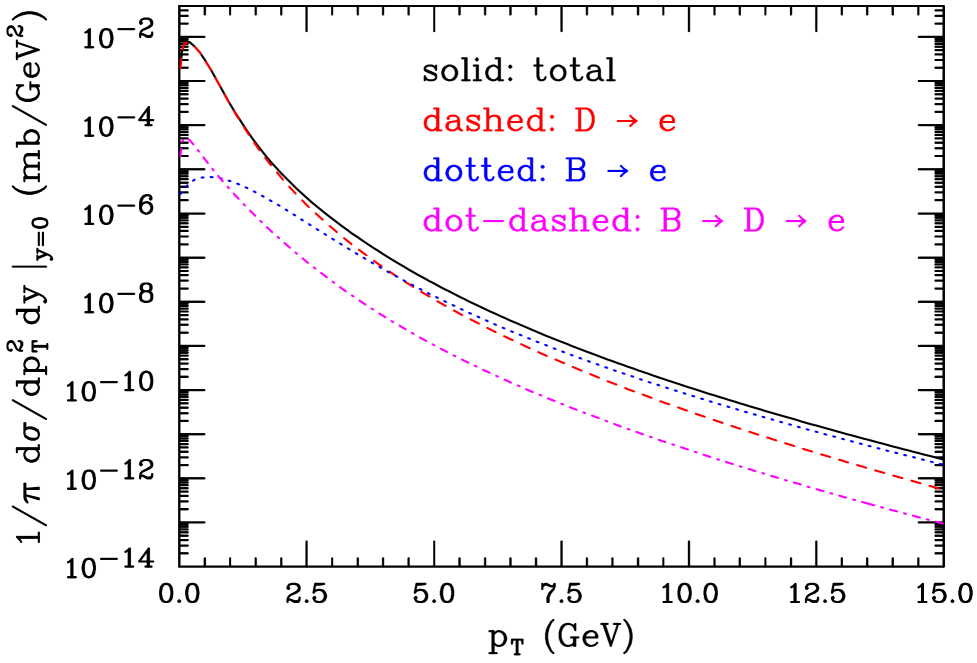
We next consider the transverse momentum distributions of electrons from and decays. Figure 3 shows the contributions from , and decays as well as the total. As anticipated, the secondary electron spectrum is extremely soft, only exceeding the primary decays at GeV. It is always negligible with respect to the total yield. We further note that the electron spectrum from decays becomes larger than that of electrons from decays at GeV. The qualitative features of this plot are in good agreement with results obtained by the RHIC Collaborations using the PYTHIA event generator [31].
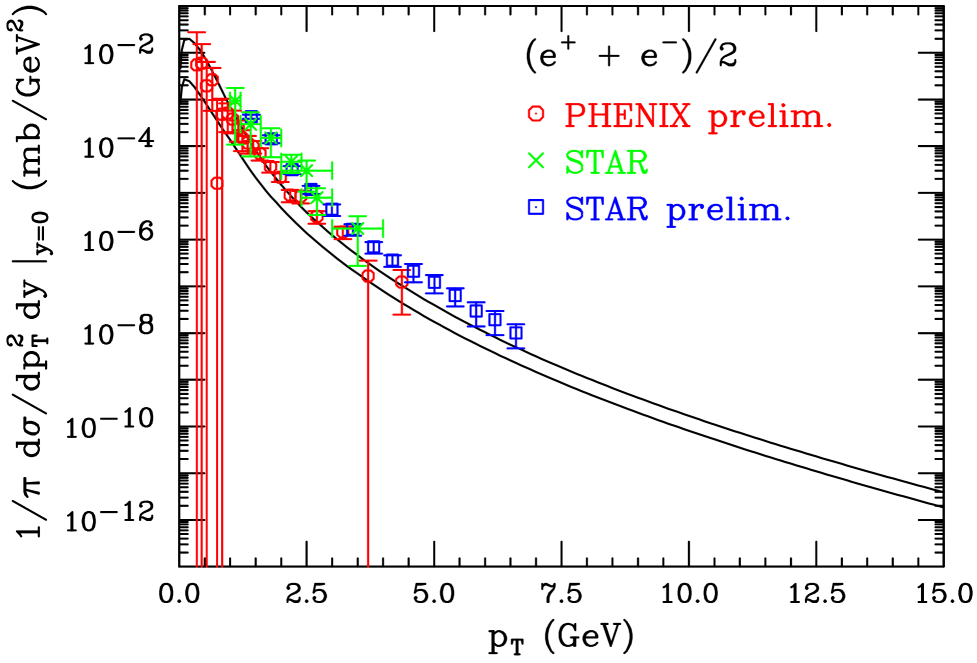
Finally, in Fig. 4 we show the theoretical uncertainty band for electrons coming from charm and bottom hadron decays at GeV at RHIC. The sum of the three components shown in Fig. 3 corresponds to the central value of the band in Fig. 4. The upper and lower limit of the band are obtained by summing the upper and lower limit for each component.
In conclusion, we have evaluated the higher order QCD charm and bottom quark production cross sections in GeV collisions at RHIC. The results are presented in the form of a theoretical uncertainty band for the transverse momentum distribution of either bare charm (bottom), () mesons, or electrons originating from the decay of charm and bottom hadrons. This result should not be multiplied by any factor before comparison with data. Rather, agreement within the uncertainties of the measurements will support the applicability of standard QCD calculations to heavy quark production at RHIC. Alternatively, a significant disagreement will suggest the need to complement this evaluation with further ingredients.
Acknowledgements.
We wish to thank Jack Smith for having suggested the calculation of these predictions, John Yelton and David Asner for information on the CLEO-c preliminary data for inclusive decay, Ralf Averbeck, Sergey Butsyk, Gouranga Nayak and An Tai for many details about the ongoing PHENIX and STAR heavy flavour analyses.REFERENCES
- [1] M. Cacciari, “Rise and fall of the bottom quark production excess,” arXiv:hep-ph/0407187.
- [2] M. L. Mangano, “The saga of bottom production in proton antiproton collisions,” arXiv:hep-ph/0411020.
- [3] S. Kelly [PHENIX Collaboration], J. Phys. G 30 (2004) S1189 [arXiv:nucl-ex/0403057].
- [4] J. Adams et al. [STAR Collaboration], Phys. Rev. Lett. 94 (2005) 062301 [arXiv:nucl-ex/0407006].
- [5] A. Tai [STAR Collaboration], J. Phys. G 30 (2004) S809 [arXiv:nucl-ex/0404029].
- [6] M. Djordjevic, M. Gyulassy and S. Wicks, arXiv:hep-ph/0410372.
- [7] N. Armesto, C. A. Salgado and U. A. Wiedemann, Phys. Rev. D 69 (2004) 114003 [arXiv:hep-ph/0312106].
- [8] Y. L. Dokshitzer and D. E. Kharzeev, Phys. Lett. B 519 (2001) 199 [arXiv:hep-ph/0106202].
- [9] Z. w. Lin, R. Vogt and X. N. Wang, Phys. Rev. C 57 (1998) 899 [arXiv:nucl-th/9705006].
- [10] R. Vogt [Hard Probe Collaboration], Int. J. Mod. Phys. E 12 (2003) 211 [arXiv:hep-ph/0111271].
- [11] B. Svetitsky and A. Uziel, Phys. Rev. D 55 (1997) 2616 [arXiv:hep-ph/9606284].
- [12] V. Greco, C. M. Ko and R. Rapp, Phys. Lett. B 595 (2004) 202 [arXiv:nucl-th/0312100].
- [13] Z. w. Lin and D. Molnar, Phys. Rev. C 68 (2003) 044901 [arXiv:nucl-th/0304045].
- [14] R. L. Thews, M. Schroedter and J. Rafelski, Phys. Rev. C 63 (2001) 054905 [arXiv:hep-ph/0007323].
- [15] A. Andronic, P. Braun-Munzinger, K. Redlich and J. Stachel, Phys. Lett. B 571 (2003) 36 [arXiv:nucl-th/0303036].
- [16] A. P. Kostyuk, M. I. Gorenstein, H. Stöcker and W. Greiner, Phys. Rev. C 68 (2003) 041902 [arXiv:hep-ph/0305277].
-
[17]
M. Cacciari, M. Greco and P. Nason,
JHEP 9805 (1998) 007
[arXiv:hep-ph/9803400];
M. Cacciari, S. Frixione and P. Nason, JHEP 0103 (2001) 006 [arXiv:hep-ph/0102134]. -
[18]
P. Nason, S. Dawson and R. K. Ellis,
Nucl. Phys. B 303 (1988) 607;
P. Nason, S. Dawson and R. K. Ellis, Nucl. Phys. B 327 (1989) 49 [Erratum-ibid. B 335 (1990) 260]. - [19] W. Beenakker, W. L. van Neerven, R. Meng, G. A. Schuler and J. Smith, Nucl. Phys. B 351 (1991) 507.
- [20] M. Cacciari and M. Greco, Nucl. Phys. B 421 (1994) 530 [arXiv:hep-ph/9311260].
- [21] M. Cacciari and P. Nason, Phys. Rev. Lett. 89 (2002) 122003 [arXiv:hep-ph/0204025].
- [22] M. Cacciari, S. Frixione, M. L. Mangano, P. Nason and G. Ridolfi, JHEP 0407 (2004) 033 [arXiv:hep-ph/0312132].
- [23] M. Cacciari and P. Nason, JHEP 0309 (2003) 006 [arXiv:hep-ph/0306212].
- [24] E. Braaten, K. Cheung, S. Fleming and T. C. Yuan, Phys. Rev. D 51, 4819 (1995) [arXiv:hep-ph/9409316].
- [25] V. G. Kartvelishvili, A. K. Likhoded and V. A. Petrov, Phys. Lett. B 78 (1978) 615.
- [26] C. Peterson, D. Schlatter, I. Schmitt and P. M. Zerwas, Phys. Rev. D 27 (1983) 105.
- [27] S. Eidelman et al. [Particle Data Group Collaboration], Phys. Lett. B 592 (2004) 1.
- [28] B. Aubert et al. [BABAR Collaboration], Phys. Rev. D 69 (2004) 111104 [arXiv:hep-ex/0403030].
- [29] A. H. Mahmood et al. [CLEO Collaboration], Phys. Rev. D 70 (2004) 032003 [arXiv:hep-ex/0403053].
- [30] CLEO TALK 04-42, “First Results from CLEO-c”, J. Yelton [CLEO Collaboration], http://www.lns.cornell.edu/public/TALK/2004/TALK04-42/
- [31] T. Sjostrand, P. Eden, C. Friberg, L. Lonnblad, G. Miu, S. Mrenna and E. Norrbin, Comput. Phys. Commun. 135 (2001) 238 [arXiv:hep-ph/0010017].