How much Uranium is in the Earth?
Predictions for geo-neutrinos at KamLAND
Abstract
Geo-neutrino detection can determine the amount of long-lived radioactive elements within our planet, thus providing a direct test of the Bulk Silicate Earth (BSE) model and fixing the radiogenic contribution to the terrestrial heat. We present a prediction for the geo-neutrino signal at KamLAND as a function of the Uranium mass in the Earth. The prediction is based on global mass balance, supplemented by a detailed geochemical and geophysical study of the region near the detector. The prediction is weakly dependent on mantle modeling. If BSE is correct, Uranium geo-neutrinos will produce between 25 and 35 events per year and protons at Kamioka.
pacs:
check 91.35.-x, 13.15.+g, 14.60.Pq, 23.40.BwI Introduction
The deepest hole that has ever been dug is about 12 Km deep, a mere dent in planetary terms. Geochemists analyze samples from the Earth’s crust and from the top of the mantle, whereas seismology can reconstruct the density profile throughout the whole Earth but not its composition. In this respect, our planet is mainly unexplored. Geo-neutrinos — the antineutrinos from the progenies of U, Th and 40K decays in the Earth — bring to the surface information from the whole planet, concerning its content of radioactive elements. Their detection can shed light on the sources of the terrestrial heat flow, on the present composition and on the origins of the Earth.
Geo-neutrino properties, summarized in Table 1, deserve a few comments:
(i) geo-neutrinos originating from different elements can be distinguished due to their different energy spectra, e.g., geo-neutrinos with energy MeV are produced only from the Uranium chain;
(ii) geo-neutrinos from U and Th (not those from 40K) are above threshold for the classical anti-neutrino detection reaction, the inverse beta on free protons:
| (1) |
(iii) anti-neutrinos from the Earth are not obscured by solar neutrinos, which cannot yield reaction (1).
| Decay | |||||
|---|---|---|---|---|---|
| [MeV] | [ yr] | [MeV] | [W/Kg] | [kg-1s-1] | |
| 51.7 | 4.47 | 3.26 | |||
| 42.7 | 14.0 | 2.25 | |||
| 1.32 | 1.28 | 1.31 |
Geo-neutrinos were introduced by Eder Eder in the sixties and Marx Marx soon realized their relevance. In the eighties Krauss et al. discussed their potential as probes of the Earth’s interior in an extensive publication Krauss:zn . In the nineties the first paper on a geophysical journal was published by Kobayashi et al. Kobayashi . In 1998, Raghavan et al. Raghavan:1997gw and Rotschild et al. Rothschild:1997dd pointed out the potential of KamLAND and Borexino for geo-neutrino detection.
In the last three years more papers appeared than in the previous decades: in a series of papers Fiorentini et al. Fiorentini:2002bp ; Fiorentini:2003ww ; Mantovani:2003yd ; Fiorentini:2004xk ; Fiorentini:2004rj discussed the role of geo-neutrinos for determining the radiogenic contribution to the terrestrial heat flow and for discriminating among different models of Earth’s composition and origin. A reference model for geo-neutrino production, based on a compositional map of the Earth’s crust and on geochemical modeling of the mantle, was presented in Mantovani:2003yd . At the end of 2002, the analysis of the first data release of KamLAND Eguchi:2002dm (equivalent to an exposure of proton yr and 100% efficiency) reported 4 events from Uranium and 5 from Thorium out of a total of 32 counts in the geo-neutrino energy region ( MeV), after subtracting 20 reactor events and 3 background counts. Statistical fluctuations imply an error of, at least, 5.7 counts. Indeed, this first indication of geo-neutrinos stimulated several investigations Nunokawa:2003dd ; Mitsui:2003fm ; Miramonti:2003hw ; Domogatski:2004gs ; McKeown:2004yq ; Fields:2004tf ; Rusov:2003sx ; Fogli:2004vb .
In a few years KamLAND should provide definite evidence of geo-neutrino signal, after accumulating a much larger statistics and reducing background. In the meanwhile other projects for geo-neutrino detection are being developed. Borexino at Gran Sasso, which is expected to take data in a few years, will benefit from the absence of nearby reactors. Domogatski et al. Domogatski:2004zz are proposing a 1 Kton scintillator detector in Baksan, again very far from nuclear reactors. A group at the Sudbury Neutrino Observatory in Canada is studying the possibility of using liquid scintillator after the physics program with heavy water is completed. The LENA proposal envisages a 30 Kton liquid scintillator detector at the Center for Underground Physics in the Pyhasälmi mine (Finland). Due to the huge mass, it should collect several hundreds of events per year. In conclusion, one can expect that within 10 years the geo-neutrino signal from Uranium and Thorium will be measured at a few points on the globe.
In this paper we shall concentrate on geo-neutrinos from Uranium, which are closer to experimental detection, and on the predictions for Kamioka, the site hosting the only detector which is presently operational. Our goal is to understand which information on the total amount of Uranium in the Earth can be extracted from geo-neutrino measurements.
As briefly discussed in the next section, the Uranium mass in the Earth is estimated on the grounds of cosmo-chemical arguments, based on the compositional similarity between Earth and carbonaceous chondrites. Measurements of samples from the Earth’s crust imply that the crust contains about one half of this global estimate, whereas the mantle — which should contain the rest — is practically unexplored in this respect. A direct determination of the Uranium mass in the globe is clearly an important test of the origins of the Earth. Furthermore, such a determination will also fix the radiogenic contribution to the terrestrial heat flow, which is a presently debated issue, see, e.g., Ref. Anderson . Early estimates of the geo-neutrino signal and their connection with the global Uranium content are also reviewed at the end of Section II.
The geo-neutrino signal depends on the total Uranium mass in the Earth and on the geochemical and geophysical properties of the region around the detector Fiorentini:2002bp . For KamLAND, we estimated Mantovani:2003yd that about one half of the signal is originated within 200 km from the detector. This region, although containing a globally negligible amount of uranium, produces a large contribution to the signal as a consequence of its proximity to the detector. This contribution has to be determined on the grounds of a detailed geochemical and geophysical study of the region, if one wants to extract from the total signal the remaining part which carries the relevant information on . The study of the region around Kamioka, including the possible effects of the subducting plates below the Japan Arc and a discussion of the contribution from of the Japan Sea, is presented in Section III.
The contribution from the rest of the world, discussed in Section IV, depends on the total mass of Uranium as well as on its distribution inside the Earth, since the closer is the source to the detector the larger is its contribution to the signal. For each value of , we shall construct the distributions of Uranium abundances which provide the maximal and minimal signals, under the condition that they are consistent with geochemical and geophysical information on the globe. For the Earth’s crust we shall use a map mappa which distinguishes several crustal layers and to each layer we shall assign minimal/maximal values for the Uranium mass abundances. According to geochemists, the rest of Uranium should be found in the mantle. Observational data for this reservoir are very poor, however it is generally believed that Uranium abundance increases with depth. The assumption that abundance is spherically symmetrical and non decreasing with depth will be enough to provide rather tight bounds on the mantle contribution to the geo-neutrino signal. This will be further combined with the results for the crust.
We shall put together the pieces of the above analysis in Section V, where we present our main result in Fig. 1: a narrow band describes the predicted signal as a function of Earth’s total Uranium mass. We remark that the extremes of the band correspond to the whole range of uncertainty, which is estimated according to the following criteria: (i) for statistical errors we consider a interval; (ii) for systematic uncertainties of geochemical and geophysical parameters we determine an interval such as to cover all modern estimates which we found in the literature; (iii) independent errors are combined in quadrature.
On the grounds of Fig. 1 we discuss how the geo-neutrino signal can provide a direct test of a fundamental paradigm on the origins and composition of our planet.

II U, Th and K in the Earth: how much and where?
Earth’s global composition is generally estimated from that of chondritic meteorites by using geochemical arguments which account for losses and fractionation during planet formation. Along these lines the Bulk Silicate Earth (BSE) model is built, which describes the “primitive mantle”, i.e., the outer portion of the Earth after core separation and before the differentiation between crust and mantle. The model is believed to describe the present crust plus mantle system. Since lithophile elements should be absent in the core 111One needs to be careful, since the definition of an element’s behavior, i.e., lithophile or not, depends on the surrounding system; there exist models of the Earth’s core suggesting it as repository for radioactive elements., the BSE provides the total amounts of U, Th and K in the Earth, estimates from different authors being concordant within 10-15% Mcdonough:2003 . From the estimated masses, the present radiogenic heat production rate and anti-neutrino luminosity can be immediately calculated, see Table 2 and, e.g., Ref. Fiorentini:2004xk .
| [ kg] | [ W] | [ s-1] | |
|---|---|---|---|
| U | 0.8 | 7.6 | 5.9 |
| Th | 3.1 | 8.5 | 5.0 |
| 40K | 0.8 | 3.3 | 21.6 |
The BSE is a fundamental geochemical paradigm. It is consistent with most observations, which however regard mostly the crust and an undetermined portion of the mantle. The measurement of quantities — such as the geo-neutrino signals — which are directly related to the global amounts of radioactive elements in the Earth will provide a direct test of this model for composition and origin of our planet.
For sure, heat released from radiogenic elements is a major source of the terrestrial heat flow, however its role is not understood at a quantitative level. The masses estimated within the BSE account for the present radiogenic production of 19 TW, which is about one half of the estimated heat flow from Earth Anderson ; Hofmeister . Anderson refers to this difference as the missing heat source mystery and summarizes the situation with the following words: “Global heat flow estimates range from 30 to 44 TW …Estimates of the radiogenic contribution …based on cosmochemical considerations, vary from 19 to 31 TW. Thus, there is either a good balance between current input and output …or there is a serious missing heat source problem, up to a deficit of 25 TW …” If one can determine the amounts of radioactive elements by means of geo-neutrinos, an important ingredient of Earth’s energetics will be fixed.
Concerning the distribution of radiogenic elements, estimates for Uranium in the continental crust based on observational data are in the range:
| (2) |
The extreme values have been obtained in Ref. Fiorentini:2004rj by taking the lowest (highest) concentration reported in the literature for each layer of the Earth’s crust, see Table II of Ref. Mantovani:2003yd , and integrating over a crust map. The main uncertainty is from the Uranium mass abundance in the lower crust, with estimates in the range ppm. Estimates for the abundance in the upper crust, , are more concordant, ranging from 2.2 ppm to 2.8 ppm. The crust — really a tiny envelope — should thus contain about one half of the BSE prediction of Uranium in the Earth.
About the mantle, observational data are scarce and restricted to the uppermost part, so the best estimate for its Uranium content is obtained by subtracting the crust contribution from the BSE estimate:
| (3) |
A commonly held view is that there is a vertical gradient in the abundances of incompatible elements in the mantle, with the top being most depleted. A minimum gradient model has a fully mixed and globally homogeneous mantle; the other extreme is a model where all the Uranium is at the bottom of the mantle.
Geochemical arguments are against the presence of radioactive elements in the completely unexplored core, as discussed by McDonough in a recent review of compositional models of the Earth Mcdonough:2003 .
Similar considerations hold for Thorium and Potassium, the relative mass abundance with respect to Uranium being globally estimated as:
| (4) |
We remark that the well-fixed ratios in Eq. (4) imply that detection of geo-neutrinos from Uranium will also bring important information on the amount of Thorium and Potassium in the whole Earth.
Several predictions for the geo-neutrino signal have been presented in the past, corresponding to different hypotheses about the amount of Uranium in the Earth and to different models of its distribution. A summary is presented in Fig. 2. Early models Eder ; Marx ; Kobayashi (full circles) assumed a uniform Uranium distribution in the Earth and different values of the Uranium mass. In fact these predictions are almost proportional to . The huge signals predicted by Eder and by Marx were obtained by assuming that the Uranium density in the whole Earth is about the same as that observed in the continental crust; Marx (Eder 222The factor 10.7 appearing in the last of the equations (13) of Ref. Eder should actually be 1.07 and, correspondingly, the reaction rate on page 661 has been divided by a factor of 10.) assumed thus an Uranium mass 30 (60) times larger than that estimated within the BSE.

Krauss et al. Krauss:zn distributed about kg of Uranium uniformly over a 30 km crust. The other estimates (crosses) are all obtained by using the BSE value for the mass as an input and different models for distributing the Uranium content between crust and mantle. In this class, Rotschild et al. Rothschild:1997dd obtained the minimal prediction by assuming for the crust a very small Uranium abundance, definitely lower than the values reported in more recent and detailed estimates.
In this paper we shall use a rather general approach, by keeping the total amount of Uranium as a free variable, within the loose constraints provided from one side by the amount observed in the crust and from the other side by the amount tolerated by Earth’s energetics. We shall distribute the total amount between crust and mantle so as to maximize or minimize the signal, within the boundary provided by geochemical and/or geophysical observations.
III The region near the detector
As mentioned in the introduction, the entire Earth’s crust will be subdivided into tiles. Within each tile, one distinguishes several vertical layers and assigns to each layer a world averaged Uranium mass abundance, see Ref. Mantovani:2003yd . With the aim of reducing the error on the regional contribution to the level of the uncertainty on the rest of the world, one needs a more detailed geochemical and geophysical study of the crust in the region within a few hundreds kilometers from the detector, where some half of the signal is generated.
We shall present here our results for the region near the KamLAND detector, located at N and E. We analyze the six tiles (see Fig. 3) around KamLAND by using geochemical information on a grid and a detailed map of the crust depth. The possible (minimal and maximal) effects of the subducting slab beneath Japan are also considered and the uncertainty arising from the debated (continental or oceanic) nature of the crust below the Japan Sea is taken into account.
III.1 The six tiles near KamLAND
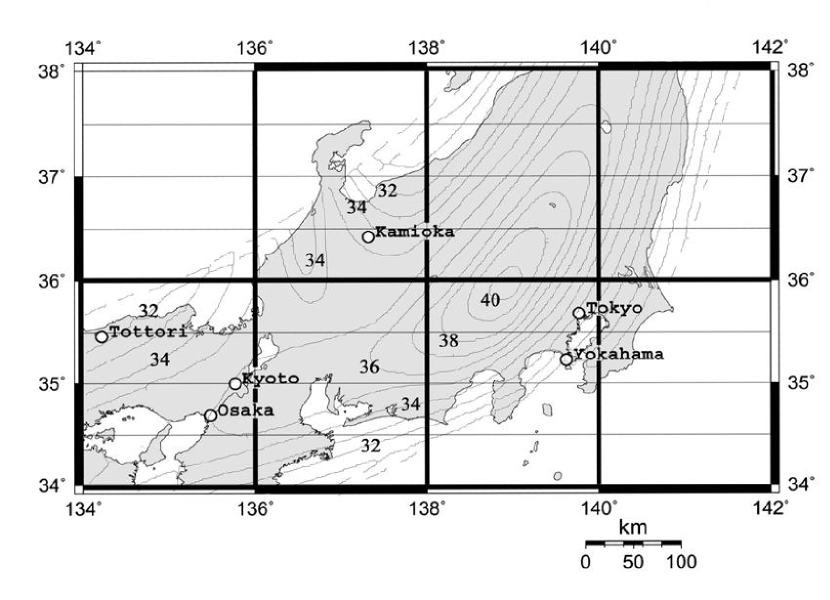
The seismic velocity structure of the crust beneath the Japan Islands has been determined in Ref. Zhao:1992 from the study of some 13,000 arrival times of 562 local shallow earthquakes. By applying an inversion method, the depth distribution of the Conrad and Moho discontinuities beneath the whole of the Japan Islands are derived, with an estimated standard error of km over most of Japan territory. Our Figs. 3 and 4 are derived from Fig. 6 of Ref. Zhao:1992 . This allows distinguishing two layers in the crust: an upper crust extending down to the Conrad and a lower part down to the Moho discontinuity.
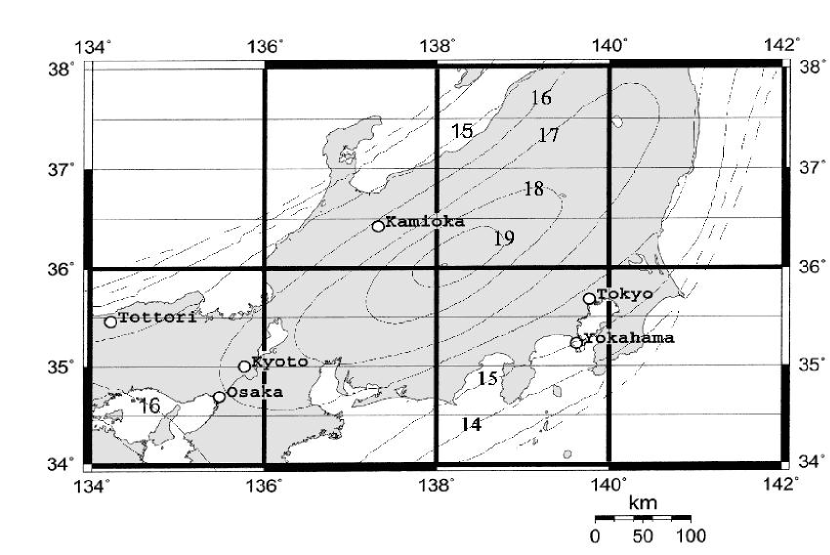
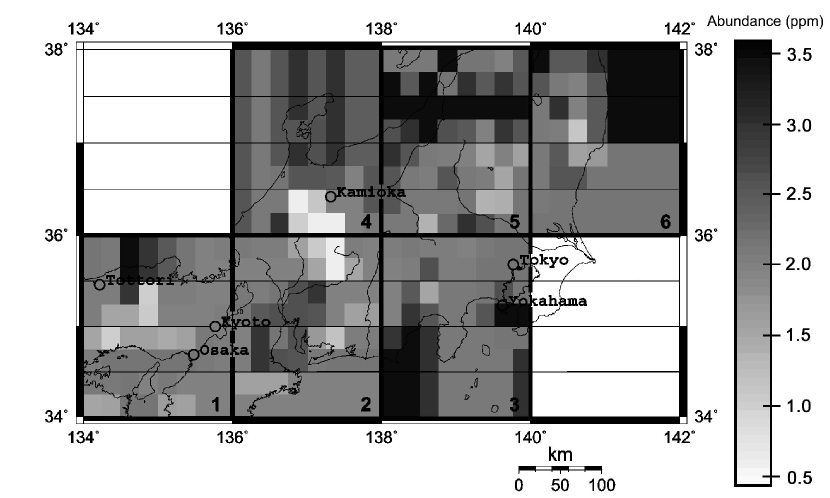
The upper-crust chemical composition of Japan Islands has been studied in Ref. Togashi:2000 , based on 166 representative specimens, which can be associated with 37 geological groups based on ages, lithologies and provinces. By combining the base geological map of Fig. 2 of Ref. Togashi:2000 — which distinguishes 10 geological classes — with the abundances reported in Table 1 of the same paper, one can build a map of Uranium abundance in the upper crust, under the important assumption that the composition of the whole upper crust is the same as that inferred in Ref. Togashi:2000 from the study of the exposed portion, see Fig. 5.
We are not aware of a specific study of the lower part of the Japan crust, however, it is well known that there are similarities between the composition of the Japanese crust and that of the Sino-Korean block. In an extensive compositional study of East China crust Gao:1998 , the Uranium abundance in the lower part is estimated between 0.63 and 1.08 ppm. On these grounds we shall take for the abundance in the lower crust of Japan:
| (5) |
We remark that the estimated range of abundances for East China is substantially narrower than the range for the whole world, which is (0.2-1.1) ppm (see Table II in Ref. Mantovani:2003yd ), this last interval presumably reflecting regional differences in the lower crust composition.
Concerning the vertical distribution of abundances in the crust, it is presently impossible to have information on the chemical composition on a scale smaller than the Conrad depth, generally lying at about 20 km. We also note that the sampling density for the study of the upper crust in the region near Kamioka is about one specimen per 400 km2. On these grounds, we introduce a grid where one assigns a specific abundance to cells with size , i.e., with a linear scale of about 20 km. Within each cell, the depth of the upper and lower crust are taken from Ref. Zhao:1992 , Uranium abundance for the upper crust is derived from Ref. Togashi:2000 and for the lower crust from Ref. Gao:1998 . In this way each of the six tiles near Kamioka is subdivided into sixty-four cells.
Just for the sake of computing flux and signal, each cell is further subdivided into many subcells with abundance derived from those of the parent cell. The angle-integrated produced flux at distance from a subcell of volume , calculated as that from a sphere with radius , is
| (6) |
where is the specific activity (number of neutrinos produced per unit time and volume). Each subcell provides a contribution to the signal rate given by:
| (7) |
where is the number of free protons in the target, is the cross section of reaction in Eq. (1), is the survival probability which we shall calculate for and eV2 Araki:2004mb . The average is over the energy spectrum of the neutrinos from Uranium decay chain.
The resulting signal is obtained by adding the contributions of all subcells and will be expressed in Terrestrial Neutrino Units (TNU), where 1 TNU corresponds to 1 event per year and per protons. The contributions to the produced flux and to the signal from the six tiles are:
| (8a) | |||||
| (8b) | |||||
With respect to our previous estimate from the whole globe Mantovani:2003yd , giving cm-2 s-1 and TNU for , we find that the six tiles contribute 43% of the flux and 45% of the signal: this justifies the close scrutiny of the region within the six tiles. Some 3/4 of the contribution arises form the upper crust.
In more detail, the tile hosting Kamioka generates 29% and 30% of the total produced flux and signal, respectively. The host cell, i.e., the cell where Kamioka is located, contributes 9% to the total produced flux.
The Uranium mass contained in the six tiles is about kg, really negligible (less then 0.05%) with respect to that estimated for the whole Earth.
We have considered several sources of the uncertainties affecting this estimate, see Table 3:
(i) Measurement errors of the chemical analysis. The standard error of the Uranium abundance measurements in the individual samples is 3-4% Togashi:2000 . We translated this error into a global uncertainty (correspondingly to about ) on the Uranium abundance in the upper crust for the six tiles 333This choice is very conservative given our lack of information on the correlation between the errors of the 166 samples: the errors should partially average out and result in a total error between 12% and ..
(ii) Discretization of the upper crust. As mentioned above, we divided the crust into cells, assigning specific abundances to each cell. This discretization procedure introduces some uncertainty, which is especially important in the region very close to the detector. We have evaluated the effect of replacing the abundance of the host cell with those of adjacent cells. This produces signal variations in the interval TNU. For simplicity, we introduce a symmetrical error such as to encompass the extreme values.
(iii) Chemical composition of the lower crust. The error is taken as the half-difference between signals obtained for the extreme values of the estimated Uranium abundances in the lower crust.
(iv) Crustal depth. Since the depths of the Conrad and the Moho discontinuities are estimated with an accuracy of about km, we have evaluated the effect of such (global) variations over the six tiles, the error being again estimated as the half difference between extreme values of flux/signal.
| Source | (TNU) | Remarks |
|---|---|---|
| Composition of upper-crust samples | 0.96 | error |
| Upper-crust discretizaion | 1.68 | |
| Lower-crust composition | 0.82 | Full range |
| Crustal depths | 0.72 | error |
| Subducting slab | 2.10 | Full range |
| Japan Sea | 0.31 | Full Range |
| Total | 3.07 |
III.2 The effect of the subducting slab beneath Japan
The Japan arc, at the crossing among the Eurasian, Philippine and Pacific plates, is the theater of important subduction processes. The Philippine plate is moving towards the Eurasia plate at about 40 mm/yr and is subducting beneath the southern part of Japan. The Pacific Plate is moving in roughly the same direction at about 80 mm/yr and is subducting beneath the northern half of Japan.
We shall model these processes as a single slab penetrating below Japan with velocity mm/yr, the average of the two plates. This process has been occurring on a time scale y, during which the front has advanced by km.
We assume that the slab brings with it a sediments layer (with density ton/m3, depth m and Uranium abundance ppm, according to the data for the Japan trench Plank:1998 ) on top of an oceanic crust layer, with density ton/m3, vertical extension km, and Uranium abundance ppm.
The amount of Uranium carried by the slab per unit surface is thus:
| (9) |
We observe that the corresponding quantity for the lower continental crust of Japan (density ton/m3, average depth km, and Uranium abundance ppm) is:
| (10) |
In order to estimate the effect of the subducting slab on geo-neutrino production, one can envisage two extreme cases:
(a) one assumes that the slab keeps its trace elements while subducting. The effect of its presence can be estimated as if the lower crust is effectively enriched by the amount of Uranium contained in the crustal part of the slab passing below it, i.e., , a negligible effect in comparison with the 25% uncertainty on resulting from ppm. The signal is increased by 0.2 TNU.
(b) At the other extreme, it is possible that, as the slab advances, all Uranium from the subducting crust is dissolved in fluids during dehydration reactions and accumulates in the lower part of the continental crust of Japan, thus strongly enriching it. The release process — to a first approximation — will be uniform along the subduction direction, for some distance km corresponding to the dimension of the Japan arc transverse to the trench. Since the slab has advanced by km, the abundance increase in the lower crust is now:
| (11) |
This corresponds to a substantial increase of the effective Uranium abundance in the Japanese lower continental crust. The signal contributed from the lower crust of Japan increases by 4.4 TNU.
As we have no argument for deciding which of the extreme cases (a) or (b) is closer to reality and in order to encompass both of them, we estimate the contribution from the subducting slab as:
| (12) |
III.3 The crust below the Japan Sea
The morphology of the Japan Sea, characterized by three major basins (Japan, Yamato, and Ulleung Basins) and topographic highs such as the Yamato Ridge, is suggestive of intricate back-arc opening tectonics. Based on seismic reflection/refraction survey data, bottom sampling data, geomagnetic data and basement depth and topography, Tamaki et al. Tamaki:1992 distinguish four crustal types: continental, rifted continental, extended continental, and oceanic crust. The Japan basin is generally considered as oceanic, whereas the nature of other basins is controversial and debated. Again, we resort to two extreme models:
(a) following Ref. mappa we consider all the basins as formed with oceanic crust, extending down to 7 km below 1 km of sediments. This provides a model for minimal geo-neutrino production, resulting in TNU.
(b) Deeper crustal depths (up to 19 km for the Oki bank) and thicker sediments layers (up to 4 km for the Ulleung basin) are reported in the literature, see Table 4. By taking these values and assigning the abundances typical of continental crust, we maximize geo-neutrino production, with the result TNU.
In between (a) and (b), and in order to encompass the extreme values, we fix the contribution to the signal from the Japan Sea as:
| (13) |
| YB | OK | UB | |
|---|---|---|---|
| sediments | 1.2 | 0.3 | 4 |
| upper | 2.8 | 8.7 | 2 |
| lower | 8.5 | 10.5 | 8 |
III.4 Summary of the regional contribution
The regional contribution to the signal can be determined by adding the previous results. As the errors are independent, we combine them in quadrature, obtaining:
| (14) |
The principal uncertainty comes from the effect of the subducting slab. A more detailed study of the mechanisms of Uranium release should exclude the extreme cases which we have considered, thus reducing the error.
Discretization of the crust is major uncertainty. A more detailed description of the exposed crust is certainly achievable, however, it will bring little help without a better understanding of the chemical composition variation with depth.
IV The rest of the world
The contribution from the rest of the world will depend on the total mass of Uranium as well as on its distribution inside the Earth, since the closer is the source to the detector the larger is its contribution to the signal. For each value of , we shall construct the distributions which provide the maximal and minimal signals under the condition that they are consistent with geochemical and geophysical information on the globe.
For the Earth’s crust, we use the map of Ref. mappa distinguishing several crustal layers which are known to contain different amounts of radioactive elements. For each layer minimal and maximal estimates of Uranium abundances found in the literature are adopted, so as to obtain a range of acceptable fluxes, see Table 5.
| min | max | |
|---|---|---|
| upper crust | 2.2 | 2.8 |
| lower crust | 0.2 | 1.1 |
Depending on the adopted values, the Uranium mass in the crust is the range in units — here and in the following — of kg. Clearly the larger is the mass the bigger is the signal, the extreme values being 444As we are now considering distances from the detector which are considerably larger than the neutrino oscillation length, the asymptotic expression for the survival probability, holds, so that the produced flux and signal are directly proportional, Fiorentini:2003ww .:
| (15) |
Concerning Uranium in the mantle, we assume that spherical symmetry holds and that the Uranium mass abundance is a non-decreasing function of depth. It follows that, for a fixed Uranium mass in the mantle , the extreme predictions for the signal are obtained by: (i) placing Uranium in a thin layer at the bottom and (ii) distributing it with uniform abundance over the mantle. These two cases give, respectively:
| (16) |
By using again the proximity argument, we can combine the contributions from crust and mantle so as to obtain extreme predictions: for a fixed total , the highest signal is obtained by assigning to the crust as much material as consistent with observational data () and putting the rest, , in the mantle with a uniform distribution. Similarly, the minimal flux/signal is obtained for the minimal mass in the crust () and the rest in a thin layer at the bottom of the mantle. In conclusion, the contribution from the rest of the world is in the range:
| (17) |
Note that the two straight lines cross near , i.e., in the nonphysical region, since Uranium mass is at least 0.3.
We remind that that both the Uranium poor () and the Uranium rich () crust models are observationally acceptable. We also recall that a compositionally uniform mantle is advocated by geophysicists, whereas geochemists prefer a two-layered mantle with a lower part close to the primitive composition and an upper part strongly impoverished in Uranium. In other words, it seems to us that the extreme predictions correspond to equally plausible models. On these grounds, we take as our prediction the mean of the extremes and assign an error so as to encompass both of them:
| (18) |
We remark that by combining global mass balance with geometry, we have strongly constrained the contribution from the rest of the world: for a mass near the BSE values, , the signal is predicted within about 10%.
V The geo-neutrino signal as a function of Uranium mass in the Earth
By combining the regional contribution, Eq. (14), with that from the rest of the world, Eq. (18), we get the Uranium geo-neutrino signal as a function of Uranium mass in the Earth:
| (19a) | |||||
| where: | |||||
| (19b) | |||||
| (19c) | |||||
This error is obtained by combining in quadrature all geochemical and geophysical uncertainties discussed in the preceding paragraphs. All of them have been estimated so as to cover intervals of experimental measurements and total ranges of theoretical predictions.
However, this error does not account for present uncertainties on neutrino oscillation parameters and on the cross section of reaction in Eq. (1). For the sake of discussing the potential of geo-neutrinos, we shall ignore for the moment these error sources.
The expected signal from Uranium geo-neutrinos at KamLAND is presented as a function of the total Uranium mass in Fig. 1. The upper horizontal scale indicates the corresponding radiogenic heat production rate from Uranium ().
The predicted signal as a function of is between the two lines denoted as and , which correspond, respectively, to .
Since the minimal amount of Uranium in the Earth is kg (corresponding to the minimal estimate for the crust and the assumption of negligible amount in the mantle), we expect a signal of at least 19 TNU. On the other hand, the maximal amount of Uranium tolerated by Earth’s energetics 555For an Uranium mass kg and relative abundances as in Eq. (4), the present radiogenic heat production rate from U, Th and K decays equals the maximal estimate for the present heat flow from Earth, TW Pollack:1993 ., kg, implies a signal not exceeding 49 TNU.
For the central value of the BSE model, kg, we predict TNU, i.e., with an accuracy of 12% at “”. We remark that estimates by different authors for the Uranium mass within the BSE are all between kg. This implies that the Uranium signal has to be in the interval TNU. The measurement of geo-neutrinos can thus provide a direct test of an important geochemical paradigm.
The effect of uncertainties about the oscillation parameters is presented in Table 6. In this respect the mixing angle is most important. Figure 4 (b) of Ref. Araki:2004mb shows a range (central value 0.40): the corresponding range for the average survival probability is (central value 0.59), with a relative error on the signal , which is comparable to the geological uncertainty in Eq. (19c). The mixing angle should be determined more precisely for fully exploiting the geo-neutrino signal.
| parameter | signal variation |
|---|---|
| eV2 | TNU |
| eV2 | TNU |
On the other hand, the predicted signal is practically unaffected by the uncertainty on the neutrinos squared mass difference : when this is varied within its interval the signal changes by 0.1 TNU. This holds for any value of the total Uranium mass , since the precise value of only matters in the region near the detector. In addition, we observe that the predictions computed for the best value ( eV2) and for the limit differ by +0.3 TNU. Finally, the error on the inverse-beta cross section (quoted as 0.2% at in Ref. Eguchi:2002dm ) translates into a uncertainty of 0.6% on the signal.
VI Concluding remarks
We summarize here the main points of this paper:
(1) Based on a detailed geochemical and geophysical study of the region near Kamioka, we have determined the regional contribution to the signal from Uranium-geoneutrinos:
| (20) |
(2) By using global mass balance arguments, we have determined the contribution from the rest of the world:
| (21) |
where is the Uranium mass in the Earth, in units of kg.
(3) Our prediction for the signal as a function of is presented in Fig. 1, which shows the potential of geo-neutrinos for determining how much Uranium is in the Earth (As discussed in the paper, the range of the prediction for a given mass is mostly due to experimental determinations of local abundances and to the geometrical distributions of trace elements in the mantle).
(4) Measurements of the antineutrino signal from Uranium can provide crucial tests for models. In particular, estimates by different authors for the Uranium mass within the important paradigm of the Bulk Silicate Earth are all in the range kg, which translates into a signal TNU.
(5) A full exploitation of the geo-neutrino signal demands that the mixing angle is determined more precisely.
Acknowledgments
We are particularly grateful to Enomoto Sanshiro for useful discussions and for pointing to our attention Refs. Zhao:1992 and Togashi:2000 . We thank M. Contorti, K. Inoue, and E. Lisi for valuable comments. The final manuscript includes several useful remarks by the anonymous referees.
This work was partially supported by MIUR (Ministero dell’Istruzione, dell’Università e della Ricerca) under MIUR-PRIN-2003 project “Theoretical Physics of the Nucleus and the Many-Body Systems” and MIUR-PRIN-2004 project “Astroparticle physics”.
Note added in Proofs
The KamLAND collaboration has just presented experimental results Araki:2005qa on geo-neutrinos, which are in agreement with our predictions, see Ref. Fiorentini:2005ma for a comparison.
References
- (1) G. Eder, Nucl. Phys. 78, 657 (1966).
- (2) G. Marx, Czech. J. Phys. B 19, 1471-1479 (1969).
- (3) L. M. Krauss, S. L. Glashow, and D. N. Schramm, Nature (London) 310, 191 (1984).
- (4) M. Kobayashi and Y. Fukao, Geophysical Research Lett. 18, 633-636 (1991).
- (5) R. S. Raghavan, S. Schönert, S. Enomoto, J. Shirai, F. Suekane, and A. Suzuki, Phys. Rev. Lett. 80, 635 (1998).
- (6) C. G. Rothschild, M. C. Chen, and F. P. Calaprice, Geophy. Res. Lett. 25, 1083 (1998) [arXiv:nucl-ex/9710001].
- (7) G. Fiorentini, F. Mantovani, and B. Ricci, Phys. Lett. B 557, 139 (2003) [arXiv:nucl-ex/0212008].
- (8) G. Fiorentini, T. Lasserre, M. Lissia, B. Ricci, and S. Schönert, Phys. Lett. B 558, 15 (2003) [arXiv:hep-ph/0301042].
- (9) F. Mantovani, L. Carmignani, G. Fiorentini and M. Lissia, Phys. Rev. D 69, 013001 (2004) [arXiv:hep-ph/0309013].
- (10) G. Fiorentini, M. Lissia, F. Mantovani and R. Vannucci, arXiv:hep-ph/0409152.
- (11) G. Fiorentini, M. Lissia, F. Mantovani and R. Vannucci, Astroparticle and high energy physics AHEP2003/035 [arXiv:hep-ph/0401085].
- (12) KamLAND Collaboration, K. Eguchi et al., Phys. Rev. Lett. 90, 021802 (2003) [arXiv:hep-ex/0212021].
- (13) H. Nunokawa, W. J. C. Teves and R. Zukanovich Funchal, JHEP 0311, 020 (2003) [arXiv:hep-ph/0308175].
- (14) T. Mitsui [KamLAND Collaboration], Proceedings of the 28th International Cosmic Ray Conferences (ICRC 2003), Tsukuba, Japan, 31 Jul - 7 Aug 2003, pp. 1221-1224.
- (15) L. Miramonti, arXiv:hep-ex/0307029.
- (16) G. Domogatski, V. Kopeikin, L. Mikaelyan and V. Sinev, arXiv:hep-ph/0401221.
- (17) R. D. McKeown and P. Vogel, Phys. Rept. 394, 315 (2004) [arXiv:hep-ph/0402025].
- (18) B. D. Fields and K. A. Hochmuth, arXiv:hep-ph/0406001.
- (19) V. D. Rusov, V. N. Pavlovich, V. N. Vaschenko, V. A. Tarasov, D. A. Litvinov, V. N. Bolshakov and E. N. Khotyaintseva, arXiv:hep-ph/0312296.
- (20) G. L. Fogli, E. Lisi, A. Palazzo and A. M. Rotunno, arXiv:hep-ph/0405139.
- (21) G. Domogatski, V. Kopeikin, L. Mikaelyan and V. Sinev, arXiv:hep-ph/0409069.
- (22) H. N. Pollack, S. J. Hunter and J. R. Johnson, Rev. Geophys. 31, 267-280 (1993).
- (23) D. Anderson, Energetics of the Earth and the Missing Heat Source Mystery, available at www.mantleplumes.org/Energetics.html
- (24) A. M. Hofmeister and R. E.Criss, Tectonophysics 395, 159–177 (2005).
- (25) C. Bassin, G. Laske. and G. Masters, EOS Trans. Am. Geophys. Union 81, F897 (2000) [http://mahi.ucsd.edu/Gabi/rem.html].
- (26) W. F. McDonough, Compositional Model for The Earth’s Core, pp. 547-568. In The Mantle and Core (ed. R.W. Carlson.) Vol. 2 Treatise on Geochemistry (eds. H.D. Holland and K.K. Turekian), Elsevier-Pergamon, Oxford (2003).
- (27) D. Zhao, S. Horiuchi and A. Hasegawa, Tectonophysics 212, 289-301 (1992).
- (28) S. Togashi, et al., Geochem. Geophys. Geosyst. (Electronic Journal of the Earth Sciences) 1, 2000GC00083 (2000).
- (29) S. Gao, et al., Geochimica et Cosmochimica Acta 62, 1959-1975 (1998).
- (30) T. Araki et al. [KamLAND Collaboration], arXiv:hep-ex/0406035.
- (31) T. Plank and C. H. Langmuir, Chemical geology 145, 325-394 (1998).
- (32) K. Tamaki, K. Suyehiro, J. Allan, J.‘C. Ingle, and K. A. Pisciotto, in Proc. ODP, Sci. Results, edited by K. Tamaki, K. Suyehiro, J. Allan, M. McWilliams, et al., 127/128, 1333-1348, College Station, TX (Ocean Drilling TAMU), (1992).
- (33) T. Araki et al. [KamLAND Collaboration], Nature 436, 499 (2005).
- (34) G. Fiorentini, M. Lissia, F. Mantovani and B. Ricci, arXiv:hep-ph/0508048.