H1 QCD analysis of inclusive cross section data
Abstract
This contribution reviews the QCD analysis of the H1 inclusive DIS data. Flavor separated parton densities are extracted in a NLO QCD fit using neutral and charged current HERA I data. The results of a dedicated QCD analysis of the gluon and are also reviewed.
At leading order in the electroweak interaction, the double differential cross section of inclusive Deep Inelastic Scattering (DIS) can be expressed in terms of structure functions
| (1) |
for Neutral Currents (NC) where , and similarly for Charged Current (CC)
| (2) |
where the structure functions exhibit a dependency upon the incoming lepton charge. The QCD factorization theorem allows the separation of the long distance physics and the short distance physics, such that the structure functions can be expressed as convolutions of universal parton distributions (pdfs) and perturbatively computable kernels. The QCD analysis (the so-called “QCD fits”) aims at extracting the pdfs through the QCD evolution. It is also possible to extract any parameter entering in the expression of the cross section, such as the strong coupling constant .
1 The H1 inclusive cross section measurement
The published H1 data from the HERA I data taking covers a large range in and . The inclusive NC DIS cross sections are measured to an accuracy of 1–2 % for statistical uncertainty and 2–3 % of systematic uncertainty. This gives a stringent constraint on over the low and medium regions. Large and data are sensitive to the valence densities, but further statistics are needed to fully exploit this constraint. The wide range covered allow to constraint from scaling violations. For the inclusive CC cross section, constant progress in understanding the detectors helped to reduce the systematic uncertainties to about 6 % but the data are still limited by the statistical error at large and . One can define a reduced CC cross section
| (3) |
which reads at the lowest order
| (4) |
The measured and provide thus a unique constraint on large for and densities, respectively.
2 QCD analysis and extraction of parton densities
All the H1 high NC and CC data [1, 2, 3] together with the low data [4] are used to extract flavor separated parton densities in a NLO QCD analysis [3] in the so-called massless scheme. The understanding of systematic correlations between the data allows to make reliable error propagation with the Pascaud–Zomer method[5]. To disentangle the different flavors a novel decomposition anzats has been set up which makes use of the flavor combination of the inclusive data: the distributions and which appear in the NC and CC inclusive cross section with the gluon and the charge conjugate are parameterized at input scale GeV2 and evolved. A procedure to explore the parameterization space has been set up and led to a solution with ten free parameters and . As a result of the fit, the distribution precision is 1% for and 7% for . The distribution precision is 3% for and 30% for . Results for the input distributions at GeV2 are shown on Fig. 1.
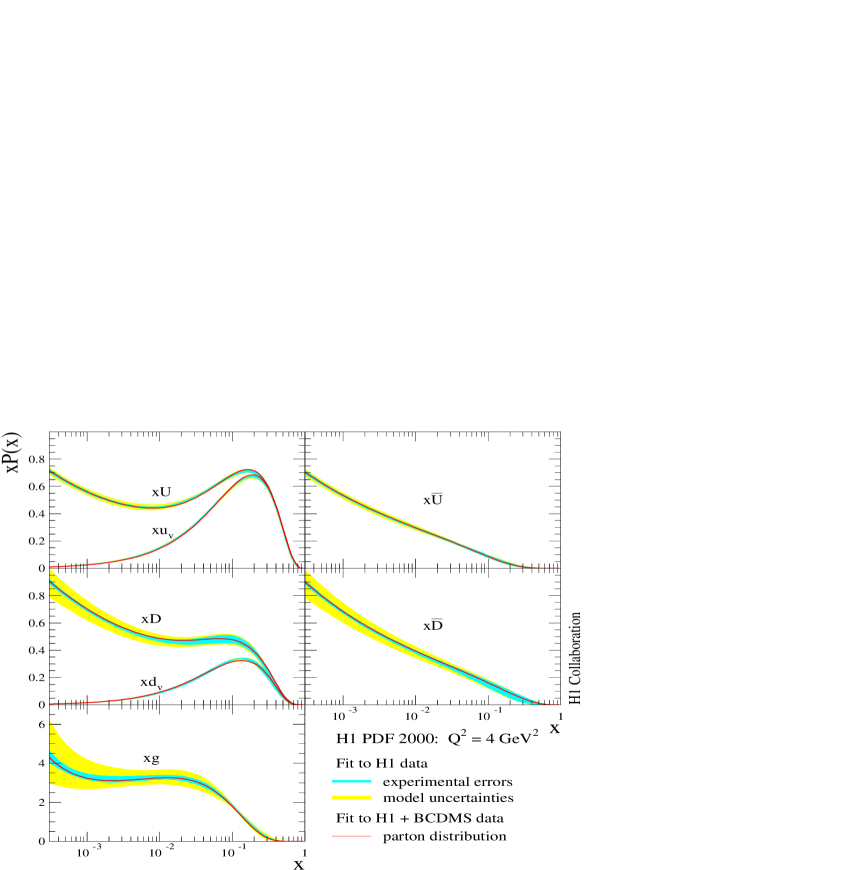
A “model” uncertainty is estimated by variation of the parameters that enters in the modelisation of the QCD analysis, such as the input scale , the strange and charm components of and , the heavy quark thresholds and the strong coupling constant . Further detail about the analysis can be found in [3].
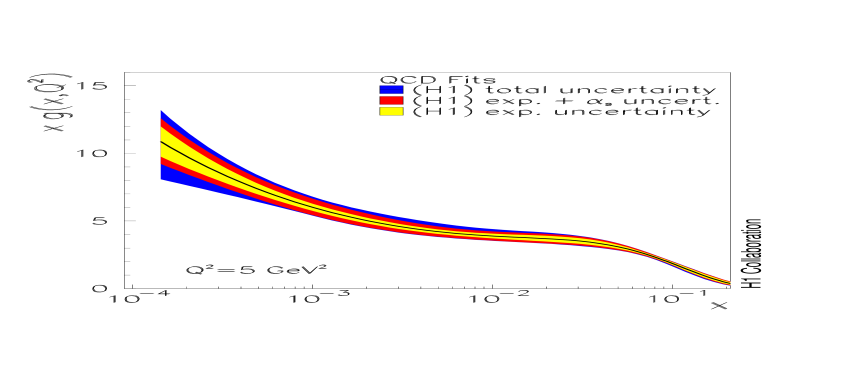
3 Determination of the gluon and
Another QCD analysis [4] dedicated to the determination of the strong coupling constant and the gluon density was performed in a NLO massive scheme using the H1 low 96–97 data [4], the 94–97 high data [1] and the BCDMS DIS data [6]. The results are shown on Fig. 2.
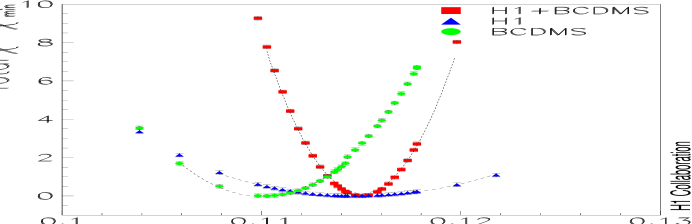
The result is where the theoretical error corresponds to variations of the renormalisation and factorisation scales. The experimental error is small, % and the theoretical error is expected to be reduced by factor of in a NNLO QCD analysis.
4 Conclusion
The determination of flavor separated parton densities form H1 data only and the extraction of the strong coupling and the gluon density are major achievements of the HERA I physics. Further extension to this work – beside the inclusion of HERA II data or a future NNLO analysis – could be an inclusion of jet and/or inclusive heavy flavor production data which provide additional constraints on the medium gluon density.
References
- [1] C. Adloff et al. [H1 Collaboration], Eur. Phys. J. C 13, 609 (2000) [arXiv:hep-ex/9908059].
- [2] C. Adloff et al. [H1 Collaboration], Eur. Phys. J. C 19, 269 (2001) [arXiv:hep-ex/0012052].
- [3] C. Adloff et al. [H1 Collaboration], Eur. Phys. J. C 30 (2003) 1 [arXiv:hep-ex/0304003].
- [4] C. Adloff et al. [H1 Collaboration], Eur. Phys. J. C 21 (2001) 33 [arXiv:hep-ex/0012053].
- [5] C. Pascaud and F. Zomer, LAL 95-05.
- [6] A. C. Benvenuti et al. [BCDMS Collaboration], Phys. Lett. B 223, 485 (1989).