Conditions driving chemical freeze-out
Abstract
We propose the entropy density as the thermodynamic condition driving best the chemical freeze-out in heavy-ion collisions. Taking its value from lattice calculations, we find that it is excellent in reproducing the experimentally estimated freeze-out parameters. The two characteristic endpoints in the freeze-out diagram are reproduced as well.
pacs:
12.40.Ee,12.40.Yx,05.70.Ce1 Introduction
At critical temperature , the hadronic matter is conjectured to dissolve into quark-gluon plasma (QGP). Reducing the QGP temperature disposes hadronization and the interacting system goes into chemical equilibrium and finally the produced particles freeze out. Below , thermal equilibrium takes place and the compositions of matter turn to confine into hadrons. The best way to determine the freeze-out parameters is to combine various particle ratios in order to obtain a window in the diagram compatible with the experimental results. is the baryo-chemical potential. The question we intent to answer is: what is the universal condition describing the freeze-out parameters? [1, 2]
Without energy input the chemical reactions always proceed toward chemical equilibrium, i.e. balancing particle-absorption and -production. To study the consequences of this equilibrium, we recall the equilibrium constant . In a chemical reaction like , can be calculated according to the ”law of mass action” [3, 4]
| (1) |
where and refer to the reactants and products, respectively. and are the corresponding concentrations. In heavy-ion collisions, the decay channels are - in structure - similar to the above chemical reaction. The backward direction can be viewed as annihilation/absorption processes. Analogy to Eq. (1) we deal so far with one specific type of hadron interactions. The hadron system and its approach towards the chemical equilibrium are allowed to have many dynamical processes. The most important ones are particle-absorption and -production. The different mechanisms that drive the system towards the chemical equilibrium are to be taken into consideration by summing over all hadron resonances.
The total free energy of the system can be used to determine the likely direction. When the reactant and product concentrations are given, then for an ideal gas (no enthalpy change), . At equilibrium free energy gets minimum ( vanishes) and pressure is constant. Then . is the difference of free energies of products and reactants at standard state, i.e. at .
| (2) |
At equilibrium, the entropy gets maximum. The change in particle number is minimum. Therefore, the equilibrium constant is mainly influenced by entropy change.
2 Thermodynamic conditions
In the following, we list some thermodynamic expressions for one particle and its anti-particle in Boltzmann limit.
| (3) | |||||
| (4) | |||||
| (5) |
where is the spin-isospin degeneracy factor and are the modified Bessel functions. They will be summed over all resonances taken into account. These quantities are related to the consequences of chemical equilibrium via Eq. (2). In this letter, full quantum statistics has been properly taken into account.
| (6) |
where is the single-particle energy and stand for bosons and fermions, respectively. We apply the hadron resonance gas model (HRGM) [5, 6, 7, 8] in order to study the conditions driving the freeze-out. All observed resonances up to mass GeV are included. The particle decays are entirely left away. We use grand canonical ensemble and full quantum statistics. Corrections due to van der Waals repulsive interactions and the excluded volume have not been taken into account.
Before we report the results, we remind of the two characteristic points of the freeze-out diagram; One at and and the other at and very large . Localizing the first point has been the subject of different experimental studies [11]. It has been found that MeV [12]. The lattice estimation for the deconfinement temperature is MeV [13]. This implies that the deconfinement and freeze-out lines seem to be coincident at low . For the second point, we are left with applying effective models. As , the nucleons in the hadron gas get dominant. Applying Fermi statistics, Eq. 7, we find that the chemical potential corresponding to the normal nuclear density, fm-3 is GeV. This value can slightly be different according to the initial conditions [14].
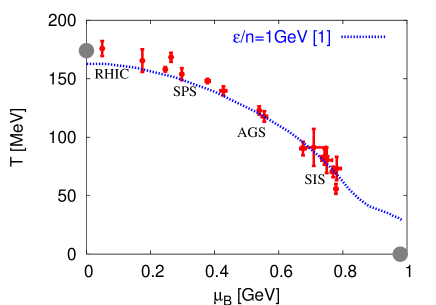
A proposal to describe the freeze-out parameters at different incident energies has been reported in Ref. [2]. The authors started from phenomenological observations at GSI/SIS energy that GeV. They have applied Boltzmann approximations in calculating , Eq. (5), and analytically handled the hadron resonance gas at MeV (GeV), i.e. the freeze-out parameters at GSI/SIS energy, as a Fermi gas of degenerate nucleons, Eq. 7. At high and small , the authors assumed that the pions and rho-mesons get dominant. The baryons are entirely neglected. Applying Eq. (5) with the effective mass they got almost the same value for the ratio [2]. In Fig. 1, we use HRGM in order to map out freeze-out diagram according to this condition. In calculating and , we take into account full quantum statistics and all observed resonances up to mass GeV.
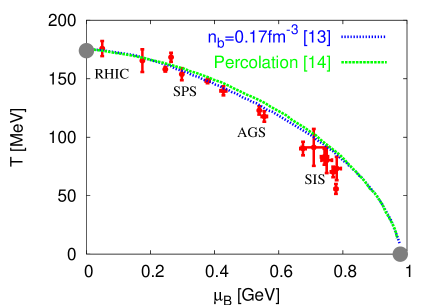
In Ref. [9], total baryon number density was imposed to interpret the chemical freeze-out curve. For this scenario, the baryon-baryon and baryon-meson interactions were assumed to drive the chemical equilibrium. For the value fm-3, two-third the normal nuclear density, it has been argued that it depends on the correction due to van der Waals repulsive interactions. In Fig. 2, we plot HRGM results under the condition fm-3, the normal nuclear density. We use this value, since we entirely leave away all corrections. We find that our results suggest that the assumption of baryon-baryon and baryon-meson and the repulsive interactions are not well-founded. Nevertheless, we find that the value fm-3 is satisfactorily able to reproduce the two endpoints of freeze-out diagram.
Another model we consider is in the framework of percolation theory [10]. At , the freeze-out occurs when the nucleons no longer form interconnected matter. The corresponding density is found to be fm-3 and consequently, GeV. At , it has been found that MeV for [10]. gives the strangeness saturation. The results are shown in Fig. 2.
We can so far conclude that the last two models [9, 10] are able to reproduce the two endpoints. Both apparently overestimate the freeze-out parameters at BNL/AGS and GSI/SIS energies. Model [2] describes well the freeze-out parameters at low energy. It slightly underestimates the parameters at BNL/RHIC and CERN/SPS energies. Its largest discrepancy is at energies lower than GSI/SIS. At GeV, which as given above corresponds to , we find that the freeze-out under the condition GeV occurs at MeV! Furthermore, extrapolating the resulting curve to abscissa results in particle number density . According to Eq. 7, the ratio at and GeV equals GeV.
| (7) |
This relation is valid for fermions and therefore, we drop out the exponent [15].
3 Entropy density at chemical freeze-out
As mentioned above, our condition for chemical equilibrium in heavy-ion collisions is the entropy density, Eq. 2 [4]. For vanishing free energy, the equilibrium entropy gives the amount of energy which can’t be used to produce additional work. In this context, the entropy can be defined as the degree of sharing and spreading the energy inside the system. The way of distributing the energy is not just an average value, but rather the way that controls the chemical equilibrium.
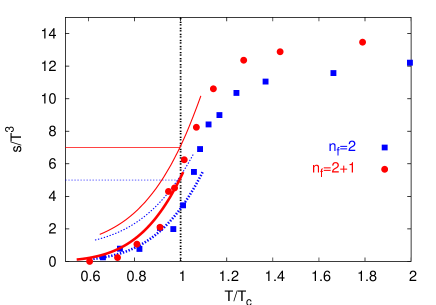
As and , the thermodynamic quantities are given in Eq. (7). In this limit, the entropy density vanishes and HRGM is no longer applicable. At , the system becomes meson-dominant. In this case, the entropy is finite [11, 13]. What is the entropy that characterizes the freeze-out at finite and ? As mentioned above, the deconfinement transition is coincident with the freeze-out at small . We therefore rely on the lattice calculations [5, 6, 7, 16]. In Fig. 3, we plot the lattice results on vs. at [16, 6] for and quark flavors. To compare with the lattice calculations in which very heavy quark masses are used, the resonance masses have to be re-scaled to values heavier than the physical ones [5, 6]. The results with the physical masses are given by the thin curves. The two horizontal lines point at the value of at corresponding . For physical masses, we find that for and for . The normalization with respect to should not be connected with massless ideal gas. Either the resonances in HRGM or the quarks on lattice are massive.
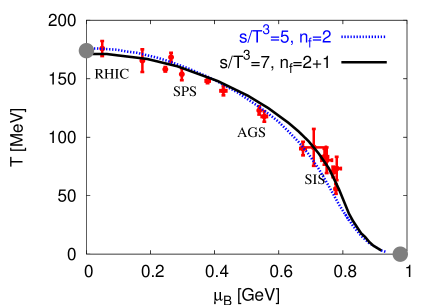
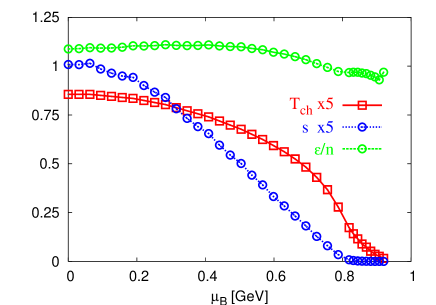
At given , we calculate according to constant . The results are plotted in Fig. 4. The dotted curve represents results, (). The solid curve gives results, (). We find that the characteristic endpoints as well as all experimentally estimated freeze-out parameters are very well reproduced. Comparing with Fig. 1 and Fig. 2, one finds that our results fit best freeze-out parameters. In Fig. 5, we plot , and in dependence on along the freeze-out curve. We notice that as increases, both and decrease, too. We also find that decreases much faster than . The ratio becomes greater than at very large . In this limit, HRGM is no longer applicable and the numerics terminates. At very large , thermal entropy is expected to vanish, since it becomes proportional to (third law of thermodynamics). The quantum entropy [17, 18, 19, 20, 21, 22] is entirely disregarded here. We also find that does not seem to remain constant along the freeze-out curve as assumed in [2]. Since HRGM is not applicable in the limit , we apply Fermi statistics, Eq. 7, as given above.
4 Conclusion
We reviewed the conditions suggested to describe the freeze-out parameters. We used HRGM in order to map out the freeze-out curve according to these conditions. Full quantum statistics has been properly taken into account. We compared the results of the models proposed and check their abilities in reproducing the experimentally estimated freeze-out parameters and the characteristic endpoints (Fig. 1 and Fig. 2). We found that there are different constraints in reproducing the endpoints and fitting the parameters.
We proposed the entropy density as the thermodynamic condition driving
the chemical freeze-out, Eq. 2. Taking its value from
lattice QCD simulations at and assuming that normalized to
remains constant in the entire -axis, we obtained the results
shown in Fig. 4. The freeze-out parameters
and are very well described under this condition. The two
characteristic endpoints are also reproduced.
We conclude that the given ratio characterizes very
well the final states observed in all heavy-ion experiments. Increasing
the incident energy leads to increasing particle yields. The
production rates of particles decrease exponentially with their
masses. This phenomenological observations are regarded in the way, that
increasing energy/temperature is considered by including heavy
resonances. Changing energy with changing particle number is given by
chemical potential . The amount of energy which produces no
additional work, i.e. vanishing free energy, is the entropy at chemical
equilibrium.
I thank Rudolf Baier, Tamas Biro, Rajiv Gavai, Krzysztof Redlich and Helmut Satz for useful discussions.
References
- [1] P. Braun-Munzinger and J. Stachel, Nucl. Phys. A606, 320 (1996), nucl-th/9606017.
- [2] J. Cleymans and K. Redlich, Phys. Rev. C60, 054908 (1999), nucl-th/9903063.
- [3] C. Greiner, P. Koch-Steinheimer, F. M. Liu, I. A. Shovkovy, and H. Stoecker (2004), hep-ph/0412095.
- [4] A. Tawfik, J. Phys. G (2004), hep-ph/0410329.
- [5] F. Karsch, K. Redlich, and A. Tawfik, Eur. Phys. J. C29, 549 (2003a), hep-ph/0303108.
- [6] F. Karsch, K. Redlich, and A. Tawfik, Phys. Lett. B571, 67 (2003b), hep-ph/0306208.
- [7] K. Redlich, F. Karsch, and A. Tawfik, J. Phys. G30, S1271 (2004), nucl-th/0404009.
- [8] A. Tawfik, Phys. Rev. D71, 054502 (2005), hep-ph/0412336.
- [9] P. Braun-Munzinger and J. Stachel, J. Phys. G28, 1971 (2002), nucl-th/0112051.
- [10] V. Magas and H. Satz, Eur. Phys. J. C32, 115 (2003), hep-ph/0308155.
- [11] F. Becattini, Nucl. Phys. A702, 336 (2002), hep-ph/0206203.
- [12] P. Braun-Munzinger, J. Stachel, and C. Wetterich, Phys. Lett. B596, 61 (2004), nucl-th/0311005.
- [13] F. Karsch, Lect. Notes Phys. 583, 209 (2002), hep-lat/0106019.
- [14] E. S. Fraga, Y. Hatta, R. D. Pisarski, and J. Schaffner-Bielich (2003), nucl-th/0301062.
- [15] J. Cleymans, R. V. Gavai, and E. Suhonen, Phys. Rept. 130, 217 (1986).
- [16] F. Karsch, E. Laermann, and A. Peikert, Nucl. Phys. B605, 579 (2001), hep-lat/0012023.
- [17] D. E. Miller and A. Tawfik (2003a), hep-ph/0308192.
- [18] D. E. Miller and A. Tawfik (2003b), hep-ph/0309139.
- [19] D. E. Miller and A. Tawfik (2003c), hep-ph/0312368.
- [20] D. E. Miller and A. Tawfik, J. Phys. G30, 731 (2004a), hep-ph/0402296.
- [21] S. Hamieh and A. Tawfik, Acta Phys. Polon. B36, 801 (2005), hep-ph/0404246.
- [22] D. E. Miller and A. Tawfik, Acta Phys. Polon. B35, 2165 (2004b), hep-ph/0405175.