BI-TP 2004/31
The influence of strange quarks on QCD phase diagram and chemical
freeze-out:
Results from the hadron resonance gas model
Abstract
We confront the lattice results on QCD phase diagram for two and three flavors with the hadron resonance gas model. Taking into account the truncations in the Taylor-expansion of energy density done on the lattice at finite chemical potential , we find that the hadron resonance gas model under the condition of constant describes very well the lattice phase diagram. We also calculate the chemical freeze-out curve according to the entropy density . The -values are taken from lattice QCD simulations with two and three flavors. We find that this condition is excellent in reproducing the experimentally estimated parameters of the chemical freeze-out.
1 Introduction
At high temperatures , it is conjectured that the hadrons are dissolved into quark-gluon plasma (QGP). Reducing the temperature, QGP will hadronize. At , the system goes into chemical equilibration, freezing-out. At , thermal equilibration will take place and the matter consists, once again, of non-interacting hadrons.
In this work, we confront the lattice results on QCD phase diagram with the hadron resonance gas model (HRGM) [1, 2]. We study the influence of strange quarks on the location of the phase diagram. To compare with two flavor lattice results, we include in HRGM the non-strange resonances up to mass GeV. For the three flavor results, we include all observed resonances with masses up to GeV. In the Boltzmann limit, the particle number, energy and entropy density for one particle and its anti-particle, respectively, read
| (1) | |||||
| (2) | |||||
| (3) |
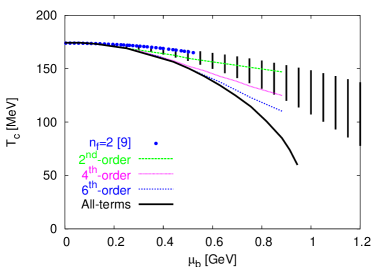
These thermodynamic quantities will be summed over all resonances taken into account. In mapping out the phase diagram, we take advantage of our previous work [1] on simulating for different quark masses and reproducing lattice thermodynamics at zero and finite . We assume that the critical energy density remains constant at all -values. We suppose that this assumption is not affected by the existence of different transitions (Tab. 1). As done on the lattice, we can stop the Taylor-expansion of trigonometric function in Eq. (2) up to certain terms. Taking into account the quantum statistics, the results are drawn in Fig. 2 and Fig. 2.
| [MeV] | Phase transition | |
|---|---|---|
| 270 | first-order | |
| 174 | second-order or crossover | |
| 154 | first-order | |
| 174 | first-order or crossover |
The lattice results at are summarized in Tab. 1. We find that the strange quarks, due to the heavy mass, have small effect on the critical values. At , lattice simulations still suffer from the sign-problem. The fermion determinant gets complex and therefore MC techniques are no longer applicable. However, considerable progress has been made to overcome this problem [3, 4, 5, 6].
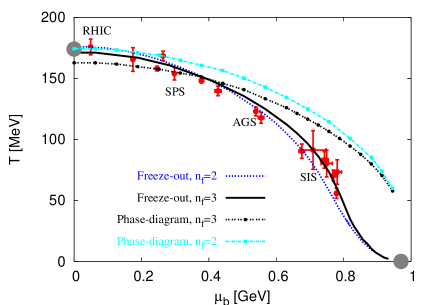
For the chemical freeze-out curve, we compare its experimentally estimated parameters, and , with HRGM results. We propose that the entropy density is the thermodynamic condition which drives the chemical freeze-out. Its value is taken from lattice calculations for different flavors at . The resulting curve is seen in Fig. 3. Apparently, this condition gives excellent agreement with the experimental data and reproduces very well the two characterizing endpoints of the freeze-out curve, (,) and (,).
2 The QCD phase diagram
In lattice calculations, the dependence of on can be determined from the pseudo-critical coupling . is the value at which the susceptibility becomes maximum. From the first non-trivial Taylor coefficients of
| (4) |
and are the temporal lattice dimension and the lattice spacing, respectively. The lattice beta function is needed to get the physical units. The results for two [5] and three flavors [8], respectively, are
| (5) | |||||
| (6) |
where is the quark chemical potential. is the baryo-chemical potential.
In Fig. 2, we plot Eq. (5) as vertical lines. To compare with two flavor lattice results, we entirely exclude the strange hadron resonances. The curves give the results obtained from different truncations in the Taylor-expansion of , Eq. (2). The three flavor results are shown in Fig. 2. Here, we explicitly set the strange quark chemical potential , as the case in the lattice calculations. An extensive discussion about the dependence of on and is given in Ref. [2].
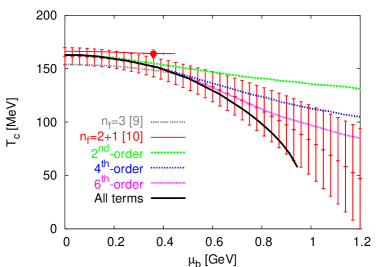
We also show the latest lattice calculations of the critical endpoint. According to Ref. [10], it is located at MeV and MeV. In Ref. [11], it has been found that MeV. The -coordinate has not yet been calculated. We assume that the critical endpoint, at which the phase transition is second-order, does not affect our results.
3 The chemical freeze-out
As discussed in Ref. [12], the entropy density is the thermodynamic condition which guarantees chemical equilibration between reactants and products. To prove this, we recall the theoretical chemistry. Without energy input the chemical reactions always proceed toward equilibrium. The equilibrium constant is related to the energy difference between reactants and products via Boltzmann factor, . From second law of thermodynamics, . is the free energy difference between reactants and products. It represents the total work in the reacting system. At equilibrium, and, therefore,
| (7) |
The entropy gives the amount of energy which can’t be used to produce further work. Then, the equilibrium entropy reads
| (8) |
In literature, there are different models [13, 14, 15] for the freeze-out conditions. Cleymans and Redlich [13] assumed that depends on some average energy per hadron particle. This apparently ignores the change in the baryon number with increasing . Braun-Munzinger and Stachel [14] rectified this and assumed that the freeze-out is given by a constant baryon number density (compare this with Eq. (7)). The two models in Ref. [14, 15] give identical results. As we show in Ref. [12], there are some discrepancies in reproducing the experimental data by all these models.
We calculate the freeze-out curve according to Eq. (3). In this context, the entropy can be seen as a measure for the degree of sharing and spreading the energy inside the system. The way of distributing the energy is not just an average value. But the method that controls the chemical equilibration. i.e., produces no additional work. This is the equilibrium entropy, Eq. (8).
As and , it is assumed that the system is just a degenerate Fermi gas of nucleons. Then from Eq. (3), . At and , the system becomes degenerate Bose gas of pions and rho-mesons. Therefore, gets a finite-value. In the intermediate region, along the freeze-out curve, ranges between these two extreme limits.
At small , it is supposed that the freeze-out and phase transition are coincident. We can therefore use the lattice calculations [2, 7, 1]; for and for . The normalization with respect to should not be connected with the massless ideal gas. Either the hadrons in HRGM or quarks on lattice are massive. The constant ratio obviously fulfills Eq. (8) and simultaneously obeys the third law of thermodynamics. The quantum entropy [16] is not included here. On the other hand, assignment to a constant value and numerically solving Eq. (3) with respect to , leads to the excellent results seen in Fig. 3. The two characterizing endpoints and experimental data are very well reproduced. There is almost no difference between including and excluding strange resonances, as long as we use the corresponding -value.
4 Conclusion
We compared between the lattice results on the QCD phase diagram for different flavors and the HRGM results. Taking into account the truncations in the Taylor-expansion of the energy density done on the lattice, we found the condition of constant energy density results in an excellent agreement with all available lattice results. We conclude that the influence of the strange quarks on the location of QCD phase diagram is relatively large at small baryo-chemical potential . At large , there is almost no influence. This conclusion is valid unter the assumption, that the strange quark chemical potential is vanishing.
For mapping out the chemical freeze-out curve, we used the entropy density. Taking its value from lattice simulations with two and three quark flavors at and assuming it remains constant on the entire -axis, we obtain the meaningful results shown in Fig. 3. The experimentally estimated data is seen to be very well described under this condition. The two characterizing endpoints of the chemical freeze-out curve are also reproduced.
References
-
[1]
F. Karsch, K. Redlich and A. Tawfik, Phys. Lett. B 571 67 (2003), Eur. Phys. J. C 29 549 (2003),
K. Redlich, F. Karsch and A. Tawfik, J. Phys. G 30 S1271 (2004). - [2] A. Tawfik, QCD phase diagram: comparison between lattice and hadron resonance gas model calculations, in progress
- [3] S. Fodor and S.D. Katz, Phys. Lett. B 534 87 (2002).
- [4] P. de Forcrand and O. Philipsen, Nucl. Phys. B 642 290 (2002).
- [5] C.R. Allton, et.al., Phys. Rev. D 66 074507 (2002).
- [6] M. D’Elia and M.-P. Lombardo, Phys. Rev. D 67 014505 (2003).
- [7] F. Karsch, E. Laermann and A. Peikert, Nucl. Phys. B 605 579 (2001).
- [8] F. Karsch, et.al., Nucl. Phys. Proc. Suppl. 129 614 (2004).
- [9] P. de Forcrand and O. Philipsen, Nucl. Phys. B 673 170 (2003).
- [10] S. Fodor and S.D. Katz, JHEP, 0404 050 (2004).
- [11] C.R. Allton, et.al., Phys. Rev. D 68 014507 (2003).
- [12] A. Tawfik, On the conditions driving the chemical freeze-out, in progress
- [13] J. Cleymans and K. Redlich, Phys. Rev C, 60 054908 (1999)
- [14] P. Braun-Munzinger and J. Stachel, J. Phys. G 28 1971 (2002)
- [15] V. Magas and H. Satz, Eur. J. Phys. C 32 115 (2003).
-
[16]
D. Miller and A. Tawfik, J. Phys. G 30 731 (2004);
Acta Phys. Polon. B 35 2165 (2004), hep-ph/0308192; hep-ph/0309139; hep-ph/0312368; S. Hamieh and A. Tawfik, hep-ph/0404246.