Wounded nucleon model and Deuteron-Gold collisions at RHIC
Abstract
It is shown that the wounded nucleon model describes very well the recent PHOBOS data on particle production in D-Au collisions at 200 GeV. Contribution to particle production from a single wounded nucleon is determined. A two-component model is formulated and shown to account for most of the important features of the data.
1 Introduction
The model of wounded nucleons, proposed almost 30 years ago [1], shows a remarkable survival capacity: it is still being used in analysis of data [2, 3] and the very concept of a ”wounded” nucleon (called now a ”participant”111According to the definition given in [1], the wounded nucleon is the one which underwent at least one inelastic collision. We stick to this name because we think that the name ”participant” is incorrect: It should rather refer to nucleons which underwent any (either elastic or inelastic) collision. ) became one of the basic tools in description and interpretation of the heavy ion experiments.
In its original form, the model proposes that the particle production in a nucleus-nucleus collision can be represented as a superposition of independent contributions from the wounded nucleons in the projectile and in the target. Consequently, the density of particles in a collision of nuclei of nuclear numbers and is given by
| (1) |
where and are the numbers of the wounded nucleons in and , is the rapidity in the c.m. system of the collision and is a contribution from a single wounded nucleon in . Similarly, is the contribution from a single wounded nucleon in . The model requires
| (2) |
but it will be convenient to keep the more general formalism.
Recently, the pseudorapidity distribution of particles produced in d-Au collisions was measured by PHOBOS and BRAHMS collaborations at RHIC in a wide range of available phase-space and for various centralities [4, 5]. In the present paper we use the wounded nucleon model to analyze the data reported by PHOBOS [4].
We find that the model gives a good description of the data, with the condition (LABEL:ww1) being well satisfied, except at rapidities close to the maximal values. This observation allows us to determine from the data the contribution from a single wounded nucleon.
Two novel features emerge from this analysis. It turns out that (i) is not confined to the hemisphere corresponding to the wounded nucleon in question but rather extends over all available rapidity (except possibly close to the boundary); Moreover, (ii) shows a distinct two-component structure.
We have shown that these observations can be understood in a recently proposed mechanism [6], describing the particle production as a two-step process: (i) multiple colour exchanges between partons from projectile and target, followed by (ii) particle emission from colour sources created in the first step.
In the next section we show that the wounded nucleon model describes correctly the data from PHOBOS [4]. Determination of the contributions and from the wounded nucleons is presented in Section 3 where also their structure is discussed. In Section 4 we discuss a possible explanation of these findings. Our conclusions are listed in the last section.
2 Wounded nucleons in Deuteron-Gold collisions
The most direct way to test the relation (LABEL:w1) is to construct the symmetric and antisymmetric components of the particle density:
| (3) |
In Figures 1 and 2 these two quantities are plotted versus pseudorapidity for various centralities measured in [4]. To compare with the model, we constructed the averages
| (4) |
The model predicts [c.f. (LABEL:w1)]
| (5) |
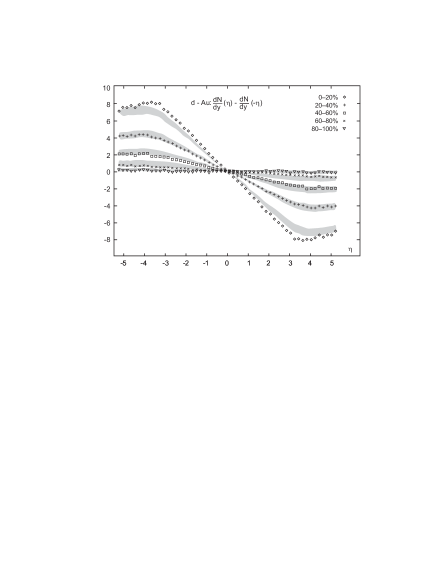
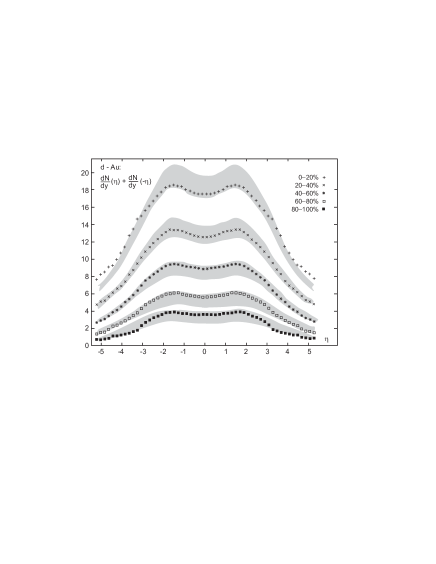
The R.H.S of (LABEL:3w) is shown in Figs 1 and 2 as shaded areas (expressing the inacuracies in determination of and ). One sees that the agreement is rather satisfactory (except in the regions close to the maximal allowed rapidity).
We thus conclude that the model describes correctly the available data.
Using data on nucleon-nucleon collisions another, more demanding, test of the model is possible.
Indeed, one sees immediately from (LABEL:w1) that for the nucleon-nucleon collision we have
| (6) |
and thus for the ratio
| (7) |
one obtains
| (8) |
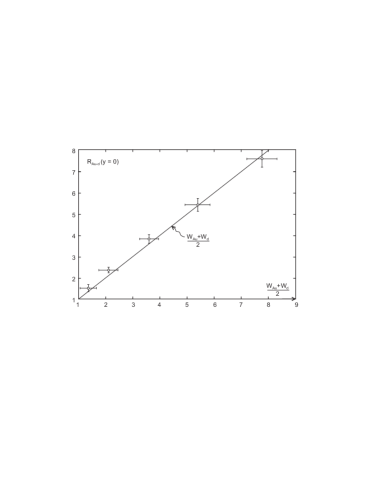
The first immediate consequence is
| (9) |
implying that the value of the ratio at mid-rapidity is fully determined by the number of wounded nucleons and entirely independent of the shape of the function .
Fig. 3 shows plotted versus , as measured by the Phobos collaboration [4]222The numerator of was taken from the numerical data given in [4]. The denominator was read off from the Figure 1b of the same paper.. One sees that the data are indeed in excellent agreement with (LABEL:w5).
The next step is to verify if the model gives an adequate description of data at . To this end we propose to study the quantity
| (10) |
which, according to (LABEL:w1) and (LABEL:w5) should obey
| (11) |
where
| (12) |
In Fig. 4 is plotted for various centralities, as measured in the PHOBOS experiment.
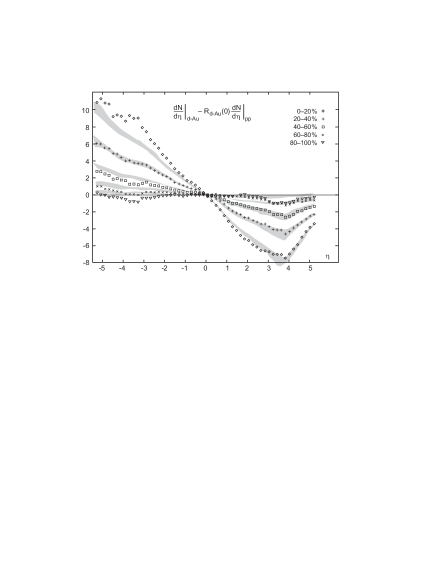
To verify (LABEL:w8) we again construct the “average over centralities”:
| (13) |
where denotes the centrality, as measured by PHOBOS. The product is shown in Fig. 4 as shaded areas. One sees good agreement with the measured values of in the deuteron hemisphere333For maximal centrality, the approximate linear dependence on was observed for already in [3]. We thanks W.Busza for calling our attention to this observations which triggered our interest in the subject.. There are deviations in the Au hemisphere for the most central collisions. They may be either genuine -hitherto unexplained- deviations from the model, or simply represent an additional contribution to particle production from the secondary interactions inside the nucleus. More work is needed to clarify this feature.
3 Particle emission from a single wounded nucleon
From (LABEL:1w) and (LABEL:w1) we deduce that the contribution from a single wounded nucleon can be expressed as
| (14) |
The functions and are shown in Fig. 5.
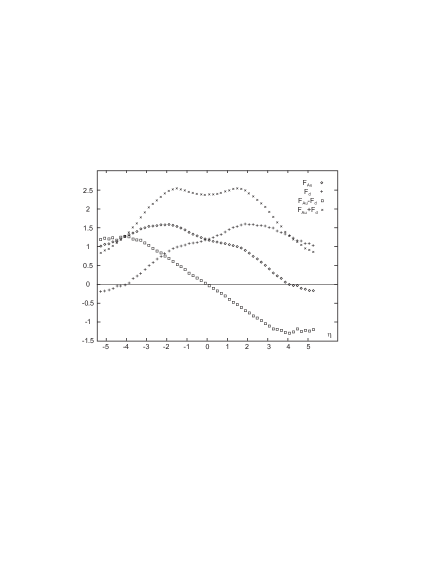
Similarly, using (LABEL:w2) and (LABEL:w9) and taking into account that the symmetry relation (LABEL:ww1) is well satisfied by the data, one can express , in terms of and :
| (15) |
In Fig. 6 and are shown in together with and .
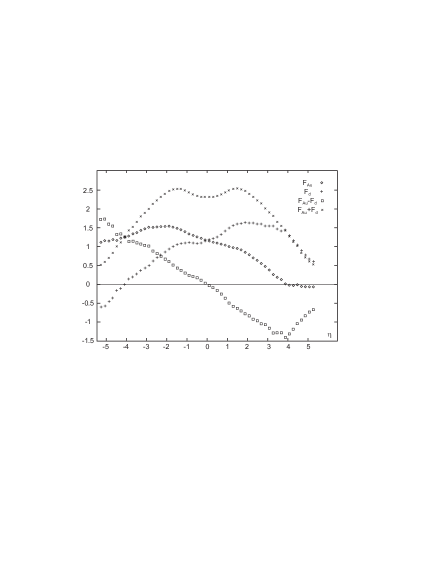
One sees that, except for tiny details, the results of both figures are very similar to each other (if one excludes the regions close to the maximal rapidities). We thus conclude that both methods of analysis lead to the same picture.
Three striking features are to be noted:
(a) One sees that -contrary to naive expectations- the contribution from a wounded nucleon extends far beyond its own hemishere, covering practically the full rapidity interval except about 1.5 units from both ends (where the energy conservation effects and the intranuclear cascade are expected to give corrections to the model in any case) 444One sees explicitely that the model does not work in the fragmentation region, where turns out negative..
(b) Another -hitherto unexpected- observation is the very simple linear dependence on of and of which can be well approximated by a straight line with the slope of about .
(c) There is a dramatic difference between the rapidity dependence of the symmetric and antisymmetric part of .
In the next section will shall discuss the consequences of these observations for the mechanism of particle production.
4 A possible interpretation
The observations made in the previous section allowed us to determine the contribution of one wounded nucleon to particle production. We have thus obtained a qualitatively new information on mechanism of the inelastic nucleon-nucleon collisions. A possible interpretation of this result is presented below.
The striking difference between the measured symmetric and antisymmetric part of , seen in Figs 5 and 6, suggests that (which is the sum of its symmetric and antisymmetric parts) may consists of two components of different origin. A natural possibility is to identify one component with particle emission from the valence part of the nucleon and another one with emission from the gluon cloud.
We thus write
| (16) |
where we qualitatively expect the gluonic contribution to dominate the symmetric part of the spectrum, while its asymmetric part is generated by the valence contribution.
To discuss this concept in more detail, we shall use the model proposed recently in [6], thus accepting that particle production proceeds in two-steps (i) the multi-gluon colour exchanges between partons of the projectile and of the target and (ii) the following emission of particle clusters from colour sources or strings.
To illustrate the consequences of this idea we shall assume that particle emission from a colour source follows the general features of the bremsstrahlung mechanism [10], or -equivalently [9]- the string model [7, 8]. Consider a colour source moving to the right. It will emit clusters555It is well known that most of the observed particles are decay products of resonances or ”clusters” [11]., approximately uniformly in rapidity, until it is neutralized by one of the partons of the target. Thus the density of the emitted clusters, , is confined to the rapidity region between the rapidity of the source () and the rapidity () of this parton from the target which neutralized the source666In the string language these are rapidities of the two ends of the string..
Consequenly, the observed distribution of clusters is
| (17) |
where represent the distributions of the emitting sources (valence and gluons) and the distribution of the partons in the target normalized to 1. Assuming that the parton distribution is dominated by gluons we furthermore obtain
| (18) |
This formula immediately implies that the contribution from gluon sources is symmetric with respect to (provided is symmetric, as expected). Consequently, the contribution to the antisymmetric part of the distribution comes solely from the valence sources.
To illustrate other consequences of (LABEL:1i), we shall first consider a radically simplified picture, taking for , and between and , where and are constants. The result is
| (19) |
Since the distribution of the valence part is confined to the region close to maximal rapidity, say y, the integral equals 1, for . Consequently, for we have
| (20) |
i.e. the linear dependence on .
This simple exercise shows that the (observed in data) linear dependence of the antisymmetric part of the distribution is a direct consequence of the flat distribution of gluons and of the emitted clusters.
The symmetric part is dominated by contribution from gluon sources which increases linearly with the total available rapidity. The quadratic dependence on is also -at least qualitatively- not inconsistent with the data [5]. Thus we feel that we may be indeed on the right track.
It is clear that important refinements to this simple example are necessary to obtain a more precise description of the data, particularly in the region close to the maximal allowed rapidity. Some possibilities are discussed in the Appendix.
5 Summary and discussion
Using the data on pseudorapidity distributions in collisions at 200 GeV c.m. energy [4], we have shown that they can be reasonably well described by the wounded nucleon model [1]. This allows one to determine the contribution to particle production from one wounded nucleon which is a novel information, hitherto not available. The data show that (a) extends over the full rapidity range, far beyond the hemisphere of the wounded nucleon in question, and (b) one observes a striking diference between the antisymmetric and symmetric parts of .
The last feature suggests that is built from two components, representing particle emission from two different sources. Extending the ideas formulated in [6], we proposed to identify these two sources as (i) the valence part of the nucleon and (ii) the soft part of the nucleon structure, dominated by gluons. This idea, accompanied with the assumption of the approximately flat gluon rapidity spectrum, explains immediately the striking linear behavior of the antisymmetric part of , determined by the contribution from the valence source (the gluon contribution is symmetric in rapidity and thus does not contribute to the antisymmetric part of the spectrum).
We thus conclude that the new data on collisions allowed us to obtain a qualitatively new information on particle production and to identify the two distinct sources inside the nucleon.
Several comments are in order.
(i) It should be emphasized that the model of wounded nucleons implies that the intensity of particle emission from a wounded nucleon does not depend on number of its interaction with the target. In our interpretation this means that the number of colour sources per unit of rapidity (in one nucleon) is independent of the number its interactions, i.e., independent of the number of colour exchanges between the projectile and target. The experimental verification of the model shows that such a saturation is indeed present.
(ii) It seems likely that this saturation of particle emission is related to the concept of formation zone [12], i.e., strong reduction of soft emission from sources too close in rapidity. It would be interesting to investigate this question in more detail.
(iii) Our interpretation of the data has very much in common with the dual parton model (DPM) [13]. In particular, our ”valence” contribution corresponds to that of diquark-quark string in DPM, while our gluonic strings are analogous to the sea-quark strings of DPM. Ignoring the technical details (inessential at this stage of discussion), the main difference is in the way we count the number of emitters. Although the number of valence sources is the same in the two models, counting of the ”short” strings seems substantially different. In the dual parton model the number of the ”short” strings equals the number of interactions between the projectile and target. As already explained above in (i), in our approach this is a property of the wounded nucleon, independent of the number of its interaction with the target.
(iv) The simple distributions of partons and of emitted clusters used in our discussion were taken only for illustration. If more precise description of data is attempted, they must be accordingly modified, particularly in the region close to maximal rapidity. One example of possible modification is shown in the Appendix. It would be certainly interesting to perform such an analysis when the final version of data is available.
(v) It was shown in [14] that the wounded nucleon model does not describe correctly the data for the collisions at RHIC energies. In particular, the particle density in the central rapidity region increases much faster than the number of wounded nucleons. It will be very interesting to compare these deviations with the ones observed in the present paper (c.f. Fig. 4).
6 Appendix
One possibility of the more adequate description of the data, still retaining the salient features of the model, is described below. Let
| (21) |
One sees that these formulae modify the regions close to the maximal rapidities. In the limit of vanishing parameters , and one recovers the simple situation described in Section 4. When (LABEL:5i) is substituted into (LABEL:1i) one obtains
| (22) |
with
| (23) |
and
| (24) |
where
| (25) |
For one obtains
| (26) |
| (27) |
These formulae show explicitly that the distributions are modified in a finite region close to the phase space boundary, where is not too large. As one moves out from the boudary, i.e. when are large, the corrections vanish exponentially, and we recover the results given by (LABEL:3i) and (LABEL:4i). The size of the region where the corrections are important is controlled by the parameters , , and .
We have checked that these formulae are flexible enough to account for the results of Figs. 5 and 6.
Acknowledgements We thank Wit Busza for illuminating discussions which focused our interest on the problem discussed in the present paper. We also thank Krzysztof Fialkowski for instructive discussions about different models of particle production. Last but not least we like to thank Roman Holynski for help in dealing with the PHOBOS data. This investigation was supported in part by the Polish State Commitee for Scientific research (KBN) Grant No 2 P03 B 09322.
References
- [1] A.Bialas, M.Bleszynski and W.Czyz, Nucl. Phys. B111 (1976) 461.
- [2] See, e.g., G. Roland, Acta Phys. Pol. B 34, 5751 (2003); A large selection of papers can be also found in Proc. of QM2002 (Nantes) published in Nucl. Phys. A715 (2003).
- [3] W. Busza, Proc. 20th Winter Workshop on Nuclear Dynamics (March 2004).
- [4] B.B.Back et al., Phobos collab. nucl-ex/0403033, presented by R.Nouicer at QM 2004.
- [5] I. Arsene et al., BRAHMS coll., nucl-ex/0401025.
- [6] A.Bialas and M.Jezabek, Phys. Lett. B590 (2004) 233.
- [7] B. Andersson et al., Phys. Reports 97 (1983) 317.
- [8] B. Andersson, The Lund model, Cambridge Univ. Press, Cambridge (1998).
- [9] F. Niedermayer, Phys. Rev. D34 (1986) 3494.
- [10] L. Stodolsky, Phys. Rev. Lett. 28 (1972) 60.
- [11] For a review, see, L.Foa, Phys. Rep. 22 (1975) 1.
- [12] L. Landau and I. Pomeranchuk, Doklady Akad. Nauk 92 (1953) 535; 92 (1953) 735; L. Stodolsky, Proc. VI ICMD, Rutherford Lab. (1975), p. 577; M. Miesowicz, Acta Phys. Pol. B33 (1972) 105.
- [13] A.Capella et al, Phys. Rep. 236 (1994) 225.
- [14] B.B.Back et al., PHOBOS coll., Phys. Rev. C65 (2002) 031901; 061901.