The Black Body Limit in Deep Inelastic Scattering
Abstract
We use information from DIS and the two gluon nucleon form
factor to estimate the impact parameter amplitude of hadronic
configurations in the dipole model of DIS. We demonstrate that only a
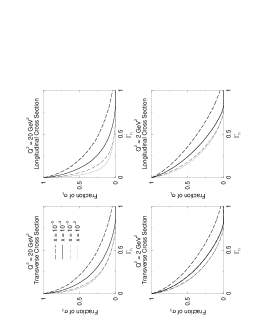
small fraction of the total cross section at is due to scattering that occurs near the black body limit.
We also make comparisons with other models and we point out that
a quark mass of MeV leads to a strong variation
of the the -dependence with .
1 Introduction
When one assumes that the scattering amplitude for hadron-hadron scattering is purely imaginary, unitarity implies that the total elastic cross section, , is less than the total inelastic cross section, , at impact parameter, (a small real part leads to a small correction). The unitarity limit is saturated when , which is equivalent to the condition that the profile function defined by, , is equal to unity. When this situation is reached, the target is totally absorbing at impact parameter, b, and scattering is said to occur in the black body limit (BBL). See, for example, Ref. [1].
Within the dipole model of DIS, the total cross section is written as the convolution of the basic cross section for the interaction of the virtual photon’s hadronic constituents with the square modulus of the photon wave function:
| (1) |
where is a function of . We will discuss the nearness of the hadronic constituent cross sections, , to the BBL. We use the model of McDermott, Frankfurt, Guzey, and Strikman (MFGS), discussed in Ref. [2], to interpolate between the hard and soft regimes for the total cross section. For the t-dependence, discussed in section 2, we use a model discussed in Ref. [3]. In the next section, we will demonstrate that a non-negligible fraction of the total cross section receives contributions from hadronic scattering near the BBL. In section 3, we will compare our model of the basic hadronic cross section with other models, and we will discuss the necessity of using constituent quark masses in the photon wave function.
2 Modeling the t-dependence
We use the following model for the basic hadronic amplitude:
| (2) |
with,
| (5) |
(See Ref. [3] for the detailed procedure.) Here, GeV2, GeV2 and GeV2. The typical size of the pion is fm, is , and . It can be checked that this form of the amplitude reproduces the expected small size, hard behavior while yielding the phenomenologically known behavior of the larger size, soft configurations. The exponential factor in Eq. 2 takes into account scattering by soft Pomeron exchange. Figure 2 shows some samples of the resulting profile function for small and larg hadronic sizes, and Fig. 3 demonstrates that a small fraction of the total cross section, obtained from Eq. 1, is due to scattering near the BBL. We would like to stress that the MFGS model makes reasonable predictions for at low which is demonstrated in Fig. 1 which makes comparisons between the MFGS predictions and preliminary data from Ref. [4]. This parameterization is consistent with HERA data on [5].


3 Comparisons with other models
A model similar to ours, but which only uses -meson production is discussed in Ref. [9]. This model yields qualitatively similar results to what we have found [10]. A comparison between these two models is shown in Fig. 4. (Note the definition, .) We would like to stress that data for production is limited to kinematics where GeV2 ( fm), whereas the MFGS model is valid down to much smaller values of .
The model of Golec-Biernat and Wusthoff (GBW) [11, 12], and its extension in Ref. [13], imposes exponential taming at large hadronic sizes (soft physics). In order to match the large size behavior to the perturbative, small size regime, the GBW model requires that the light quark masses remain small ( to GeV) even in the large size, nonperturbative regime. In the MFGS model, the light quark mass in the soft regime is fixed at a value of the order of hadronic masses (i.e., constituent quark mass). Form factors in the hard regime are naturally nearly independent of the quark mass. However, at small the cross section becomes very sensitive to the light quark mass. This is demonstrated in Fig. 5 which shows large variation of the average hadronic size between the MFGS model and the GBW model. The small quark mass which is forced upon the model of Golec-Biernat and Wusthoff probably overestimates the contribution from large size configurations at small . Figure 6 demonstrates the large contribution from large size configurations in the model of Golec-Biernat and Wusthoff for GeV2. Thus, we conclude that, for an exclusive process like , and for GeV2, the -dependence in the GBW model varies strongly with .
4 Conclusion
We conclude that effects from the proximity to the BBL will be small for for GeV2. With the extra color factor of 9/4 that appears when we consider a gluon dipole, the interaction is closer to the BBL. This is consistent with diffractive HERA data. We also note that our model has qualitative consistency with other dipole models based on different methods. We have stressed that special care must be taken in choosing the quark masses at small values of . We also wish to point out that lattice QCD calculations and approximations from instanton models support the use of large light quark masses in the small regime. (See Ref. [14] for an overview of nonperturbative calculations.)
Acknowledgements
We would like to thank J. Collins, L. Frankfurt, A. Mueller, C. Weiss, M. Diehl, and X. Zu for useful discussions.
References
- [1] V. N. Gribov, Sov. J. Nucl. Phys. 9, 369 (1969) [Yad. Fiz. 9, 640 (1969)]. V. N. Gribov, Sov. Phys. JETP 29, 483 (1969) [Zh. Eksp. Teor. Fiz. 56, 892 (1969)].
- [2] M. McDermott, L. Frankfurt, V. Guzey and M. Strikman, Eur. Phys. J. C 16, 641 (2000) [arXiv:hep-ph/9912547].
- [3] T. Rogers, V. Guzey, M. Strikman and X. Zu, Phys. Rev. D 69, 074011 (2004) [arXiv:hep-ph/0309099].
- [4] H1prelim-03-043 E. Lobodzinska
- [5] L. Frankfurt, M. McDermott and M. Strikman, JHEP 0103, 045 (2001) [arXiv:hep-ph/0009086].
- [6] H. L. Lai et al. [CTEQ Collaboration], Eur. Phys. J. C 12, 375 (2000) [arXiv:hep-ph/9903282].
- [7] J. Pumplin, D. R. Stump, J. Huston, H. L. Lai, P. Nadolsky and W. K. Tung, JHEP 0207, 012 (2002) [arXiv:hep-ph/0201195].
- [8] A. D. Martin, R. G. Roberts, W. J. Stirling and R. S. Thorne, Eur. Phys. J. C 4, 463 (1998) [arXiv:hep-ph/9803445].
- [9] S. Munier, A. M. Stasto and A. H. Mueller, Nucl. Phys. B 603, 427 (2001) [arXiv:hep-ph/0102291].
- [10] We thank A. Mueller for discussions on how to optimally compare results of the two analyses.
- [11] K. Golec-Biernat and M. Wusthoff, Phys. Rev. D 59, 014017 (1999) [arXiv:hep-ph/9807513].
- [12] K. Golec-Biernat and M. Wusthoff, Phys. Rev. D 60, 114023 (1999) [arXiv:hep-ph/9903358].
- [13] J. Bartels, K. Golec-Biernat and H. Kowalski, Phys. Rev. D 66, 014001 (2002) [arXiv:hep-ph/0203258].
- [14] D. Diakonov, Prog. Part. Nucl. Phys. 51, 173 (2003) [arXiv:hep-ph/0212026].