The QCD phase diagram at nonzero baryon, isospin and strangeness chemical potentials: Results from a hadron resonance gas model
Abstract
We use a hadron resonance gas model to study the QCD phase diagram at nonzero temperature, baryon, isospin and strangeness chemical potentials. We determine the temperature of the transition from the hadronic phase to the quark gluon plasma phase using two different methods. We find that the critical temperatures derived in both methods are in very good agreement. We find that the critical surface has a small curvature. We also find that the critical temperature’s dependence on the baryon chemical potential at zero isospin chemical potential is almost identical to its dependence on the isospin chemical potential at vanishing baryon chemical potential. This result, which holds when the chemical potentials are small, supports recent lattice simulation studies. Finally, we find that at a given baryon chemical potential, the critical temperature is lowered as either the isospin or the strangeness chemical potential are increased. Therefore, in order to lower the critical temperature, it might be useful to use different isotopes in heavy ion collision experiments.
I Introduction
The QCD phase diagram at nonzero temperature and baryon density has been the subject of numerous studies during the past few years cscRev ; lattRev . Two regions of the phase diagram have been placed under special scrutiny. First, in the low temperature and high density domain, the ground state is believed to be a color superconductor cscOrig ; cscMIT ; cscStonyBrook ; cscRev . There are numerous types of color superconducting phases that emerge as the baryon chemical potential increases cscRev ; cscPhases . Second, in the high temperature and low baryon density domain, there is a transition from the hadronic phase to the quark gluon plasma phase lattRev . This latter domain is probed by heavy ion collision experiments.
In heavy ion collision experiments baryon number, isospin and strangeness are conserved. The time between the formation of the fireball and its freeze-out is so short that only the strong interactions play a significant role. In the past heavy ion collision experiments, the value of the strangeness chemical potential is of the value of the baryon chemical potential, whereas the value of the isospin chemical potential is of the value of the baryon chemical potential hicRev . Thus the strangeness and isospin chemical potentials are small but not negligible. It is therefore worthwhile to study the QCD phase diagram in the high temperature region with nonzero baryon, isospin and strangeness chemical potentials.
At zero chemical potentials, numerical simulations on the lattice find that the temperature of the transition from the hadronic phase to the quark gluon plasma phase is given by MeV lattT_Bielefeld ; lattT_CP-PACS ; lattT_F&K ; lattT_MILC . However, at nonzero baryon chemical potential lattice simulations suffer from the so-called sign problem: The fermion determinant is complex. As a consequence, traditional methods cannot be used to study the QCD phase diagram at nonzero baryon chemical potential. However, recent advances have allowed studies of the high temperature and low baryon chemical potential region lattMuB_F&K ; lattMuB_Bielefeld ; lattMuB_ZH ; lattMuB_Maria ; lattMuB_Gupta ; lattMuB_Azcoiti . The situation at zero baryon and strangeness chemical potentials and nonzero isospin chemical potential is simpler: There is no sign problem and traditional methods can be used lattMuI (as in QCD with two colors at nonzero baryon chemical potential QCD2 ). The results in this case are in complete agreement with effective theory studies chptMu . From these lattice studies it appears that the critical temperature’s dependence on small baryon chemical potential at zero isospin and strangeness chemical potentials matches its dependence on small isospin chemical potential at vanishing baryon and strangeness chemical potentials lattMuB_F&K ; lattMuB_Bielefeld ; lattMuB_ZH ; lattMuI . We will show that the hadron resonance gas model supports this conclusion.
Recently, the study of the QCD phase diagram at nonzero temperature, baryon and isospin chemical potentials has attracted attention qcdMuBMuI_RMT ; qcdMuBMuI_NJL ; qcdMuBMuI_Ladder . Using different models, it was found that an arbitrarily small isospin chemical potential could greatly alter the QCD phase diagram at high temperature and small baryon chemical potential and have important consequences for heavy ion collision experiments. There are two phase transitions at high temperature. There are phases where the and quark sectors are decoupled qcdMuBMuI_RMT ; qcdMuBMuI_NJL ; qcdMuBMuI_Ladder . These results need to be confirmed by other methods, in particular on the lattice.
We study the QCD phase diagram at high temperature and nonzero baryon, isospin and strangeness chemical potentials using the hadron resonance gas model. It has been shown both experimentally and on the lattice that the hadronic phase is very well described by a weakly interacting hadron resonance gas hicRev ; hgrExp ; hgrLatt . We use two different methods to determine the location of the transition. First, it has been found on the lattice that the phase transition that separates the hadronic phase from the quark gluon plasma phase corresponds to a surface of constant energy density: GeV/fm3 hgrLatt . Second, the quark-antiquark condensate for the and quarks should almost vanish at the transition temperature. In this article, we determine the critical temperature, , at nonzero baryon, isospin and strangeness chemical potentials by using both approaches. We compute the surfaces of constant energy density as well as the quark-antiquark condensate in a hadron resonance gas model at nonzero temperature, baryon, isospin and strangeness chemical potentials. We show that both methods agree qualitatively as well as quantitatively. We find that the critical surface has small curvature, and that the critical temperature slowly decreases when either the baryon, the isospin, or the strangeness chemical potentials are increased.
II The model
We assume that the pressure in the hadronic phase is given by the contributions of all the hadron resonances up to GeV treated as a free gas, as in hgrLatt . All the thermodynamic observables can be derived from the pressure since
| (1) |
where is the grand canonical partition function in a finite volume , at nonzero temperature, , baryon chemical potential, , isospin chemical potential, , and strangeness chemical potential, . The energy density is given by
| (2) |
For a quark with mass , the quark-antiquark condensate is given by
| (3) |
At nonzero temperature, the contributions of massive states are exponentially suppressed . Their interactions are also exponentially suppressed . Therefore this approximation should be valid at low enough temperatures. However, since we are studying QCD at temperatures up to MeV, the lightness of the pions could be a problem, since MeV. The hadron resonance gas model should be a good approximation for the other hadrons since they have a mass larger than MeV. The physics of pions at nonzero temperature has been extensively studied in chiral perturbation theory chptGL ; chptT . The pions’ contributions to the pressure have been calculated up to three loops in chiral perturbation theory chptGL . It has been shown that the free gas approximation and chiral perturbation theory agree at the one loop level, and that, in chiral perturbation theory, the two-loop corrections to the pressure are below a few percents of the one-loop contributions for temperatures under MeV chptGL . Thus the hadron gas resonance model is a good approximation also for the pions. The hadron resonance gas model has already been used in the literature and has been shown to give a very good description of the hadronic phase and of the critical temperature hgrLatt .
In the free gas approximation, the contribution to the pressure due to a particle of mass , baryon charge , isospin , strangeness , and degeneracy is given by
| (4) |
where for fermions and for bosons, and is the modified Bessel function. This particle’s contribution to the energy density is given by
| (5) |
and its contribution to the quark-antiquark condensate is given by
| (6) |
In order to compute (6), we need to know as a function of or . We make two assumptions in order to compute (6). First, we assume that the Gell-MannOakesRenner relation is valid
| (7) |
where MeV is the pion decay constant, and is the quark-antiquark condensate at zero temperature and chemical potentials. Second, based on lattice results, we assume that the pion mass dependence of the hadron masses is given by
| (8) |
where hgrLatt . Therefore, combining (7) and (8), we assume that
| (9) |
Notice that since the hadron spectrum is isospin symmetric, we have that in the hadron resonance model at any temperature, baryon, isospin and strangeness chemical potentials. Therefore, the rich structure of the phase diagram found in qcdMuBMuI_RMT ; qcdMuBMuI_NJL ; qcdMuBMuI_Ladder cannot be seen in this model. Finally at fixed , it can be readily seen from (5) and (6) that an increase in either , or , or will increase and decrease . Thus using either or as a criterion to determine the critical temperature,we find that an increase in either , or , or decreases , and that at fixed an increase in or results in a decrease of as well.
III Results
III.1 Energy density criterion
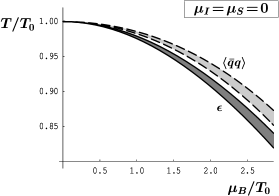
Lattice simulations have shown that the transition from the hadronic phase to the quark gluon plasma phase takes place at a constant energy density GeV/fm3 hgrLatt . We use this criterion to determine the critical temperature as a function of baryon, isospin and strangeness chemical potentials. Our results for the critical temperature as a function of at fixed and are shown in Figure 1.
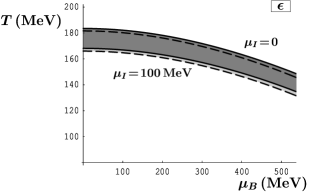
We find that this criterion constrains the critical temperature in a band of MeV. At zero chemical potentials, we find that MeV, which is in good agreement with lattice simulations lattT_Bielefeld ; lattT_CP-PACS ; lattT_F&K ; lattT_MILC . The temperature decreases as increases, as expected, but the decrease is slow. At the accuracy we can achieve using this method, an increase in does indeed decrease the critical temperature at fixed , but this effect is small at best. The decrease of the critical temperature is more important when is increased.
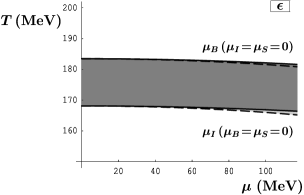
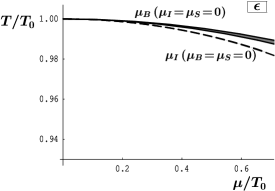
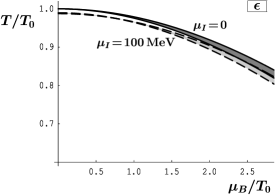
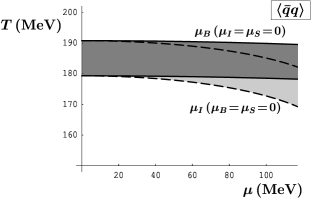
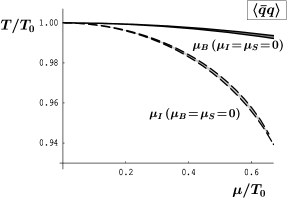
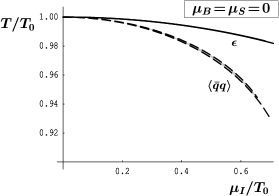
In Figure 2, we compare the critical temperature as a function of at with the critical temperature as a function of at . Notice that we limit ourselves to and in order to avoid the pion and kaon superfluid phases lattMuI ; chptMu ; kaonCond . We find that the critical temperature curves are almost identical in both cases. This is in agreement with results from the lattice lattMuB_F&K ; lattMuB_Bielefeld ; lattMuB_ZH ; lattMuB_Maria ; lattMuI .
We can fit our result for the critical temperature as a function of , and . By construction, since the pressure is an even function of in the hadron resonance model, the critical temperature is also even in . We find
| (10) |
where is the critical temperature at zero chemical potentials. The fit is excellent, with a linear regression coefficient .
III.2 Quark-antiquark condensate criterion
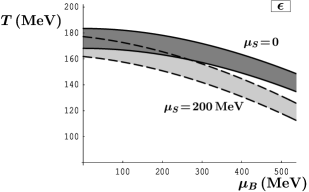
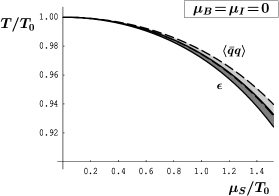
The critical temperature can also be computed from the quark-antiquark condensate. Indeed is of the order of the light quark masses at the phase transition and therefore almost vanishes. We determine the critical temperature by finding the point where in the hadron resonance gas model. We obtain a range of critical temperatures, since in the relation (9) the constant is not precisely known hgrLatt . Our results for the critical temperature as a function of at fixed and using are shown in Figure 3.
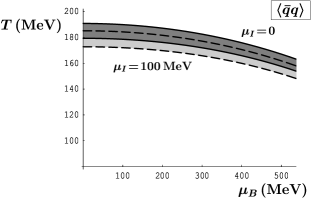
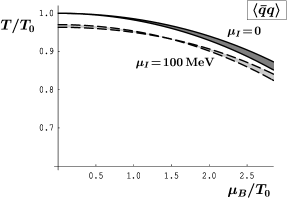
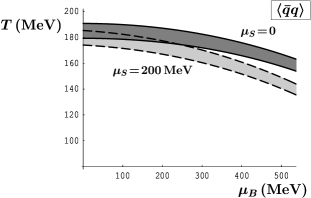
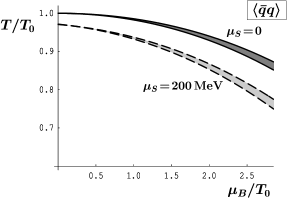
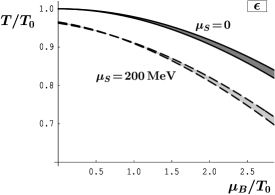
We find that this criterion constrains the critical temperature to a band of MeV. At zero chemical potentials, we find that MeV, which is in good agreement both with the result obtained above using the -criterion, as well as with lattice simulations lattT_Bielefeld ; lattT_CP-PACS ; lattT_F&K ; lattT_MILC . As expected, the critical temperature decreases as increases. As in the previous method, we find that an increase in the isospin chemical potential might reduce the critical temperature, but not in a significant way. The strangeness chemical potential has a stronger effect on the critical temperature. In Figure 4, we compare the critical temperature as a function of at with the critical temperature as a function of at .
We find that the critical temperature curves are almost identical in both cases.
We can fit our result for the critical temperature as a function of , and . We find
| (11) |
where is the critical temperature at zero chemical potentials. The fit is excellent, with a linear regression coefficient .
Finally we can compare the critical temperatures obtained using these two different approaches: constant energy density and disappearance of the quark-antiquark condensate. We present our results in Figure 5 at nonzero with , nonzero with , and nonzero with , respectively.
We find that the critical temperature at zero chemical potentials, , is lower when we use the -criterion than when we use the -criterion. If the critical curve is normalized with respect to , we find that the two methods are in very good agreement. If we compare the fits (10) and (11), we find that the and coefficients are very close in both cases, whereas the coefficients almost differ by a factor of three. However, this large difference in the coefficients leads to critical temperatures that only differ by a few percents in the region of interest. We therefore conclude that both methods yield critical temperatures that are in very good agreement.
IV Conclusion
We have used the hadron resonance gas model to determine the temperature of the transition from the hadronic phase to the quark gluon plasma phase as a function of baryon, isospin and strangeness chemical potentials. This is of interest for heavy ion collision experiments, since baryon, isospin and strangeness chemical potentials are nonzero in this case. We have used two different methods to determine the critical temperature. The first one relies on the observation on the lattice that the quark gluon plasma phase emerges at a constant energy density hgrLatt . The second method is based on the fact that the quark-antiquark condensate for the light quarks should almost disappear at the transition between the hadronic phase and the quark gluon plasma phase. We find that the critical temperatures found in both methods are in very good agreement.
In the hadron resonance gas model, the critical temperature decreases as the baryon, isospin, or strangeness chemical potentials increase, albeit slowly. In agreement with recent lattice simulations lattMuB_F&K ; lattMuB_Bielefeld ; lattMuB_ZH ; lattMuB_Maria ; lattMuI and several models qcdMuBMuI_RMT ; qcdMuBMuI_NJL ; qcdMuBMuI_Ladder , we find that the critical temperature as a function of the quark chemical potential at zero isospin chemical potential is almost identical to the critical temperature as a function of isospin chemical potential at zero quark chemical potential. We also find that the critical temperature decreases slightly when the isospin chemical potential is increased at fixed baryon chemical potential. This might be important for heavy ion collision experiments: A choice of different isotopes should reduce the critical temperature that separates the hadronic phase from the quark gluon plasma phase.
Acknowledgements.
We thank G. Baym, S. Ejiri and K. Splittorff for useful discussions.References
- (1) For a review see, K. Rajagopal and F. Wilczek, arXiv:hep-ph/0011333;
- (2) For a review see, S. Muroya, A. Nakamura, C. Nonaka and T. Takaishi, Prog. Theor. Phys. 110, 615 (2003).
- (3) For a review see, P. Braun-Munzinger, K. Redlich and J. Stachel, arXiv:nucl-th/0304013.
- (4) D. Bailin and A. Love, Phys. Rept. 107, 325 (1984);
- (5) M. G. Alford, K. Rajagopal and F. Wilczek, Phys. Lett. B 422, 247 (1998);
- (6) R. Rapp, T. Schafer, E. V. Shuryak and M. Velkovsky, Phys. Rev. Lett. 81, 53 (1998).
- (7) For a review see, M. G. Alford, Ann. Rev. Nucl. Part. Sci. 51, 131 (2001);
- (8) F. Karsch, E. Laermann and A. Peikert, Nucl. Phys. B 605, 579 (2001).
- (9) A. Ali Khan et al. [CP-PACS Collaboration], Phys. Rev. D 63, 034502 (2001).
- (10) Z. Fodor and S. D. Katz, JHEP 0404, 050 (2004).
- (11) C. Bernard et al. [MILC Collaboration], arXiv:hep-lat/0405029.
- (12) Z. Fodor and S. D. Katz, Phys. Lett. B 534, 87 (2002); JHEP 0203, 014 (2002); JHEP 0404, 050 (2004);
- (13) C. R. Allton et al., Phys. Rev. D 66, 074507 (2002); Phys. Rev. D 68, 014507 (2003); F. Karsch et al., Nucl. Phys. Proc. Suppl. 129, 614 (2004);
- (14) P. de Forcrand and O. Philipsen, Nucl. Phys. B 642, 290 (2002); Nucl. Phys. Proc. Suppl. 129, 521 (2004);
- (15) M. D’Elia and M. P. Lombardo, Phys. Rev. D 67, 014505 (2003).
- (16) R. V. Gavai and S. Gupta, Phys. Rev. D 68, 034506 (2003); R. Gavai, S. Gupta and R. Roy, Prog. Theor. Phys. Suppl. 153, 270 (2004).
- (17) V. Azcoiti, Talk presented at Lattice 2004, Fermilab (2004).
- (18) J. B. Kogut and D. K. Sinclair, Phys. Rev. D 66, 034505 (2002); Nucl. Phys. Proc. Suppl. 119, 556 (2003); Nucl. Phys. Proc. Suppl. 129, 542 (2004); D. K. Sinclair, J. B. Kogut and D. Toublan, Prog. Theor. Phys. Suppl. 153, 40 (2004).
- (19) S. Hands, J. B. Kogut, M. P. Lombardo and S. E. Morrison, Nucl. Phys. B 558, 327 (1999); S. Muroya, A. Nakamura and C. Nonaka, Nucl. Phys. Proc. Suppl. 94, 469 (2001); J. B. Kogut, D. Toublan and D. K. Sinclair, Phys. Lett. B 514, 77 (2001); S. Hands, I. Montvay, L. Scorzato and J. Skullerud, Eur. Phys. J. C 22, 451 (2001) J. B. Kogut, D. Toublan and D. K. Sinclair, Nucl. Phys. B 642, 181 (2002); Nucl. Phys. Proc. Suppl. 119, 559 (2003); Phys. Rev. D 68, 054507 (2003); P. Giudice and A. Papa, Phys. Rev. D 69, 094509 (2004).
- (20) J. B. Kogut, M. A. Stephanov and D. Toublan, Phys. Lett. B 464, 183 (1999); J. B. Kogut et al., Nucl. Phys. B 582, 477 (2000); D. T. Son and M. A. Stephanov, Phys. Rev. Lett. 86, 592 (2001); K. Splittorff, D. T. Son and M. A. Stephanov, Phys. Rev. D 64, 016003 (2001); J. B. Kogut and D. Toublan, Phys. Rev. D 64, 034007 (2001); K. Splittorff, D. Toublan and J. J. M. Verbaarschot, Nucl. Phys. B 620, 290 (2002); Nucl. Phys. B 639, 524 (2002);
- (21) B. Klein, D. Toublan and J. J. M. Verbaarschot, Phys. Rev. D 68, 014009 (2003);
- (22) D. Toublan and J. B. Kogut, Phys. Lett. B 564, 212 (2003); M. Frank, M. Buballa and M. Oertel, Phys. Lett. B 562, 221 (2003); A. Barducci, R. Casalbuoni, G. Pettini and L. Ravagli, Phys. Rev. D 69, 096004 (2004); D. N. Walters and S. Hands, arXiv:hep-lat/0407034.
- (23) A. Barducci, G. Pettini, L. Ravagli and R. Casalbuoni, Phys. Lett. B 564, 217 (2003).
- (24) J. Cleymans and K. Redlich, Phys. Rev. Lett. 81, 5284 (1998).
- (25) F. Karsch, K. Redlich and A. Tawfik, Eur. Phys. J. C 29, 549 (2003); Phys. Lett. B 571, 67 (2003); F. Karsch, Prog. Theor. Phys. Suppl. 153, 106 (2004); M. D’Elia and M. P. Lombardo, arXiv:hep-lat/0406012.
- (26) P. Gerber and H. Leutwyler, Nucl. Phys. B 321, 387 (1989).
- (27) J. Gasser and H. Leutwyler, Phys. Lett. B 188, 477 (1987); A. Schenk, Nucl. Phys. B 363, 97 (1991); A. Schenk, Phys. Rev. D 47, 5138 (1993); D. Toublan, Phys. Rev. D 56, 5629 (1997).
- (28) J. B. Kogut and D. Toublan, Phys. Rev. D 64, 034007 (2001); V. A. Miransky and I. A. Shovkovy, Phys. Rev. Lett. 88, 111601 (2002); T. Schafer, D. T. Son, M. A. Stephanov, D. Toublan and J. J. M. Verbaarschot, Phys. Lett. B 522, 67 (2001).