Measuring the deviation of the 2-3 lepton mixing from maximal with atmospheric neutrinos
Abstract
The measurement of the deviation of the 2-3 leptonic mixing from maximal, , is one of the key issues for understanding the origin of the neutrino masses and mixing. In the context we study the dependence of various observables in the atmospheric neutrinos on . We perform the global -analysis of the atmospheric and reactor neutrino data taking into account the effects of both the oscillations driven by the “solar” parameters ( and ) and the 1-3 mixing. The departure from the one–dominant mass scale approximation results into the shift of the 2-3 mixing from maximal by , so that . Though value of the shift is not statistically significant, the tendency is robust. The shift is induced by the excess of the -like events in the sub-GeV sample. We show that future large scale water Cherenkov detectors can determine with accuracy of a few percent, comparable with the sensitivity of future long baseline experiments. Moreover, the atmospheric neutrinos will provide unique information on the sign of the deviation (octant of ).
pacs:
14.60.Lm, 14.60.Pq, 95.85.Ry, 26.65.+tI Introduction
The present analysis of the atmospheric neutrino results SuperK ; sk-nu2004 ; atmnp in terms of oscillations gives as mass squared difference and mixing:
| (1) |
The results of SOUDAN SOUDAN and MACRO MACRO experiments are in a good agreement with (1) and this oscillation interpretation has been further confirmed by the K2K results K2K .
The best fit of the data corresponds to maximal mixing , and this is one of the most striking results in neutrino physics. The maximal or close to maximal mixing implies a new symmetry of Nature which does not show up in other sectors of theory indicating its non-trivial realization.
However, at the moment, one cannot claim that the mixing is indeed close to maximal. From the theoretical point of view the correct parameter which characterizes the deviation is not but or
| (2) |
It is that relates to the expansion parameter in the neutrino mass matrix and characterizes violation of the symmetry responsible for maximal mixing. From (1) we obtain for the deviation
| (3) |
and
| (4) |
That is, the deviation can be of the order of mixing itself.
In the case of a significant deviation we cannot speak of a special symmetry, and in fact, the large 2-3 mixing may appear as the sum of small (order of Cabibbo) mixing angles (see, e.g., DoSm ). So, maximal or non-maximal mixing is equivalent to the dilemma of new symmetry or no-new symmetry of Nature. (Here we exclude the possibility that small angles sum up to give accidentally exact maximal mixing). Depending on value of the deviation the approach to the underlying physics can be different.
The present data may already give some hint of deviation of the 2-3 mixing from maximal. Indeed, there is some excess of the like events in the sub-GeV range. The excess increases with decrease of energy within the sample super-data-used . In comparison with predictions based on the atmospheric neutrino flux from Honda honda the excess is about (12–15)% in the low energy part of the sub-GeV sample ( GeV, where is the momentum of lepton) and it shows no significant zenith angle dependence. In the higher energy part of the sub-GeV sample ( GeV) the excess is about 5%, and there is no excess in the multi-GeV region ( GeV).
In principle, the observed excess is within the estimated 20% uncertainty of the original atmospheric neutrino flux. So the analysis of data with free overall normalization and tilt of the energy spectrum can explain a large enough fraction of the excess leading to the result of best fit maximal 2-3 mixing.
The excess has become more significant in the latest Super-Kamiokande analysis sk-nu2004 . The recent data on primary cosmic rays BESS ; AMS as well as the new 3-dimensional calculations of the atmospheric neutrino fluxes honda3d imply a lower neutrino flux, and therefore a larger excess which is becoming more difficult to explain by a change of the atmospheric neutrino fluxes within their expected uncertainties super-data-used ; sk-nu2004 .
Alternatively, such an excess can be explained (at least partly) by the -oscillations driven by the solar oscillation parameters kim provided that the 2-3 mixing deviates from maximal orl1 ; PeSm . For the solar parameters which we will call the LMA parameters the combined analysis of the solar solar and KamLAND kamland data leads to 3 ranges ourpostnu04 :
| (5) |
Oscillations of atmospheric neutrinos driven by these LMA parameters have been widely discussed in the literature kim ; orl1 ; PeSm ; yasuda ; sakai99 ; strumia ; antonio ; Gonzalez-Garcia:2002mu . It is found that the relative change of the atmospheric flux due to oscillations driven by the solar parameters is determined by the two neutrino transition probability and a “screening” factor orl1 :
| (6) |
where and are the electron neutrino fluxes with and without oscillations, and is the ratio of the original muon and electron neutrino fluxes. The screening factor (in brackets) is related to the existence of both electron and muon neutrinos in the original atmospheric neutrino flux.
In the sub-GeV region , so that the screening factor is very small when the mixing is maximal. According to Eq. (6), the excess of the -like events can be written as:
| (7) |
where , and () is the average transition probability for neutrinos (antineutrinos) in the Earth matter. The parameter gives the relative contribution of antineutrinos (without oscillations). For the sub-GeV electrons we have . Once the solar oscillation parameters have been well determined, one can calculate rather precisely. Then the study of the excess can be used to search for the deviation PeSm .
For the presently allowed range of solar oscillation parameters, neutrino oscillations can lead up to a (5–6)% excess of the -like events in the sub-GeV atmospheric neutrino sample orl1 ; PeSm . So, the oscillation explanation of the observed excess would imply maximal allowed deviation . On the other hand, the decrease of influences other observables (like high statistics measurements of the zenith angle dependence of the -like events). Therefore to make a definitive conclusion about the deviation one needs to perform a combined analysis of the all available data and to take carefully into account the uncertainties in the atmospheric neutrino fluxes.
The oscillations are also induced by non-zero 1-3 mixing and responsible for the dominant mode of the atmospheric neutrino oscillations. This effect is mostly visible for the multi-GeV sample ADLS ; atmpetcov ; palomares for which the Earth matter effect becomes important and can enhance the oscillations. Non-zero 1-3 mixing induces also an interference effect in the sub-GeV range Gonzalez-Garcia:2002mu ; PeSm . However, within the present bound on the 1-3 mixing from the CHOOZ reactor experiment CHOOZ , the dominant factor which leads to a possible excess of the sub-GeV e-like events is the -driven transitions discussed here.
In this paper we perform a detailed study of the dependence of the atmospheric neutrino observables on the deviation . We determine from the analysis of present data and investigate possibilities of future experiments.
The paper is organized as follows. In Sec. II we discuss the dependence of different samples of the atmospheric neutrino data on . In Sec. III we present the results of the global analysis of the atmospheric and CHOOZ results in terms of three–neutrino oscillations where the effect of both mass differences is explicitly considered. In Sec. IV we study the capabilities of future large scale water Cherenkov detectors to determine . Discussion of the results and conclusions are given in Sec. V.
II and the atmospheric neutrino observables
In this section, using some approximate analytical results, we discuss the dependence of the atmospheric neutrino observables on the deviation .
-
1.
According to Eq. (7) the excess of -like events in the sub-GeV range due to LMA parameter oscillations is proportional to the deviation :
(8) while their zenith angle distribution (encoded in ) does not depend on . The 1-3 mixing modifies this dependence but, for values compatible with the CHOOZ bound, it is a subdominant effect for sub-GeV events.
The important point is that the excess decreases with energy as . This particular energy dependence of the excess allows to disentangle it from the uncertainties of the neutrino fluxes.
-
2.
As a consequence of this energy dependence, in the multi-GeV range the excess of the -like events due to the LMA parameters is very small: 5–10 times smaller than in the sub-GeV range and therefore below 1%. Conversely, the zenith angle distribution here is stronger.
-
3.
The sub-GeV -like events have more complicated dependence on the deviation orl1 ; Gonzalez-Garcia:2002mu :
(9) The dominant contribution due to the oscillations, , (the first term on the RHS) depends on . Here is the oscillation phase due to . The term describes the decrease of the rate of the -like events due to oscillations of the muon neutrinos into the electron neutrinos driven by the 1-2 mixing:
(10) The third term is the interference of these two contributions and it is essentially averaged out. The expression (9) can be rewritten as
(11) Notice that the 1-2 mixing has an opposite effect on the rate of the -like events as compared to its effect on the e-like events. Thus for the case of the excess of -like events, the 1-2 mixing diminishes the rate of -like events. So, it cancels partially the increase of the rate due to the main term . Furthermore, both terms exhibit a different dependence on :
(12) So, for large deviation the change of the main term dominates, whereas for small deviations the two contributions become comparable.
-
4.
For muons in the multi-GeV range, due to the suppression of , the effect of the 1-2 mixing is small and the change of the main term in Eq. (9) dominates down to very small deviations. So, basically the rate of the -like events increases with . Conversely, for the multi-GeV events the effect of 1-3 mixing can be more substantial ADLS ; atmpetcov ; palomares .
-
5.
In the sub-GeV range the double ratio can be written as orl1
(13) where is the double ratio in the case of two-neutrino oscillations with maximal mixing. In terms of the deviation it can be rewritten as
(14) For the 1-2 mixing effects partially compensate the change of main term and numerical inspection of Eq. (14) reveals that the change of with is rather weak. For the 1-2 mixing enhances the ratio .
In the multi-GeV range the corrections are small and the double ratio increases with . Comparing the double ratios in the sub-GeV and multi-GeV ranges we conclude that changes weakly (for ) whereas increases, so that the ratio of ratios
(15) increases with .
-
6.
For upward-going muons the average energy of the neutrinos is above 10 GeV. For these energies, the effect of 1-2 mixing is strongly suppressed in matter. Also the possible 1-3 mixing has additional matter suppression: the relevant factor is . So, to a good approximation the rate depends on .
Summarizing, the rate of the low energy -like events is proportional to the deviation and the rates of high energy (-like) events depend on , i.e., on the deviation squared. The rate of low energy -like events an the double ratios may have non-trivial interplay of the two dependences: cancellation or enhancement of the main mode and 1-2 mixing contributions. With these consideration in mind one can better understand the results of the various analyses described in the following sections.
III Global analysis of present data
We discuss here what can be learned from the subleading effects induced by non-vanishing solar splitting and the present atmospheric and reactor neutrino data. In our analysis we include the complete 1489-day charged-current data set for SK-I sk-nu2004 , which comprises the sub-GeV and multi-GeV -like and -like contained event samples (each grouped into 10 bins in zenith angle), as well as the stopping (5 angular bins) and through-going (10 angular bins) up-going muon data events. In the calculation of the event rates we have used the new three-dimensional atmospheric neutrino fluxes given in Ref. honda3d .
Details of our statistical analysis based on the pull method can be found in the Appendix of Ref. atmnp and here we summarize some points which are essential for the present study. Together with the statistical errors, we consider two types of uncertainties: the theoretical and systematic ones.
The theoretical uncertainties include uncertainties in the original atmospheric neutrino fluxes and in the cross-sections.
We have parametrized uncertainties of the atmospheric neutrino fluxes in terms of four pulls:
-
•
a total normalization error, which we set to 20%;
-
•
a “tilt” factor which parametrizes possible deviations of the energy dependence of the atmospheric fluxes from the simple power law defined as
(16) with an uncertainty on the factor , and GeV;
-
•
the uncertainty on the ratio, which is assumed to be ; and
-
•
the uncertainty on the zenith angle dependence which induces an error in the up/down asymmetry of events which we conservatively take to be 5%.
We also include independent normalization errors for the different contributions to the interaction cross section: quasi-elastic scattering (QE), , single pion production(), , and deep inelastic (DIS) scattering (also refer to as multi-pion) for which we estimate for contained events and for upward-going muons.111We also account for the uncertainty of the ratio which is relevant only for contained events, and it is much smaller than the total normalization uncertainty.
We include as systematic uncertainties the experimental uncertainties associated with the simulation of the hadronic interactions, the particle identification procedure, the ring-counting procedure, the fiducial volume determination, the energy calibration, the relative normalization between partially-contained and fully-contained events, the track reconstruction of upgoing muons, the detection efficiency of upgoing muons, and the stopping-thrugoing separation.
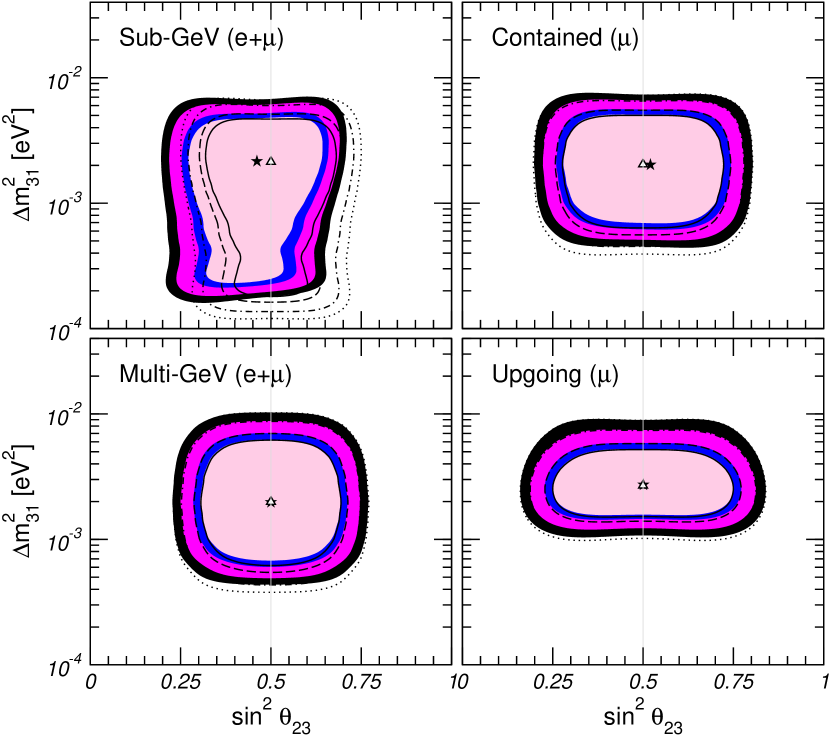
In order to illustrate which data samples are more sensitive to the departure from the one–mass–scale dominance approximation and to the deviation we first perform the analysis for different sub-samples. The results of these partial analysis are presented in Fig. 1 where we show the allowed regions in the (, ) plane. The colored (shadowed) regions correspond to and , whereas hollow regions are for . In both cases we assume . A comparison between the two sets of regions clearly shows that the main effect of oscillations appears in the -like events at lower energies as discussed in the previous section. As seen in the figure the inclusion of -driven oscillations in the analysis breaks the symmetry of around maximal mixing providing the expected sensitivity to . In accordance with the considerations of Sec. II the allowed regions and the best fit point shift to .
Also, as discussed in the previous section, the effect is much more suppressed at higher energies. As can be seen in the figure, the high energy muon neutrino events as well as the multi-GeV (-like and -like) events do not lead to the shift of 2-3 mixing from maximal. The contained -like events produce a very small shift in the opposite direction: to . Let us underline that despite they show much less sensitivity to 1-2 oscillations, the muon neutrino data are very important to constraint the 2-3 oscillation parameters and to limit the effect of theoretical and systematic uncertainties.
Next we study the effect of oscillation in the combined analysis of all available atmospheric neutrino data (a total of 55 data points). In order to account also for the effect of the angle we include in the analysis the results of the CHOOZ experiment. For CHOOZ we consider the energy binned data. This corresponds to 14 data points (7-bin positron spectra from both reactors, Table 4 in Ref. CHOOZ ) with one constrained normalization parameter. In this analysis we have assumed CP conservation but we have considered both possible values of the CP parity which correspond to the CP phases and .
The results are shown in Fig. 2. As before, the colored (shadowed) regions correspond to and different from zero, whereas the hollow regions are for . In order to verify explicitly that our results are robust and do not change for non-zero , we have marginalized with respect to this parameter. In the lower panels we plot the function marginalized with respect to as well.
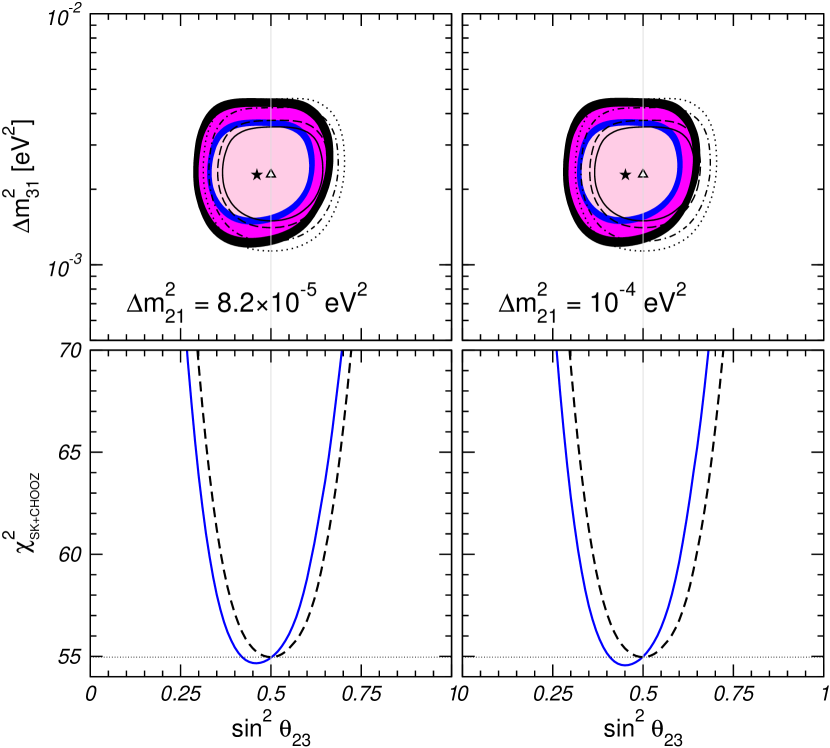
From the figure we see that, even with the present uncertainties, the atmospheric data has some sensitivity to oscillation effects and that these effects break the symmetry in around maximal mixing, although the effect is small. Quantitatively, for and , the best-fit point is located at , with () interval which means that for these values of the solar parameters we find
| (17) |
whereas for we obtain (the slight asymmetry of errors in this case is induced by ). For values of in the range indicated by solar and KamLAND data, the deviation from maximal mixing of increases with . We have also verified that, once CHOOZ is also included in the analysis, it makes little difference to leave free or to set it to zero.
Let us stress that, although statistically not very significant, this preference for non-maximal 2-3 mixing is a physical effect on the present neutrino data, induced by the fact than an excess of events is observed in sub-GeV electrons but not in sub-GeV muons nor, in the same amount, in the multi-GeV electrons. As a consequence, this excess cannot be fully explained by a combination of a global rescaling and a “tilt”, of the fluxes within the assumed uncertainties. In the pull approach we find that both the total normalization and the tilt pulls are essentially fixed by the combination of low-energy and high-energy muon data, and there is no freedom left to accommodate the remaining excess of low energy electron events. Such an excess can only be partially explained by means of another pull, the flavor ratio, whose uncertainty, 5%, is however much smaller. We have explicitly verified that in the vicinity of the best-fit point the only pull which is affected by the precise value of is the flavor ratio, whereas the total normalization and the tilt are practically insensitive to it. In particular, we have checked that increasing the tilt uncertainty by a factor of 2 or allowing for a totally unconstrained overall normalization does not affect the present value of in Eq. (17).
From the lower panels in Fig. 2 we can also see that the quality of the fit slightly improves when differs from zero. As expected, this is due to the fact that the non-vanishing value of and non-zero imply that transition is more efficient than the inverse one, , which allows to partially explain the excess of -like events observed by Super-Kamiokande in the sub-GeV data sample.
Notice that the central value of deviation in Eq. (17) corresponds to which is beyond the sensitivity of the next generation of the long-baseline experiments.
In summary, in this section we have shown that atmospheric neutrino data are sensitive to the subleading conversion induced by a non vanishing . More important, the preference of atmospheric data for maximal mixing appears to be a specific property of the one–dominant mass scale approximation, and seems to disappear when oscillations with the two wavelengths between all three known neutrino flavor are considered. However, present data still have far too little statistics to provide a conclusive answer.
IV Sensitivity of future experiments
Having shown that atmospheric neutrino data can be a useful instrument to search for deviations of from , we now discuss what can be learned from future atmospheric experiments. For the sake of concreteness we have assumed a SK-like detector with either 20 (SK20) or 50 (SK50) times the present SK-I statistics and the same systematics as SK-I, and we have used the same event samples as in SK.
The procedure is as follows: First we simulate the signal according to the expectations from some specific choice of the “true” values of parameters which we denote by
| (18) |
and then we construct
| (19) |
assuming 20 or 50 times the present SK statistics and three choices for the theoretical and systematic errors (see definitions in Sec. III):
-
(A)
same theoretical and systematic errors as in present SK;
-
(B)
same systematic errors as in present SK, but no theoretical uncertainties;
-
(C)
neither theoretical nor systematic uncertainties (perfect experiment).
Next, in order to study the effect that non-zero values of and can produce in the determination of the atmospheric parameters and we define
| (20) |
where we minimize with respect to the solar and reactor parameters and and we keep only the explicit dependence on the “atmospheric” parameters and . The assumption is made for purely practical reasons because a complete scan of the whole five-dimensional parameter space requires too much computer time. Note that regardless of the specific assumptions on the ‘true values’ and the parameters and are allowed to vary in our fit. In the definition of in Eq. (20) we have included also the CHOOZ experiment in order to have a realistic bound on . Similarly, the term accounts for the bound on which is expected from KamLAND in the next few years. Following Ref. Bahcall:2003ce , we have assumed that by then will be known with an uncertainty of at .
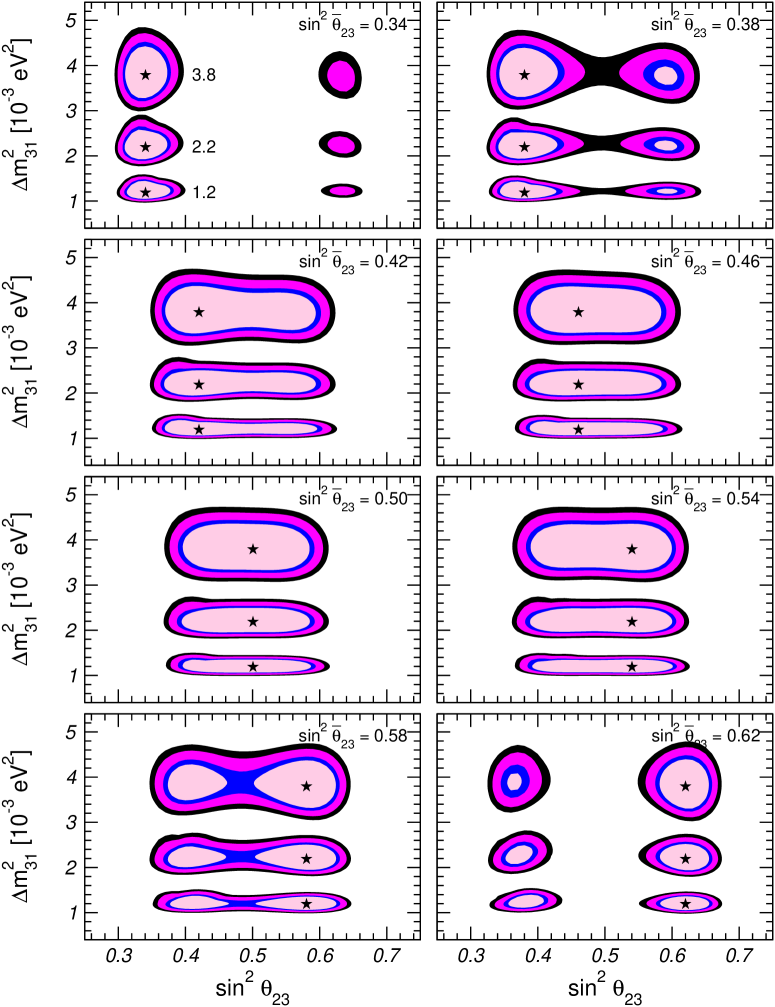
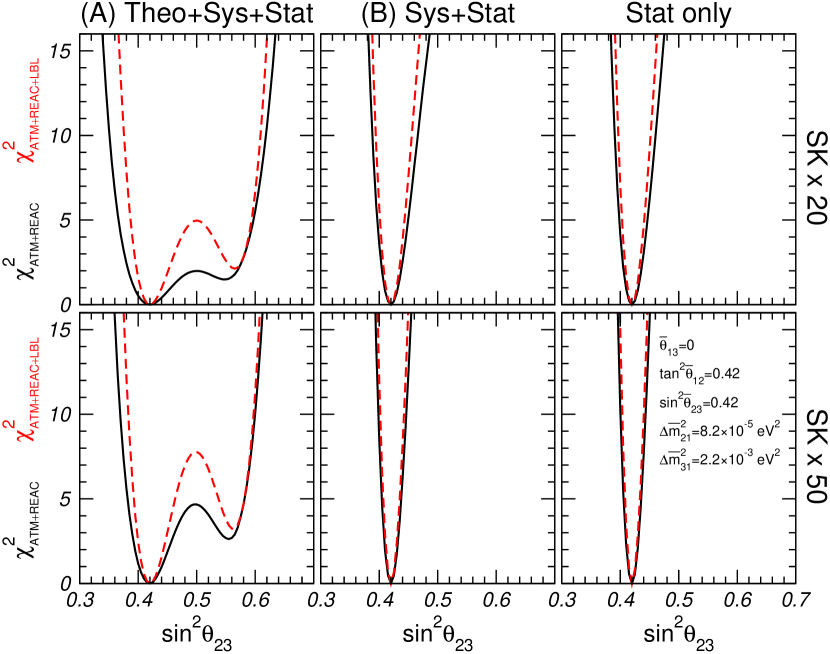
As an illustration of the expected sensitivity from future atmospheric neutrino experiments, we show in Fig. 3 the allowed regions obtained from assuming 20 times the present SK statistics and the same theoretical and systematic errors as in present SK (case A). For definiteness, we choose , and , and we scan different values of and . From this figure we find that:
-
•
future atmospheric neutrino experiments can observe and measure deviations of from maximal mixing, provided that is not too close to : or ; future reduction in the theoretical errors will further improve the sensitivity;
-
•
they can discriminate between the “light-side” and “dark-side” for , i.e., they are sensitive to the octant of .
In the rest of this section we quantify these two possibilities.
IV.1 Deviations from maximal mixing
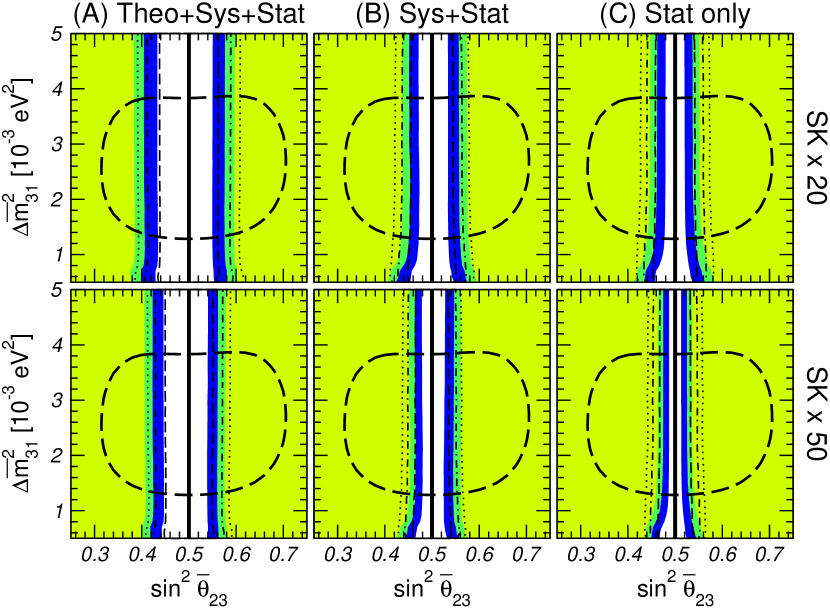
Let us quantify the sensitivity of the future atmospheric neutrino experiments to deviation of from . We compare our results with the corresponding bounds which can be expected for future long baseline (LBL) experiments Antusch:2004yx ; minakata , following the discussion in Ref. Antusch:2004yx . The results of our analysis are summarized in Fig. 4 and Table 1, which can be directly compared with Fig. 1 and Table 1 of Ref. Antusch:2004yx .
To perform this analysis, we have constructed the following function:
| (21) |
where is given in Eq. (20). In Fig. 4 we plot the dependence of on and , for both (colored regions) and (hollow regions). We take and . The blue, green and yellow regions correspond to , and , respectively. In other words, in Fig. 4 we display, for each value of , the range of for which the simulated signal can be reconstructed as having maximal at 1, 2 and 3 . The white region corresponds to the the range of for which the simulated signal cannot be distinguished from maximal at . The corresponding bounds on for are summarized in Table 1.
| Experiment | ||||
|---|---|---|---|---|
| With | With | |||
| 90% C.L. | 90% C.L. | |||
| SK20 (A) Theo+Sys+Stat | [-0.086, 0.067] | [-0.116, 0.096] | [-0.080, 0.080] | [-0.108, 0.108] |
| SK20 (B) Sys+Stat | [-0.040, 0.050] | [-0.062, 0.075] | [-0.058, 0.058] | [-0.078, 0.078] |
| SK20 (C) Stat only | [-0.032, 0.032] | [-0.054, 0.052] | [-0.054, 0.054] | [-0.073, 0.073] |
| SK50 (A) Theo+Sys+Stat | [-0.070, 0.053] | [-0.094, 0.077] | [-0.064, 0.064] | [-0.087, 0.087] |
| SK50 (B) Sys+Stat | [-0.030, 0.040] | [-0.046, 0.061] | [-0.046, 0.046] | [-0.063, 0.063] |
| SK50 (C) Stat only | [-0.021, 0.021] | [-0.037, 0.036] | [-0.042, 0.042] | [-0.058, 0.058] |
From Fig. 4 and Table 1 we find that the sensitivity of atmospheric neutrino data to deviations from maximal mixing for large values of is comparable to what can be expected “after ten years” from LBL experiments according to Ref. Antusch:2004yx , at 90% (3) CL. Furthermore, for small values of the atmospheric neutrino studies are much more sensitive than LBL experiments, which lose sensitivity very fast when while the bound which can be obtained from the atmospheric neutrino data is practically independent of the value of .
The comparison among the left, central and right panels of Fig. 4 also shows that the sensitivity of atmospheric neutrino data to deviations from maximal mixing improves considerably if theoretical errors on the atmospheric fluxes and cross sections are reduced. On the contrary setting to zero the systematic uncertainties induce a smaller improvement. This implies that the obtained results hold even if the future atmospheric neutrino experiment is affected by somewhat larger systematics than the present SK detector has.
We also see that, as expected, when the ranges of can be asymmetric. This effect is mostly seen in the first two panels (cases A and B) because larger errors allow for larger values of . We find that the overall effect of the theoretical errors is such that the fit for maximal mixing is “less-bad” if an excess of e-like sub-GeV events is observed as compared to the observation of a deficit, while for systematic uncertainties the opposite holds.
In any case, comparing the solid (obtained with ) and the hollow (obtained with ) regions in Fig. 4 we see that the value of the solar mass splitting is not the most important effect in the discrimination from maximal mixing, and the bound comes mainly from muon data. Only when both theoretical and systematic uncertainties are neglected (case C) the bound on becomes visibly sensitive to . This occurs because the effect of a non-zero value of is comparable to the small statistical error so this small effect is relevant only when the fit is purely statistics-dominated. In general, the subdominant effect is mostly important to determine the octant of as we discuss next.
IV.2 Determination of the octant
As an illustration of the capability of atmospheric neutrino data to discriminate between smaller or larger than , we show in Fig. 5 the dependence of for a particular simulated point as a function of , after marginalizing over all other parameters. In what follows we work under the hypothesis that by the time this future atmospheric neutrino experiment is in place we have found no-evidence of but we may have a better-than-present determination of the oscillation parameters from terrestrial experiments. To account for this effect we have constructed the function
| (22) |
where in addition to the CHOOZ and KamLAND-3yr bounds we have included a stronger bound on the angle (for example, from some future reactor experiment reactors ) as well as an improved measurement of the atmospheric parameters and from future narrow beam LBL experiments such as T2K t2k or NuMi numi . Following Ref. Huber:2004ug , we have assumed , and . Note that in Eq. (22) we have expressed the sensitivity of future LBL experiments in terms of , rather than , to account for the fact that these experiments have no sensitivity to the octant if turns out to be very small (i.e., they cannot distinguish between and )222A very long baseline wide beam experiment such as the BNL proposal bnl could be also sensitive to subdominant effects. Antusch:2004yx .
In Fig. 5 we see that the best fit point ( by construction) is located at (and , , and ), while in the left panels (case A) presents a second local minimum at . The shift between the position of the secondary minimum and the mirror symmetric value of the true minimum is expected from the atmospheric analysis. On the other hand, in the central (case B) and right (case C) panels the second “false” minimum has disappeared. Again, this illustrates the importance of improving our knowledge of the fluxes and cross-sections. As before, for both SK20 and SK50 the dominant source of errors is the theoretical uncertainties, whereas systematic uncertainties play a somewhat smaller role. We find that once the theoretical uncertainties are neglected, the atmospheric data can totally lift the degeneracy between the two octants of .
In order to quantify the discrimination power of the octant of we define the difference
| (23) |
where is either the mixing angle of the secondary local minimum, or if there is not a secondary local minimum. In Fig. 6 we plot this difference as a function of the simulated “true” value for , and . This function is very insensitive to the exact value of in the interval .
The figure shows that unless is very close to maximal mixing such a future atmospheric neutrino experiment can provide a meaningful determination of the octant of . For example, from the figure we read that for SK50 the octant of can be determined at 90% CL if
| or | (A) | |||||||
| or | (B) | (24) | ||||||
| or | (C) |
These results are almost independent of the exact value of within the present atmospheric region. From Fig. 6 we see that the discriminating power can be slightly improved if LBL experiments provide a better determination of , as a consequence of the shift in the position of the secondary minimum in the atmospheric neutrino analysis.
A final comment on the role of . If is not very small, the oscillation probabilities at the considered LBL experiments are also not symmetric under the change of octant and they can also contribute to the octant discrimination minakata . This effect has not been statistically quantified in detail in the literature and it is beyond the purpose of this paper.
V Conclusion
In this paper we have discussed the phenomenology of atmospheric neutrinos associated with the deviation of the 2-3 leptonic mixing from maximal. Our main results can be summarized as follows:
-
1.
We have performed the global -analysis of the atmospheric and reactor neutrino data taking into account the effect of both the oscillations driven by the “solar” parameters ( and ) and of the 1-3 mixing. The results are shown in Fig. 2. We find that the departure from the one–dominant mass scale approximation in the analysis results into the shift of the 2-3 mixing from maximal, so that . The shift is due to the excess of -like events in the sub-GeV sample as illustrated in Fig. 1. For these values of the LMA oscillations explain the excess only partly. Larger deviation is disfavored by the zenith angle distribution of the -like events. The qualitative effect of the shift of 2-3 mixing from maximal one is robust. Though particular value of the shift depends on details of the treatment of errors.
-
2.
Future experiments will have much higher sensitivity to . With SK statistics and better knowledge of the cross-sections and the original fluxes the atmospheric neutrinos will probe down to few percent (see Fig. 4 and Table 1) – a sensitivity comparable with that attainable at future LBL experiments. This sensitivity does not change with decrease of and therefore a high statistics atmospheric neutrino experiment is better than LBL experiments to determine deviations of from maximal mixing if lies in the lower part of the present allowed range.
- 3.
Acknowledgements.
M.M. is grateful to P. Huber and T. Schwetz for very useful discussions on long-baseline experiments. A.Yu.S. thanks P. Lipari for valuable comments. This work was supported in part by the National Science Foundation grant PHY-0354776. M.C.G.-G. is also supported by Spanish Grants No FPA-2001-3031 and CTIDIB/2002/24.References
- (1) Super-Kamiokande Collaboration, Y. Fukuda et Ab., Phys. Lett. B433, (1998) 9; Phys. Lett. B436, (1998) 33 ; Phys. Lett. B467, (1999) 185 ; Phys. Rev. Lett. 82, (1999) 2644; Phys. Rev. Lett. 85, 3999 (2000).
-
(2)
Super-Kamiokande Collaboration,
E. Kearns talk given at the
Neutrino 2004 conference (Paris, France, 2004, transparencies available at
http://neutrino2004.in2p3.fr/. - (3) M. C. Gonzalez-Garcia and M. Maltoni, Phys. Rev. D 70, 033010 (2004).
- (4) Soudan 2 Collaboration, M. Sanchez et al., Phys. Rev. D 68, 113004 (2003).
- (5) MACRO Collaboration, Phys. Lett. B566 35, (2003).
-
(6)
K2K Collaboration, M. H. Ahn et al.,
Phys. Rev. Lett. 90, 041801 (2003);
T. Nakaya talk given at the
Neutrino 2004 conference (Paris, France, 2004, transparencies available at
http://neutrino2004.in2p3.fr/. - (7) I. Dorsner, A.Yu. Smirnov, hep-ph/0403305.
-
(8)
A. Kobayashi, PhD Thesis, University of
Hawaii, Aug. 2002. Available at
http://www-sk.icrr.u-tokyo.ac.jp/doc/sk/pub/atsuko.ps.gz. - (9) M. Honda et al., Phys. Lett. B248, 193 (1990); M. Honda et al., Phys. Rev. D52, 4985 (1995).
- (10) BESS Collaboration, T.Sanuki et al., Astrop. J. 545 1135 (2000).
- (11) AMS Collaboration, J. Alcaraz et al., Phys. Lett. B490 27 (2000).
- (12) M. Honda, T. Kajita, K. Kasahara and S. Midorikawa, astro-ph/0404457.
- (13) C. W. Kim, U. W. Lee, Phys. Lett. B444, 204 (1998).
- (14) O.L.G. Peres and A.Yu. Smirnov, Phys. Lett. B456, 204 (1999).
- (15) O.L.G. Peres, A.Yu. Smirnov, Nucl. Phys. B680 479, (2004).
- (16) B.T. Cleveland et al., Astrophys. J. 496 (1998) 505; GALLEX collaboration, W. Hampel et al., Phys. Lett. B 447 (1999) 127; M. Altmann et al., Phys. Lett. B 490 (2000) 16; SAGE collaboration, J.N. Abdurashitov et al., J. Exp. Theor. Phys. 95 (2002) 181; Super-Kamiokande Collaboration, S. Fukuda et al., Phys. Rev. Lett. 86 (2001) 5651; SNO Collaboration, S.N. Ahmed et al., Phys. Rev. Lett. 92 (2004), 181301
- (17) KamLAND collaboration, hep-ex/040621.
- (18) J. N. Bahcall, M. C. Gonzalez-Garcia and C. Pena-Garay, hep-ph/0406294.
- (19) O. Yasuda, hep-ph/9602342; hep-ph/9706546.
- (20) T. Teshima, T. Sakai, Prog.Theor.Phys. 102, 629 (1999).
- (21) A. Strumia, JHEP 04, (1999) 26.
-
(22)
A. Marrone, talk at NOON 2001,
http://www-sk.icrr.u-tokyo.ac.jp/noon2001. Published in “Kashiwa 2001, Neutrino oscillations and their origin”, 158-165. - (23) M. C. Gonzalez-Garcia and M. Maltoni, Eur. Phys. J. C 26, 417 (2003).
- (24) E. Kh. Akhmedov, A. Dighe, P. Lipari, A. Yu. Smirnov, Nucl. Phys. B542, 3 (1999).
- (25) M. Chizhov, M. Maris and S. T. Petcov, hep-ph/9810501.
- (26) J. Bernabeu, S. Palomares Ruiz and S. T. Petcov, Nucl. Phys. B 669, 255 (2003); S. Palomares-Ruiz and S. T. Petcov, hep-ph/0406096.
- (27) CHOOZ Collaboration, M. Apollonio et al., Phys.Lett. B420, 397 (1998); Eur. Phys. J. C 27, 331 (2003).
- (28) J. N. Bahcall and C. Pena-Garay, JHEP 0311, 004 (2003).
- (29) S. Antusch, P. Huber, J. Kersten, T. Schwetz and W. Winter, hep-ph/0404268.
- (30) H. Minakata, M. Sonoyama and H. Sugiyama, hep-ph/0406073.
-
(31)
K.Heeger, Talk given at NOON 2004,
http://www-sk.icrr.u-tokyo.ac.jp/noon2004/. - (32) D. Ayres et. al, heo-ex/0210005.
- (33) Y. Itow et al., Nucl. Phys. Proc. Suppl. 111, 146 (2001).
- (34) P. Huber, M. Lindner, M. Rolinec, T. Schwetz and W. Winter, hep-ph/0403068.
- (35) M. V. Diwan et al., Phys. Rev. D 68, 012002 (2003).