SISSA 47/2004/EP
hep-ph/0406328
Update of the Solar Neutrino Oscillation Analysis with the 766 Ty KamLAND Spectrum
Abhijit Bandyopadhyay1,
Sandhya Choubey2,3,
Srubabati Goswami4,
S.T. Petcov3,2,5,
D.P. Roy6,7
1Saha Institute of Nuclear Physics, 1/AF, Bidhannagar, Calcutta 700 064, India,
2INFN, Sezione di Trieste, Trieste, Italy,
3Scuola Internazionale Superiore di Studi Avanzati, I-34014, Trieste, Italy,
4Harish-Chandra Research Institute, Chhatnag Road, Jhusi, Allahabad 211 019, India,
5Institute of Nuclear Research and Nuclear Energy, Bulgarian Academi of Science, Sofia, Bulgaria,
6The Abdus Salam International Centre for Theoretical Physics, I-34100, Trieste, Italy,
7Tata Institute of Fundamental Research, Homi Bhabha Road, Mumbai 400 005, India
Abstract
We investigate the impact of the 766.3 Ty KamLAND spectrum data on the determination of the solar neutrino oscillation parameters. We show that the observed spectrum distortion in the KamLAND experiment firmly establishes to lie in the low-LMA solution region. The high-LMA solution is excluded at more than 4 by the global solar neutrino and KamLAND spectrum data. The maximal solar neutrino mixing is ruled out at level. The allowed region in the plane is found to be remarkably stable with respect to leaving out the data from one of the solar neutrino experiments from the global analysis. We perform a three flavor neutrino oscillation analysis of the global solar neutrino and KamLAND spectrum data as well. The upper limit on is found to be . We derive predictions for the CC to NC event rate ratio and day-night (D-N) asymmetry in the CC event rate, measured in the SNO experiment, and for the suppression of the event rate in the BOREXINO and LowNu experiments. Prospective high precision measurements of the solar neutrino oscillation parameters are also discussed.
1 Introduction
The last four years will most likely be described in the future as the golden years of solar neutrino physics. The pioneering results of the Homestake experiment [1], which first observed neutrinos emitted by the Sun and discovered the existence of a solar neutrino deficit 111Let us recall that the Cl-Ar method of neutrino detection, used in the Homestake experiment, was first proposed in [2]., and of the Kamiokande [3], SAGE and GALLEX/GNO [4] experiments, which confirmed and extended the Homestake results on the solar neutrino deficit, were reinforced during the last four years by a series of precision measurements by the Super-Kamiokande(SK) [5], SNO [6],[7],[8] and KamLAND [9] experiments. With the recent publication of the KamLAND 766 Ty spectrum data [10] and under the plausible assumption of CPT-symmetry, for the first time a unique solution of the solar neutrino problem in terms of neutrino oscillations [11, 12] can be unambiguously identified. Let us summarize the main steps of the progress in our understanding of the solution of the solar neutrino problem, made in this past four years.
-
•
The first charged current (CC) data from SNO [6] together with absence of distortions of the spectrum of the final state in the elastic scattering reaction due to solar neutrinos, measured with a high precision in the SK experiment [5], excluded the vacuum oscillation (VO) and the small mixing angle (SMA) MSW [12] solutions in favour of the large mixing angle (LMA) MSW and LOW solutions [13, 14].
-
•
The first neutral current (NC) solar neutrino data from SNO [7], obtained by observing the solar neutrino capture on (Phase I of the experiment), provided a direct estimate of the Boron neutrino flux normalisation . It confirmed the Standard Solar Model (SSM) prediction for this quantity (the uncertainty in the experimentally determined was smaller than that in the SSM prediction). This implied that the CC rates of Cl, SK and SNO are indeed smaller than 0.5. This strongly favoured the LMA MSW solution over the LOW solution and a non-maximal solar neutrino mixing angle [15].
-
•
The convincing evidence in favour of the LMA solution was obtained in the KamLAND experiment with reactor [9], which published first results, based on statistics of 162 Ty, in December of 2002. Under the plausible assumption of CPT invariance, the suppression of the reactor flux observed in the KamLAND experiment firmly established the LMA solution, ruling out the LOW solution at about 5 level. Moreover, the 162 Ty KamLAND data on the spectrum distortion, combined with the global solar neutrino data, implied that the LMA solution was confined to two sub-regions : low-LMA (or LMA-I), centered around eV2, and high-LMA (or LMA-II) with centered around eV2. It was found that in both cases . The best-fit was in the low-LMA region, while the high-LMA region was allowed only at 99% C.L. [16, 17]
-
•
Finally the NC data from the salt phase of the SNO experiment [8], provided a more precise measurement of . The inclusion of these data in the global solar neutrino oscillation analysis reduced further the allowed region of solar neutrino oscillation parameters. Now the high-LMA region was allowed only at 2.65 level, while the maximal solar neutrino mixing was excluded at about 5 [18, 19].
One of the most important issues after these developments was the definitive resolution of the high-LMA and low-LMA solution ambiguity. This was expected to lead to a precise determination of the neutrino mass squared difference driving the solar neutrino oscillations. For this reason a study of KamLAND 410 Ty and 1000 Ty simulated spectrum data, corresponding to different points in the parameter space, spanning the low-LMA and high-LMA solution regions, was made in [18]. This study showed, in particular, that if the true KamLAND 1000 Ty spectrum data corresponded to a point in the low-LMA region, the high-LMA solution would be ruled out at 3 level by the combined solar and KamLAND data, while the low-LMA solution region will be considerably reduced. The best-fit point obtained from the analysis of the energy spectrum of the recently released 766.3 Ty data from KamLAND indeed lies inside the low-LMA region [10]. And the combined global solar and KamLAND data indeed excludes the high-LMA solution at 3 level, in agreement with the above expectation.
In this article we investigate the impact of the 766.3 Ty KamLAND spectrum data on the determination of the solar neutrino oscillation parameters. We perform first a two-neutrino oscillation analysis of the global solar neutrino and the latest KamLAND spectrum data. This permits us to quantify the improvements in the precision of determination of the solar neutrino oscillation parameters which the new KamLAND data imply and, in particular, to assess the status of the high-LMA solution. We check the stability of the allowed region of values of the solar neutrino oscillation parameters thus derived with respect to leaving out from the analysis the data from one of the solar neutrino experiments. This serves also as a check of the consistency between the data from the different experiments and gives some idea about the level of redundancy of the global solar neutrino data set. We next extend the analysis to the case of three neutrino oscillations. We derive, in particular, a new upper limit on the CHOOZ mixing angle , and study the dependence of the allowed values of the parameters and which drive the solar neutrino oscillations, on the value of . We give predictions for the CC to NC event rate ratio and day-night (D-N) asymmetry in the CC event rate, measured in the SNO experiment, for the suppression of the event rate in the BOREXINO and LowNu experiments, designed to measure the and solar neutrino fluxes. Finally, we discuss also how the precision of determination can improve with the increasing of the precision of the future SNO data, as well as, by performing a reactor oscillation experiment with a baseline km.
2 Two Flavour-Neutrino Oscillation Analysis
We first present the results of a standard two-flavor neutrino oscillation analysis. We use the 13 bin KamLAND spectrum data and define a assuming a Poisson distribution as
| (1) |
where is allowed to vary freely and is the systematic uncertainty. 222Note that several theoretical and experimental systematic errors like those due to energy scale, reactor spectrum etc. are energy dependent. However, these details being inacessibile to us, we have used the same total systematic error for all the bins. Detailed information by the KamLAND collaboration on the errors and their correlations in each bin will make our analysis more accurate. As KamLAND statistics is increased and systematics start to dominate more detailed information from the KamLAND collaboration will be an important requirement. We include the revised resolution width, fuel composition, detector fiducial mass and efficiencies from [10]. The other details of our analysis can be found in [16, 20]. Some of the reactors, particularly the Kashiwazaki-Kariwa and Fukushima I and II reactor complexes, were partially/totally shut-down during some of the period of data taking in KamLAND. We have approximately taken into account this change in the reactor flux due to the reactor shut-down using the plots showing the time variations of the number of fissions in a given reactor and hence the expected reactor flux in KamLAND [21]. We have also used the information on the reactor operation schedules available on the web [22]. In the latest version of [10], the KamLAND collaboration have identified a new source of background in the their analysis, coming from reaction induced by the decay of the radon daughter in the liquid scintillator. This increases the total background in their signal to above MeV. We include in our analysis, this new background and its associated uncertainty.
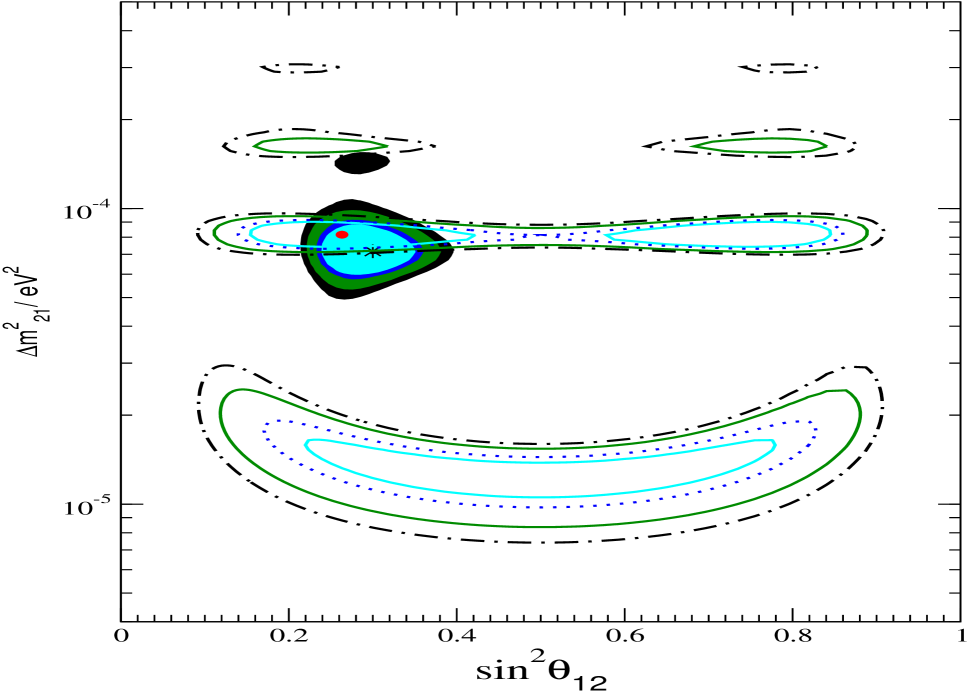
We show by the unshaded contours in Fig. 1 the allowed regions obtained using the 766.3 Ty KamLAND spectrum data. The best-fit according to our analysis is at 333 With the KamLAND results in the earlier versions of [10] which did not include the new background, the best-fit values were eV2, and . Thus, the inclusion of the new background in our analysis is seen to have changed the best-fit oscillation parameters as well as improved the goodness of fit (g.o.f). This is in agreement with what the KamLAND collaboration has obtained.
| (2) |
The best-fit value of we find agrees reasonably well with that obtained by the KamLAND collaboration [10], while our best fit value of is somewhat lower than that found in [10] because of differences in the fitting procedure and the relative insensitivity of the KamLAND data to this parameter. The regions at eV2 which were allowed by the KamLAND 162 Ty spectrum data [9], are now severely disfavored due to increased precision on the observed spectral distortion and only a very tiny area is allowed at the 3 level. Superposed on the same figure, we show by the shaded areas the allowed regions obtained using the combined solar neutrino + 162Ty KamLAND data. As it follows from this figure, the best-fit point of the new KamLAND spectrum data lies inside the allowed low-LMA region, obtained in the solar neutrino + 162 Ty KamLAND spectrum data analysis.
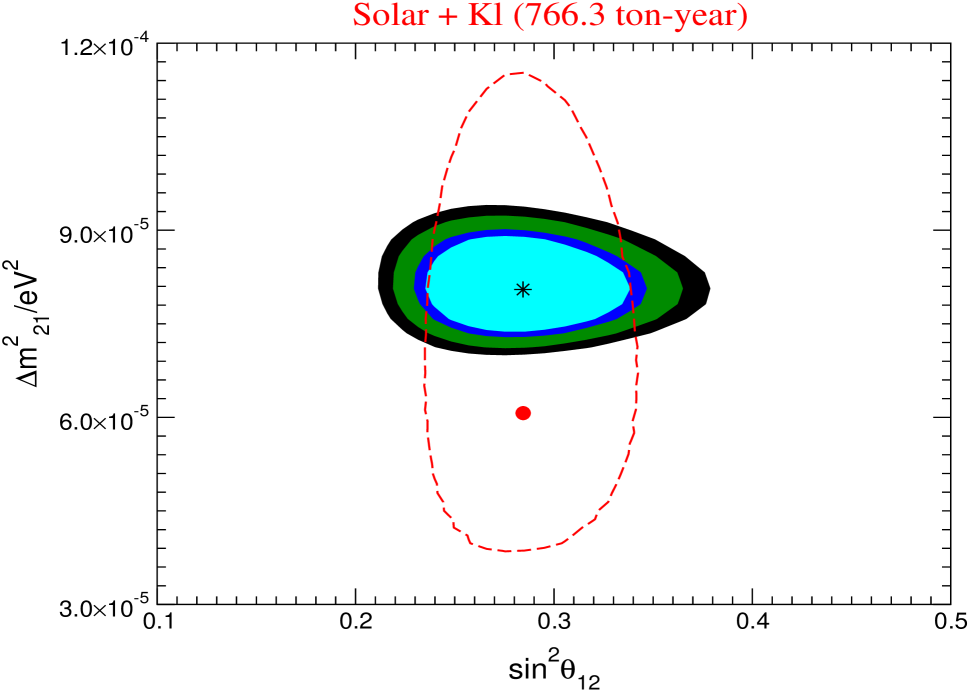
In Fig. 2 we show the allowed region obtained from the combined analysis of the global solar neutrino data and the 766.3 Ty KamLAND spectrum data. The dashed line in the figure indicates the region allowed at 90% C.L. by the global solar neutrino data alone. The star (dot) marks the best-fit point of the solar neutrino + 766.3 Ty KamLAND (solar neutrino) data. We have used in this analysis the solar neutrino data on the total event rates from the radiochemical experiments Cl [1] and Ga (Gallex, SAGE and GNO combined) [4], the 1496 day 44 bin Zenith angle spectrum data from SK [5], the combined CC, NC and Electron Scattering (ES) 34 bin energy spectrum data from the phase I ( pure phase) of SNO [7] and the data on CC, NC and ES total observed rates from the phase II (salt phase) of the SNO experiment [8].
For the combined analysis of solar and KamLAND data we define the global as
| (3) |
where
| (4) |
where are the solar data points, is the number of data points and is the inverse of the covariance matrix, containing the squares of the correlated and uncorrelated experimental and theoretical errors. The flux normalisation factor is left to vary freely in the analysis. For the other solar neutrino fluxes (, , , , ), the predictions and estimated uncertainties of the most recent standard solar model (SSM) [23] (BP04) have been utilized. For further details of our solar neutrino data analysis we refer the reader to our earlier papers [13, 15, 18].
We find that with the inclusion of the latest KamLAND spectrum data, the high-LMA region is disfavored at more than 99.9% C.L. in a 2 parameter fit. Thus, the high-LMA solution is excluded at more than 3. This establishes the low-LMA solution as unique solution of the solar neutrino problem. It also confirms our prediction [18] that, if the best-fit of the KamLAND spectrum data corresponds to a point in the low-LMA solution region, there will be no high-LMA region allowed at 3 level. The best-fit point we get from the combined solar neutrino and KamLAND data analysis is,
| (5) |
in good agreement with that obtained in [10]. Note that the best-fit point from the global solar neutrino data analysis,
| (6) |
lies outside the 3 range, allowed after including the new KamLAND data. However, the function for the solar neutrino data changes weakly when varies in an interval of values which is centered on the best fit value in eq. (6) and includes the best fit value of the global data set, eq. (5) (see Fig. 3). The best-fit value of in the global fit is controlled by the KamLAND data, whereas the best-fit value of is controlled by the global solar neutrino data. The allowed region is seen to have narrowed down considerably making it possible to plot it on a linear scale.
| Data set | (3)Range of | (3)spread in | (3) Range of | (3) spread in |
|---|---|---|---|---|
| used | eV2 | |||
| only sol | 3.0 - 17.0 | 70% | 30% | |
| sol+162 Ty KL | 4.9 - 10.7 | 37% | 30% | |
| sol+ 766.3 Ty KL | 7.0 - 9.4 | 15% | 29% |
In Table 1 we present the 3 allowed ranges of and , obtained using different data sets. We also show the uncertainty in the value of the parameters through a quantity “spread” which we define as
| (7) |
where denotes the parameter or , and and are the maximal and minimal values of the chosen parameter allowed at a given C.L. Table 1 illustrates the remarkable sensitivity of the KamLAND experiment to , which results in stringent constraints on the allowed values of . However, the KamLAND experiment does not constrain the allowed range of much better than the solar neutrino experiments.
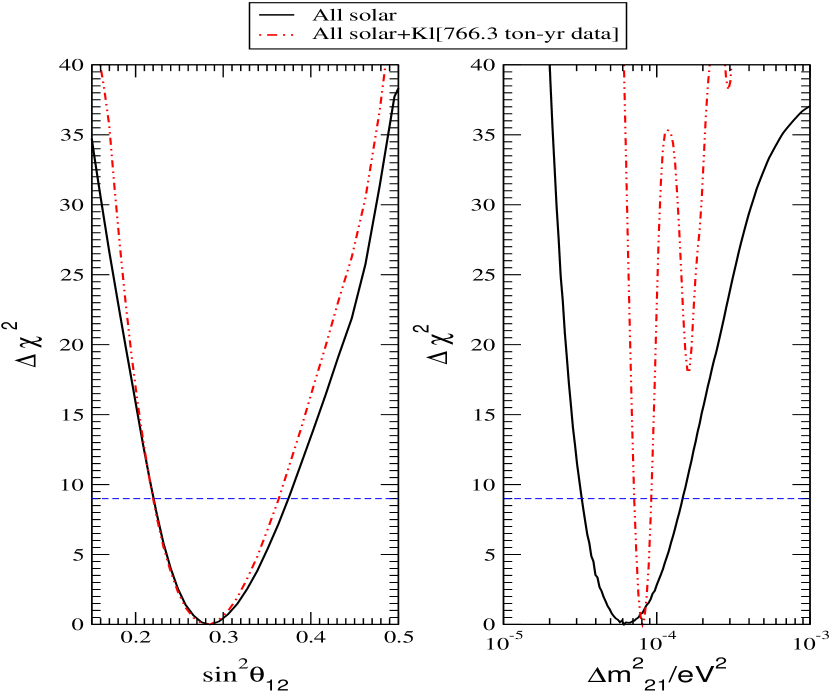
So far we have given the allowed regions of and , obtained from the two parameter fits of the data. It is instructive to see the bounds on the oscillation parameters using one parameter plots of vs. and vs. . In Fig. 3 we show the dependence of on (left hand panel) and on (right hand panel) after marginalising over the remaining free parameters. In this analysis only the solar neutrino data, and the solar neutrino + 766.3 Ty KamLAND spectrum data have been used. We find that the allowed range of values becomes much narrower compared to that obtained using only the global solar neutrino data. The inclusion of the recent KamLAND results makes the for the high-LMA region even larger, excluding it at more than 4 for a one parameter fit. From this figure we also see that the best-fit value of , obtained from the global solar neutrino data, has a , and hence is disfavored at . The inclusion of the new KamLAND spectrum data disfavors maximal solar neutrino mixing to a greater degree. The value at is a little above 40, thereby excluding the maximal mixing at more than 6 for a one parameter fit. Figure 3, showing the dependence of on , corroborates our results presented in Table 1, namely, that the allowed range of does not change considerably up to the level with the inclusion of the new KamLAND results. The reason for this can be traced to the fact that for the values of and allowed by the combined solar neutrino and KamLAND data, the Earth matter effects are negligible at the baselines relevant for the KamLAND experiment and the relevant survival probability reads:
| (8) |
where denotes the oscillation length,
| (9) |
On the other hand, if we neglect the Earth matter effects in the solar neutrino transitions, which are rather small, the survival probability relevant for the interpretation of the data of the SNO and SK solar neutrino experiments, is given by the adiabatic MSW prediction [12]
| (10) |
Since is a less sensitive function of compared to , the survival probability relevant for the interpretation of the KamLAND data is less sensitive to than that measured at SNO. Moreover, the average energy measured at KamLAND ( MeV), and the average source-detector distance for KamLAND ( km), correspond to for the best-fit . At , the survival probability has a maximum (SPMAX). This means that the coefficient of the term in is relatively small, preventing the KamLAND experiment to reach high precision in the determination of . Evidently, the sensitivity to can be improved by reducing the baseline length to , corresponding to a minimum of the survival probability (SPMIN) [24]. We shall come back to this point later.
3 Consistency Check between Different Experiments
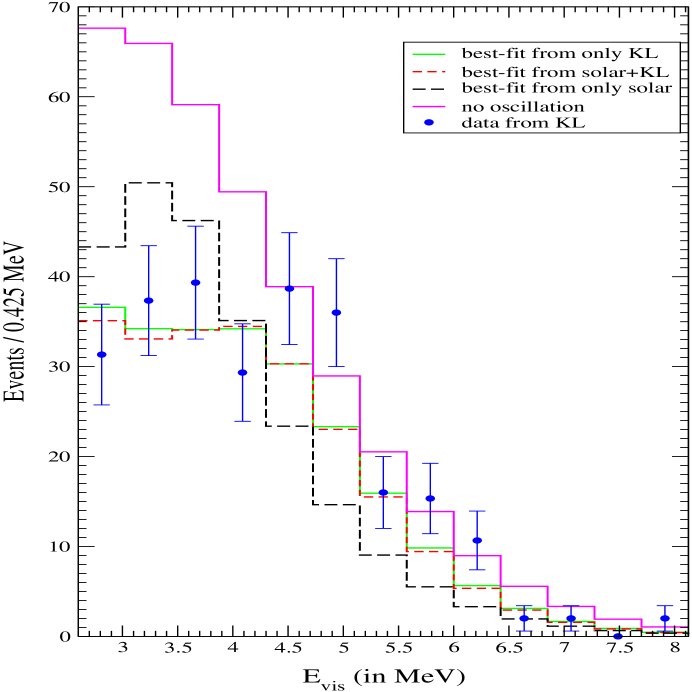
In this Section we check the consistency between the allowed regions obtained using data from different experiments. In Fig. 4 we compare the KamLAND spectrum data with the predictions for the spectrum obtained for values of and corresponding to the i) solar neutrino data best-fit point, ii) KamLAND spectrum data best-fit point, and iii) solar neutrino +KamLAND spectrum data best-fit point. We also show the unoscillated spectrum obtained by us. This agrees fairly well with that given by the KamLAND collaboration in [10] indicating that we have correctly implemented the reactor power and operation schedules from the availbale sources. This figure clearly illustrates the sensitivity of the predicted spectrum to , and the deviations of the observed spectrum from that predicted at the solar neutrino data best-fit point.
| Experiment | Observed rate/BP04 prediction | Predicted Rate | Predicted Rate |
|---|---|---|---|
| at global best-fit | at solar best-fit | ||
| Ga | 0.546 | 0.538 | |
| Cl | 0.350 | 0.346 | |
| SK(ES) | 0.395 | 0.396 | |
| SNO(CC) | 0.291 | 0.290 | |
| SNO(ES) | 0.387 | 0.387 | |
| SNO(NC) | 0.879 | 0.903 |
In the absence of the KamLAND results, it was necessary to compare the “low” and “high” energy CC solar neutrino data to determine , and to compare the CC and NC data to determine . With determined using the new KamLAND results, one can make a consistency check by dispensing with the data from anyone of the solar neutrino experiments.
In Fig. 5 we present the allowed regions obtained by taking out the data from one solar neutrino experiment from the global data set. As before we let the flux normalisation vary freely in the analysis. The figure shows that the allowed region is robust and does not change considerably when the data from one experiment is left out of the analysis. Taking out the SNO data will lead to smaller values of , and correspondingly larger values of being allowed. Using the 162 Ty KamLAND data and taking out the SNO results from the analysis, made the maximal mixing solution allowed [25]. With the 766.3 Ty KamLAND data included in the analysis, the maximal mixing is ruled out at 3 even leaving out the SNO data from the data set used in the analysis. This is a consequence of the increased precision of the KamLAND data which disfavours the maximal mixing solution.
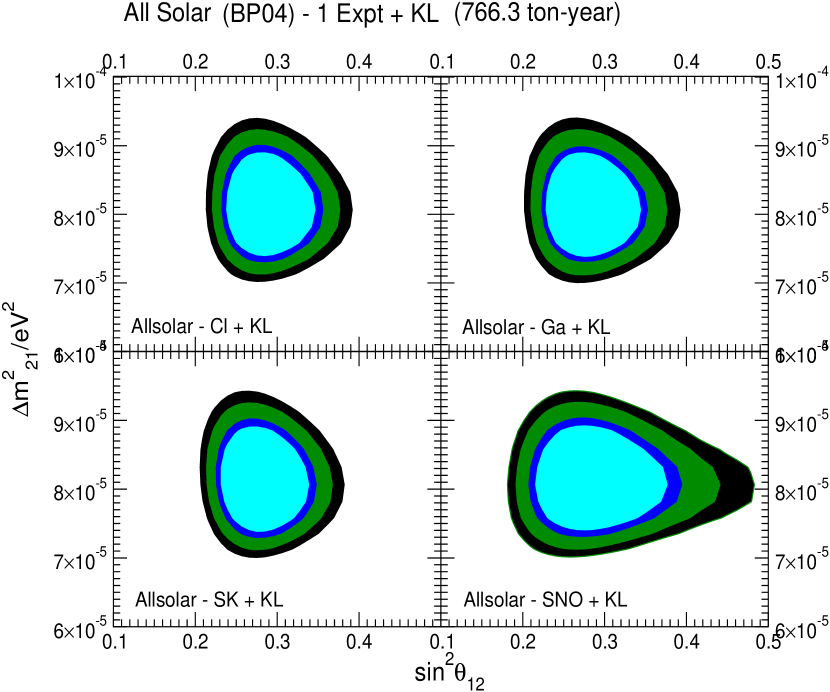
In Table 2 we compare the observed event rates in the different solar neutrino experiments with those predicted for the best fit values of and , obtained in the analysis of the global solar neutrino data and global solar neutrino + KamLAND spectrum data. Note that the SNO NC event rate relative to the SSM prediction of BP04 is , while its earlier central value, with respect to the SSM prediction of BP00, was slightly above 1. This drop simply reflects the increase in the central value of the flux from cm to cm in the latest SSM of BP04 [23]. There is a corresponding drop in the other experimental rates shown in Table 2. However, this renormalisation has no effect on our results since we have not used SSM prediction for the normalisation of the flux. Instead we have left as a free parameter to be determined by the solar neutrino data. This parameter is primarily determined by the NC event rate measured in SNO. We see from Table 2 that all the measured event rates, except that observed in the Cl experiment, are in very good agreement with the predicted ones. There is very little difference between the predictions, corresponding to the solar neutrino data and solar neutrino + KamLAND spectrum data best-fit points. This shows the insensitivity of the fit of the solar neutrino data to small variations in , in contrast to the fit of the KamLAND spectrum data. Note that the obtained Cl rate is by 2 lower than the global best-fit prediction. This is a statistically small but well known deviation which cannot be explained by the LMA solution [26]. If such a deviation is confirmed by future intermediate energy solar neutrino experiments like Borexino, it will call for some additional subdominant mechanism of solar neutrino transitions.
4 Three Flavour Neutrino Mixing Analysis
In this Section we present results obtained from the analysis of the global data on solar and reactor neutrinos within a three-flavor neutrino mixing framework. In this case and . The best-fit value of , obtained in the latest two-neutrino mixing analysis of the Super-Kamiokande atmospheric neutrino data on the Zenith-angle distribution of the like events is 2.1 eV2 [27]. Thus, the two-neutrino mixing analyses of the solar and atmospheric neutrino data indicate that . Under this approximation the effect of the third heaviest neutrino in the relevant solar neutrino and reactor anti-neutrino survival probabilities is due mainly to the mixing angle . The relevant and survival probabilities in the three-neutrino mixing cases of interest are given by the following expression:
| (11) |
where is the or survival probability in the case of two-neutrino mixing (see, e.g., [29]). For solar neutrinos, is the two-neutrino mixing survival probability [30] with the solar electron number density replaced by . In the case of KamLAND experiment one has , where is given by eq. (8) in which .
Strong constraints on the value of have been obtained in the CHOOZ and Palo Verde reactor antineutrino experiments [28]. We include the CHOOZ results in our three-flavour neutrino mixing analysis (see also [31]). In the limit of , the probability relevant for the interpretation of the CHOOZ data is given by
| (12) |
We note that depends on , while and depend on .
We allow to vary freely within the range ( eV2, obtained using the one parameter vs fit of the SK atmospheric neutrino Zenith angle data, presented by the SK Collaboration at the Neutrino 2004 International Conference [27] 444The allowed range of depends crucially on the allowed range of the atmospheric mass squared difference [25]., and perform a combined three-neutrino oscillation analysis of the global solar neutrino and reactor anti-neutrino data, including both the KamLAND and CHOOZ results. The best-fit values of the parameters obtained from the three-flavor neutrino mixing analysis are:
| (13) |
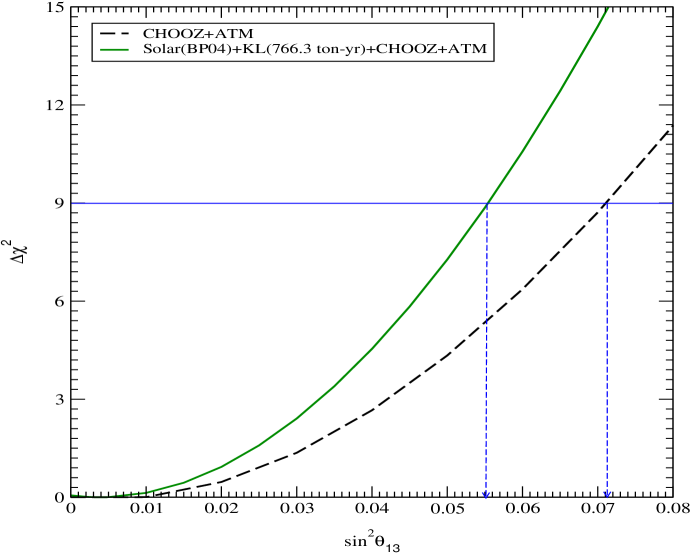
In Fig. 6 we present the as a function of , for allowed to vary within its 3 allowed range [27], eV2, and the other parameters allowed to vary freely. The bounds on , obtained from CHOOZ data analysis, can be directly read from the figure for a one parameter fit as . The bound derived from the combined analysis of the solar neutrino, CHOOZ and KamLAND data is .
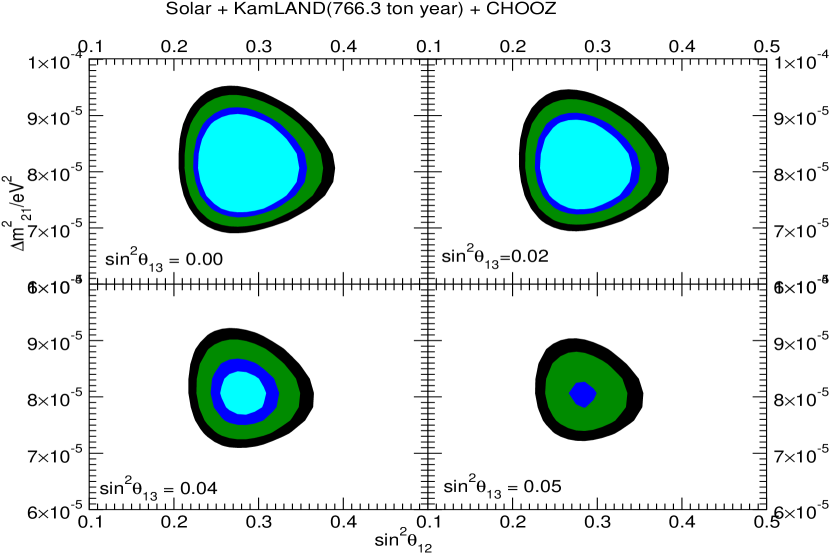
In Fig. 7 we show the allowed regions in the plane for four fixed values of . We note that although the presence of a small non-zero can improve the fit in the regions of the parameter space with higher values of [18], i.e., in the high-LMA zone, the new KamLAND data are able to exclude the high-LMA region at more than 3 even in the presence of a third generation in the mixing, indicating the robustness of the low-LMA solution.
5 Future Projections
The recent KamLAND data combined with the solar neutrino data unambiguously determine the low-LMA solution as unique solution of the solar neutrino problem. It also enables us to determine with a relatively high precision: 10% at 90% C.L. The high-LMA solution is disfavored at more than 3. The uncertainty in the value of is expected to diminish further as KamLAND collects more data. However, as we have stressed before, the KamLAND experiment does not appreciably reduce the error on the value of [24].
In the near future, the SNO collaboration is expected to publish data on the CC () day/night spectrum, observed during the salt phase of the experiment. The recent KamLAND results allow us to make relatively precise predictions for the the day-night asymmetry in the SNO experiment:
| (14) |
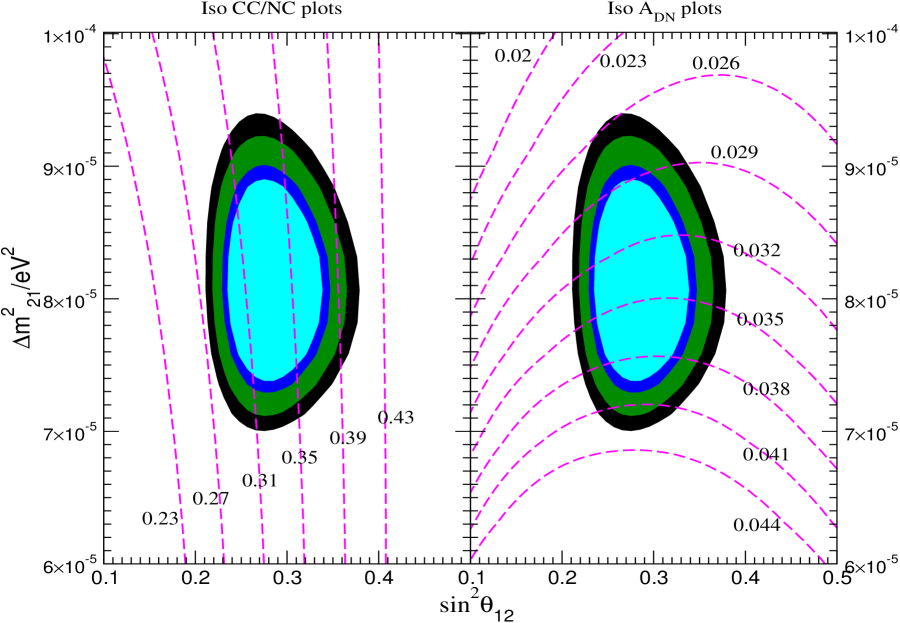
In the right hand panel of Fig. 8 we show the lines of constant values in the plane for the SNO experiment (see also, e.g., [32, 33]). The predicted in SNO for the current best-fit values of the parameters and the corresponding range, are given by:
| (15) |
The published SNO result on the D/N asymmetry is . Thus, the error has to be reduced to in order to observe at 3 level.
In the left hand panel of the same figure we also plot the iso-CC/NC contours for SNO. The measured value of the CC to NC ratio from the salt phase of SNO experiment is,
| (16) |
The phase III of SNO will collect neutral current data using Helium counters [34]. This would give a totally uncorrelated information on the CC and NC event rates observed in SNO and a reduced error for the NC event rate. The projected total error for the observed NC event rate for this phase is 6% [34]. For the CC event rate we assume that the statistical error during the phase III would be approximately the same as in each of the earlier two phases, while the systematic error is taken to be 4.5%, i.e., slightly smaller than the 5% reported in phases I and II of SNO. Thus, we assume that the total error in CC event rate measurement from all the three phases combined will be about 5%. If the central value of the CC and NC event rate ratio would remain the same as observed in the salt phase, the CC/NC ratio expected to be measured in the phase III of the SNO experiment would be
| (17) |
Since for the CC/NC ratio in SNO is mainly related to the solar neutrino mixing angle (see, e.g., ref. [33], eq. (10) and the left hand panel in Fig. 8), the reduction in the error is expected to result in an improvement in the precision of determination. We have made a projected analysis of the global solar neutrino data, including the upgraded CC and NC errors expected from the phase III of the SNO experiment. The range of allowed values of could be reduced to about at 99% C.L. (99.73% C.L.), corresponding to a spread of [35].
There has been a recent proposal of adding 0.1% gadolinium to the water in the Super-Kamiokande detector to improve the detector sensitivity to neutrons [36]. This would result in a remarkable increase in the detector sensitivity to low energy , transforming SK into a huge reactor antineutrino detector (SK-Gd), with an event rate that is about 43 times larger than that observed in KamLAND [36, 35]. After 5 years of data taking, the SK-Gd experiment can measure with and with uncertainty at 99% C.L. [35].
As discussed earlier, a very precise measurement of can be achieved in a reactor experiment with a baseline corresponding to an SPMIN of the survival probability [24]. The condition for SPMIN is m. For the low-LMA solution region and the average energy of the observed in the KamLAND experiment, this corresponds to a distance of approximately (50 - 70) km [24]. For an experiment with a 70 km baseline and 24.3 GW (18.6 GW) reactor power, corresponding to the Kashiwazaki (Daya Bay) complex in Japan (China), can be determined with a error at 99% C.L. with a 3 kTy (4 kTy) statistics [24].
The forthcoming solar neutrino experiments are Borexino [37] and KamLAND-, which will provide an accurate measurement of the neutrino flux, and the Low energy solar Neutrino (LowNu) experiments [39, 38], which are designed to measure the flux of solar neutrinos. The potential of Borexino and any generic LowNu experiment [40] in constraining the solar neutrino oscillation parameters have been studied recently in [24, 41]. For the allowed regions obtained in this paper, we find the predicted rates for Borexino and LowNu experiments to be
| (18) | |||||
| (19) |
6 Conclusions
We have investigated the implications of including the recent KamLAND spectrum data in global solar neutrino oscillation analysis. The observed spectral distortion in the KamLAND experiment firmly establishes to lie in the low-LMA solution region. The high-LMA solution is excluded at more than 4 by the global solar neutrino and KamLAND spectrum data. The maximal solar neutrino mixing is ruled out at level. We have found that the allowed region in the plane remains remarkably stable even when we leave out the data from one of the solar neutrino experiments from the global fit. Likewise, there is practically no increase in the allowed region when one goes from two to three flavor neutrino oscillation analysis of the global solar neutrino and KamLAND spectrum data. The upper limit on was found to be . We have derived predictions for the CC to NC event rate ratio and day-night (D-N) asymmetry in the CC event rate, measured in the SNO experiment, and for the suppression of the event rate in the BOREXINO and LowNu experiments, designed to measure the and solar neutrino fluxes. With the value of determined more precisely using the current solar neutrino and KamLAND data, the predicted range of possible values of the day-night asymmetry in the CC event rate at SNO narrows down to (0.025 - 0.041) at 99.73% C.L. Remarkably high precision in the measurement of can be achieved with the Super-Kamiokande detector loaded with 1% gadolinium: this would transform Super-Kamiokande into a huge reactor detector (SK-Gd) with an event rate 43 times larger than that observed in the KamLAND experiment. Finally, we have discussed how the precision of determination can improve with the increasing of the precision of the future SNO data, by the SK-Gd reactor oscillation experiment, as well as, by performing a reactor oscillation experiment with a baseline of km.
With the publication of the latest KamLAND data the neutrino oscillation origin of the observed solar neutrino deficit is firmly established. The future high precision measurements of the solar neutrino oscillation parameters will be of fundamental importance for understanding the true origin of the flavour neutrino mixing.
S.G. and D.P.R. would like to thank respectively SISSA and The Abdus Salam International Centre for Theoretical Physics for hospitality. This work was supported by the Italian INFN under the program “Fisica Astroparticellare” (S.T.P.).
References
- [1] B. T. Cleveland et al., Astrophys. J. 496, 505 (1998).
- [2] B. Pontecorvo, Chalk River Lab. report PD–205, 1946.
- [3] Y. Suzuki, Nucl. Phys. Proc. Suppl. 38 (1995) 54.
- [4] J. N. Abdurashitov et al. [SAGE Collaboration], J. Exp. Theor. Phys. 95, 181 (2002) [Zh. Eksp. Teor. Fiz. 122, 211 (2002)] [arXiv:astro-ph/0204245]; W. Hampel et al. [GALLEX Collaboration], Phys. Lett. B 447, 127 (1999); C. Cattadori, Talk at Neutrino 2004, Paris, France, June 14-19, 2004.
- [5] S. Fukuda et al. [Super-Kamiokande Collaboration], Phys. Lett. B 539, 179 (2002) [arXiv:hep-ex/0205075].
- [6] Q. R. Ahmad et al. [SNO Collaboration], Phys. Rev. Lett. 87, 071301 (2001) [arXiv:nucl-ex/0106015].
- [7] Q. R. Ahmad et al. [SNO Collaboration], Phys. Rev. Lett. 89, 011301 (2002) [arXiv:nucl-ex/0204008]; Q. R. Ahmad et al. [SNO Collaboration], Phys. Rev. Lett. 89, 011302 (2002) [arXiv:nucl-ex/0204009].
- [8] S. N. Ahmed et al. [SNO Collaboration], arXiv:nucl-ex/0309004.
- [9] K. Eguchi et al. [KamLAND Collaboration], Phys. Rev. Lett. 90, 021802 (2003) [arXiv:hep-ex/0212021].
- [10] T. Araki et al. [KamLAND Collaboration], arXiv:hep-ex/0406035 version 3.
- [11] B. Pontecorvo, Zh. Eksp. Teor. Fiz. 33 (1957) 549 and 34 (1958) 247; Zh. Eksp. Teor. Fiz. 53 (1967) 1717.
- [12] L. Wolfenstein, Phys. Rev. D 17, 2369 (1978) ; S. P. Mikheev and A. Y. Smirnov, Sov. J. Nucl. Phys. 42 (1985) 913 [Yad. Fiz. 42, 1441 (1985)].
- [13] A. Bandyopadhyay, S. Choubey, S. Goswami and K. Kar, Phys. Lett. B 519, 83 (2001) [arXiv:hep-ph/0106264].
- [14] G.L. Fogli, E. Lisi, D. Montanino, A. Palazzo, Phys. Rev. D64, 093007 (2001); J.N. Bahcall, M.C. Gonzalez-Garcia, C. Pana-Garay, JHEP 0108, 014 (2001); P. I. Krastev and A. Y. Smirnov, Phys. Rev. D 65, 073022 (2002) [arXiv:hep-ph/0108177]; M.V. Garzelli and C. Giunti, JHEP 0112, 017 (2001).
- [15] A. Bandyopadhyay, S. Choubey, S. Goswami and D. P. Roy, Phys. Lett. B 540, 14 (2002) [arXiv:hep-ph/0204286]; S. Choubey, A. Bandyopadhyay, S. Goswami and D. P. Roy, arXiv:hep-ph/0209222 and references therein.
- [16] A. Bandyopadhyay, S. Choubey, R. Gandhi, S. Goswami and D. P. Roy, Phys. Lett. B 559, 121 (2003) [arXiv:hep-ph/0212146].
- [17] G. L. Fogli et al., Phys. Rev. D 67, 073002 (2003) [arXiv:hep-ph/0212127]; M. Maltoni, T. Schwetz and J. W. Valle, Phys. Rev. D 67, 093003 (2003) [arXiv:hep-ph/0212129]; J. N. Bahcall, M. C. Gonzalez-Garcia and C. Pena-Garay, JHEP 0302, 009 (2003) [arXiv:hep-ph/0212147]; H. Nunokawa, W. J. Teves and R. Zukanovich Funchal, Phys. Lett. B 562, 28 (2003) [arXiv:hep-ph/0212202]; P. Aliani et al., arXiv:hep-ph/0212212; P. C. de Holanda and A. Y. Smirnov, JCAP 0302, 001 (2003) [arXiv:hep-ph/0212270].
- [18] A. Bandyopadhyay, S. Choubey, S. Goswami, S. T. Petcov and D. P. Roy, Phys. Lett. B 583, 134 (2004) [arXiv:hep-ph/0309174].
- [19] G. L. Fogli, E. Lisi, A. Marrone and A. Palazzo, Phys. Lett. B 583, 149 (2004) [arXiv:hep-ph/0309100]. P. C. de Holanda and A. Y. Smirnov, Astropart. Phys. 21, 287 (2004) [arXiv:hep-ph/0309299].
- [20] A. Bandyopadhyay, S. Choubey, R. Gandhi, S. Goswami and D. P. Roy, J. Phys. G 29, 2465 (2003) [arXiv:hep-ph/0211266].
- [21] G.A. Horton-Smith, talk at Neutrino Oscillations in Venice, December 3-5, 2003, Venice, Italy; http://axpd24.pd.infn.it/NO-VE/NO-VE.html
- [22]
- [23] J. N. Bahcall and M. H. Pinsonneault, Phys. Rev. Lett. 92, 121301 (2004) [arXiv:astro-ph/0402114].
- [24] A. Bandyopadhyay, S. Choubey and S. Goswami, Phys. Rev. D 67, 113011 (2003) [arXiv:hep-ph/0302243].
- [25] S. Goswami, talk at Neutrino 2004, Paris, http://neutrino2004.in2p3.fr
- [26] S. Choubey, S. Goswami and D. P. Roy, Phys. Rev. D 65 (2002) 073001 [arXiv:hep-ph/0109017]; S. Choubey, S. Goswami, N. Gupta and D. P. Roy, Phys. Rev. D 64 (2001) 053002 [arXiv:hep-ph/0103318].
- [27] E. Kearns, talk at Neutrino 2004, Paris, http://neutrino2004.in2p3.fr.
- [28] M. Apollonio et al., Phys. Lett. B466 (1999) 415; F. Boehm et al., Phys. Rev. D62 (2000) 072002.
- [29] S.T. Petcov, Phys. Lett. B 214, 259 (1988).
- [30] S.T. Petcov, Phys. Lett. B 200, 373 (1988), and Phys. Lett. B 214, 139 (1988); S.T. Petcov and J. Rich, Phys. Lett. B 224, 401 (1989); P.I. Krastev and S.T. Petcov, Phys. Lett. B 207, 64 (1988); E. Lisi et al., Phys. Rev. D 63, 093002 (2000).
- [31] S.M. Bilenky, D. Nicolo and S.T. Petcov, Phys. Lett. B538 (2002) 77.
- [32] M. Maris and S. T. Petcov, Phys. Rev. D 62 (2000) 093006 [arXiv:hep-ph/0003301].
- [33] M. Maris and S. T. Petcov, Phys. Lett. B 534 (2002) 17 [arXiv:hep-ph/0201087].
- [34] Kevin Graham, talk at NOON 2004, February 11-15, 2004, Tokyo, Japan, http://www-sk.icrr.u-tokyo.ac.jp/noon2004/; H. Robertson for the SNO Collaboration, Talk given at TAUP 2003, Univ. of Washington, Seattle, Washington, September 5 - 9, 2003, http://mocha.phys.washington.edu/taup2003
- [35] S. Choubey and S. T. Petcov, Phys. Lett. B 594, 333 (2004) [arXiv:hep-ph/0404103].
- [36] J. F. Beacom and M. R. Vagins, arXiv:hep-ph/0309300.
- [37] G. Alimonti et al. [Borexino Collaboration], Astropart. Phys. 16, 205 (2002) [arXiv:hep-ex/0012030].
- [38] R. S. Raghavan, Talk given at the Int. Workshop on Neutrino Oscillations and their Origin (NOON2004), February 11 - 15, 2004, Tokyo, Japan; for further information see the web-site: http://www.phys.vt.edu/ kimballton/ .
- [39] M. Nakahata, Talk given at the Int. Workshop on Neutrino Oscillations and their Origin (NOON2004), February 11 - 15, 2004, Tokyo, Japan.
- [40] S. Schönert, talk at Neutrino 2002, Munich, Germany, (http://neutrino2002.ph.tum.de).
- [41] J. N. Bahcall and C. Pena-Garay, JHEP 0311, 004 (2003) [arXiv:hep-ph/0305159].