Partial Wave Analysis of
Abstract
A partial wave analysis of PS185 data for is presented. A cusp is identified in the inverse process at threshold, using detailed balance to deduce cross sections from . Partial wave amplitudes for , , and exhibit a behaviour very similar to resonances observed in Crystal Barrel data. With this identification, the data then provide evidence for a new , resonance with mass MeV, MeV, coupling to both and .
D.V. Bugg,
Queen Mary, University of London, London E1 4NS, UK
1 Introduction
The PS185 collaboration has made extensive measurements of at LEAR. Integrated cross sections have been measured at fine steps of momentum close to the threshold [1-4]; Ref. [4] summarises results. Differential cross sections extend up to 1990 MeV/c. The decays of and analyse their polarisation and measure spin correlations , , and [5]. Data from a polarised target provide further measurements with target polarisation normal to the scattering plane [6].
An early partial wave analysis close to threshold was made by Tabakin et al. [7]. The objective here is to extend the partial wave analysis over the whole momentum range, including polarised target data.
There are six spin dependent amplitudes for [8], one more than for and elastic scattering, where particles in initial and final states are identical. There are 6 further measurements from the polarised target. Firstly the asymmetry from the polarised target is different to because the nucleon and are different particles. Secondly, there are rather precise measurements of spin transfer parameters and . Thirdly, the triple spin parameters , and are independent measurements. Here, the first suffix refers to the beam, which is unpolarised, the second refers to the target proton, the third refers to the and the fourth refers to the . Further measurements of and are redundant. Paschke and Quinn [9] show that , although both sets of data can be included in the analysis, to improve statistics. Also ; the latter is much better determined than .
There is then a chance of determining the six amplitudes up to an overall unmeasurable phase. In principle eleven sets of data are sufficient providing they explore all amplitudes in an ideal way. In practice, it turns out that the determination is almost unique at 1637 MeV/c, the only momentum where polarised target data are available. There are some minor reservations concerning relative branchings to and and between and . It is necessary to apply a mild constraint to partial wave amplitudes for and , in order to prevent them drifting to large values. It is also necessary to make the simplifying assumption that, away from 1637 MeV/c, and amplitudes are related to by simple centrifugal barrier factors. In the limited mass range over which data are available, these are mild assumptions, which have little effect on the determination of other partial waves.
The available mass range extends only 200 MeV above the threshold. Resonances typically have widths of 250 MeV, so it is difficult to establish the presence of resonances from PS185 data alone. Nonetheless, results can be compared with analyses of Crystal Barrel and PS172 data having the same quantum numbers. In those data, a mass range of 500 MeV is available. For , , there are seven sets of data from these two experiments for final states , , , , , and ; in addition there is some information from the production procss . From those extensive data, many resonances are observed with securely determined parameters [10]. It is of interest to see if those resonances corresponds to structures observed in . That is quite likely, in the same way that resonances appear in both and channels.
2 A cusp at the threshold
Fig. 1(a) shows integrated cross sections very close to threshold for . The curve shows the S-wave intensity deduced later from the partial wave analysis; the remaining intensity comes from P-waves in this mass range.

The cross section for the inverse process may be derived using detailed balance:
| (1) |
Here, and are momenta of and in the centre of mass frame. Fig. 1(b) shows the resulting cross sections for . There is a cusp at threshold, first reported in Ref. [11]. Cusps are in principle well known, but are not often seen, so this case is interesting.
The cusp is a feature of S-waves. The curve shows the fitted S-wave intensity; in this mass range, the difference from data is purely due to P-waves. These P-waves are surprisingly strong near threshold, but are very well determined from polarisations and forward-backward asymmetries in differential cross sections (Fig. 2 below). The PS185 collaboration makes the reasonable conjecture that the S-wave is strongly absorbed into other open channels, whereas in this mass range P-waves are highly peripheral and therefore suffer little attenuation from annihilation. Up to 6 MeV, P-waves have momenta MeV/c, and therefore a classical impact parameter fm.
The curve follows the familiar law of thermal neutron physics. The dependence is verified in Fig. 1(c), where is plotted after subtracting off the contributions from P-waves.
It will be useful to exhibit the origin of the cusp assuming there is an S-wave resonance, which will be fitted later to the data. The result is however quite general and is derived in the textbook of Landau and Lifshitz [12]. For an S-wave resonance, the partial wave amplitude is
| (2) |
where ; the term in the denominator will be discussed below. Since and near threshold,
| (3) |
The amplitude for elastic scattering is
| (4) |
Apart from a slow energy dependence from , the amplitude goes to a constant at threshold, namely the scattering length . The amplitude for is
| (5) |
and is proportional to at threshold. The intensity , apart from the slowly varying factor . This is the origin of the law.
At threshold there is a step in . Associated with this step is a rapid variation of , i.e. a dispersive effect. For a resonance, of eqn. (3) is given [13] by
| (6) |
where a subtraction is made on resonance. This formula will be used in fitting an S-wave resonance to the data.
For higher partial waves, the centrifugal barrier makes cusp effects negligible.
3 Data and analysis procedures
Figs. 2–9 show the PS185 data, together with fits described here.


3.1 Formulae for Observables and Partial wave amplitudes
Elchikh and Richard [8] show that six amplitudes are needed to describe . Formulae for observables are readily adapted from the well known expressions for elastic scattering [14]. They have also been written down by Paschke and Quinn [9]. However, one needs to be aware that Paschke and Quinn quantise along the same axes for initial and final states. Suppose the -axis is taken normal to the scattering plane, along the beam direction and sideways in the plane of scattering. For spin transfer parameters, the expressions of Paschke and Quinn describe observables such as , with and in the same direction for initial and final states. The PS185 collaboration uses for the initial state the same axes . However, for the final state, they use axes , and with along the direction of the final . It is necessary to allow for the rotation of spins through the scattering angle between initial and final states. For triplet states, this involves a simple projection of spins as vectors from one set of axes to the other. For singlet states, the rotation of axes has no effect.
3.2 Parametrisation of Partial Wave Amplitudes
Partial wave amplitudes need to include three standard factors: (a) the flux factor for the centre of mass momentum in the channel, (b) the relativistic phase space factor for the channel and the factor for , (c) Blatt-Weiskopf centrifugal barrier factors for both and channels [15]; they give the required dependence near threshold on angular momentum and momentum is the channel. The product of these three factors will be written as . Then partial wave amplitudes for spin , angular momemta and in intial and final states are written:
| (7) |
where are analytic funcions. Note that the factor must be factored out in order to avoid branch cuts below threshold.
Data at 1637 MeV/c are adequate to give a unique set of partial waves. At other momenta, the analysis reveals quickly that the transition amplitude is well determined by the polarisations of and . The data are consistent with the same -dependence for this amplitude as for , except for the centrifugal barrier factor for the D-wave. The radius of the centrifugal barrier optimises at fm. To simplify the analysis, the amplitude is parametrised with coupling constant and the transition amplitude is parametrised with coupling constant , where is a complex constant.
The separation between and initial states is sensitive only to polarised target data. Therefore, the amplitude is parametrised with coupling constant , and it is necessary to assume that does not vary with . The same is true for the amplitude which is fitted with coupling constant with constant. Physically, the implication is that the branching ratio of does not change with mass. These assumption are of little consequence at low momenta because the centrifugal barrier suppresses the amplitude near threshold for initial D-states.
Partial waves for , and are treated in the same way. Care is needed even at 1637 MeV/c in handling the amplitude for . With present data, the separation of the four amplitudes, abbreviated as , , and , is the weakest link in the entire analysis. The amplitude is small and not a matter for concern. The amplitude is well determined by polarisations of and and differential cross sections. However, the amplitude shows some tendency to drift upwards in magnitude with only a small change in . The problem is cured by including into a weak penalty function which limits its magnitude. The penalty function adds to a term
and the denominator is adjusted so that this term contributes 9 to . This technique allows to grow if the data really demands it, but constrains it from running away with little change in . Below 1637 MeV/c, the fit is insensitive to this restriction, but above 1637 MeV/c, there may be some sensitivity. Further data from a polarised target at high momentum would solve this possible problem.
For and , contributions from
, and
are
negligible because of centrifugal barriers in .
Both the inverse amplitudes and
are definitely required. Surprisingly, the
is also definitely required; amplitudes are negligible.
| Amplitude | Change in |
|---|---|
| 1894 | |
| 271 | |
| 56 | |
| 50 | |
| 98 | |
| 248 | |
| 1337 | |
| 69 | |
| 749 | |
| 34 | |
| 51 | |
| 681 | |
| 177 | |
| 242 | |
| 684 | |
| 111 | |
| 108 | |
| 15 | |
| 25 |
Table 1 shows changes in when partial waves are removed from the final fit one by one and remaining amplitudes are re-optimised. The singlet partial waves and are very small, as the PS185 collaboration found earlier. Any partial waves affecting by are eliminated.
The initial fits take to be constants (where possible) or linear with , except for the threshold cusp. In no case does the phase decrease with . In several partial waves, large linear terms were required, producing phase variations of order . An empirical linear fit to the phase begs the question where the phase originates. It rapidly became apparent that better fits could be obtained by allowing a resonant phase variation in some partial waves.
A resonance with a large width gives an essentially linear phase variation. Therefore the final analysis uses constant amplitudes plus a resonant form for all partial waves, though allowing the resonance width to go to a large value if the data prefer the linear phase variation. This allows a rather flexible parametrisation of the -dependence.
In the final fit, the cusp in the amplitude is fitted by taking the amplitude
| (8) | |||||
| (9) |
and taking from eqn. (6). The magnitude of the constant C in the width is adjusted so as to reproduce the observed total intensity of the and partial waves, and using the same C for coupling to and .
4 Results
The of the fit is 1377 for 1201 data points and 61 fitted parameters. This is a similar quality of fit to partial wave analyses of elastic scattering data.
A technical detail is that normalisations of each set of differential cross sections and integrated cross sections are varied in accordance with their published normalisations. This smooths out some scatter amongst the points, but has negligible effect on fitted amplitudes. It turns out to be unnecessary to allow normalisations of polarisation data to adjust in this way.

Fig. 10 shows the intensities of each partial wave in the integrated cross section. They are plotted against the mass above the threshold: . These intensities contain , i.e. the flux and phase space factors and centrifugal barriers.
It is more instructive to view , where the kinematic factor is omitted. These are shown in Fig. 11. One further factor is also removed. Each amplitude has Clebsch-Gordan coefficients which affect the contributions to integrated cross sections. These factors are listed in Table 2 and are also factored out in drawing Fig. 11. The results shows matrix elements squared, unencumbered by kinematic factors or spin-coupling factors.

| Amplitudes | spin factors |
|---|---|
| , | 3 |
| , | 3/5 |
| 1/3 | |
| , , , | 1 |
| , | 5/3 |
| , | 5/7 |
| 7/5 | |
| 9/7 | |
| 7/9 |
A question is how reliable these intensities are. A general conclusion is that the final angular momentum state is well determined by polarisations in the final state. Hence and intensities are well determined. In a variety of fits with different combinations of amplitudes and different assumptions for the fitting functions and centrifugal barriers, fluctuations are observed. However, identification of the initial state depends on polarised target data. Hence the intensities of and partial waves are well determined ( at 1637 MeV/c, but their -dependence away from this mass is uncertain. Some limitations arise from accurate measurements of differential cross sections and polarisations, but one should not draw conclusions from the -dependence of intensities for or . On Figs. 10 and 11, this -dependence is dictated by the centrifugal barriers.
The top row of Fig. 11 shows intensities. There is a distinct maximum MeV above threshold, i.e. at a mass of 2290 MeV. It is stronger in than in . This peak eventually requires interpretation as a resonance.
The second row of Fig. 11 shows intensities. The and results are featureless, and the latter is quite small. However, the amplitude grows quite strongly with mass. It is well determined by polarisations in the final state.
The and intensities show distinct peaks which will later be associated with known resonances in Crystal Barrel , amplitude analyses. The and intensities likewise show peaks which may be associated with a known resonance. The amplitude is well determined only by polarised target data, so the peak in its intensity follows from the assumption that it scales from the amplitude. The shift between the peaks arises from a mild sensitivity to differential cross sections at high mass, and may not be reliable.
The and amplitudes of Fig, 11 drop from threshold and cannot be associated with resonant structure. However, the amplitude is small, and it will fit with very little change in to the known resonance [16]. The intensity rises steadily with mass and shows no indication of the known resonance [17].
The peaks in , and fit naturally as resonances. Fig. 12 shows Argand diagrams. There are clear loops for these partial waves. Table 3 shows fitted masses and widths in columns 2 and 3. Errors cover both statistical variations and systematic variations over a variety of fits with different assumptions (e.g. concerning centrifugal barriers and small amplitudes). In all cases, statistical errors are roughly 35–50% of systematic errors. Around the optimum, both mass and width show well defined parabolic minima in . For the resonance in Table 3, of eqn. (8) is 260 MeV and MeV on resonance, leading to a tabulated width of 275 MeV.

The next two columns compare with known resonances observed in Crystal Barrel data [10,16]. Parameters are remarkably close. If the masses and widths of columns 4 and 5 are used in the fit, the change in is only 12, and 6 parameters become fixed. It therefore looks very likely that the same resonances appear in PS185 data.
| (MeV) | (MeV) | (MeV) | (MeV) | |
|---|---|---|---|---|
| - | - | |||
| - | - |
There is a further feature which agrees with earlier observation of the resonance. In Fig. 11, there is a highly significant intensity. The requirement for this amplitude arises from and data: dashed curves on Fig. 8 show the worse fit without this amplitude. In Ref. [16], a strong resonance was likewise observed at 2255 MeV. In this mass range, both a and a resonance are expected in conventional quark models. So it is quite likely that two unresolved and resonance appear in both PS185 and Crystal Barrel data. In the Crystal Barrel analysis, a second state coupling mostly to was reported at MeV with MeV.
There is also a possible identification of the structure. There is a known [17] with a large width of 500 MeV. If it is substituted into the fit, there is almost no change in and a small movement downwards of the resonance of Table 3 to 2362 MeV. It is possible that this resonance is to be identified with the of Etkin et al. in [18]; its appearance in the channel would not be surprising. If the is substituted into the fit with the width reported by Etkin et al, changes by .
The peak in and at 2290 MeV requires a strong phase variation. If the other peaks described above are identified with known resonances in Crystal Barrel data, it is inescapable that the peak is resonant. It would be a new resonance. In the Crystal Barrel analysis of , and channels, the amplitude was not well defined in this mass range. A resonance at this mass is a natural radial excitation of [17] and [16].
5 Some general remarks
In earlier work, attempts have been made to fit these and elastic scattering data in terms of meson exchanges. There is no conflict between this approach and the apppearance of resonances. Meson exchanges can act as part of the driving forces which generate resonances. When a resonance appears, the projection of the meson exchange into an individual partial wave acquires the resonance phase through re-scattering effects. A well known example of this is the nucleon exchange term which partially drives the formation of the . Chew and Low showed in 1956 how to include the nucleon exchange term in an effective range formula which includes the resonance [19].
A little information can be added concerning . Data for the integrated cross section for this process were reported in Ref. [4] close to threshold. It is of interest to use detailed balance as in Section 2 to derive the cross section for the inverse process . Does a cusp appear at threshold? Results are displayed in Fig. 13.
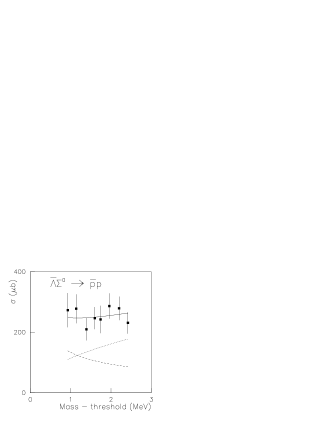
Errors are sizable, but there is no clear evidence for a cusp. The PS185 publication remarks that there is evidence for strong P-waves very close to threshold. They are reported to be even stronger than those in . It seems likely that they obscure the presence of a cusp. A fit is shown using a sum of S and P waves, but there is considerably flexibility in their relative contributions.
Further progress depends on more data. It would be valuable to have polarised target data at other momenta, particularly towards the top of the mass range, e.g. at 1990 MeV/c. In principle, such a measurement is feasible at the new ring planned at GSI. With a frozen spin target, such a measurement is technically straightforward. Using a detector such as Crystal Barrel, it would also be possible to make valuable polarisation measurements for channels such as , and , allowing a definitive conclusion to the analysis of Crystal Barrel data. If a trigger could be included on decays and/or interactions in the detector, it would open up the possibility of studying final states such as , and over a wide mass range, and hence extending the important LASS data, which run out around 2100 MeV.
6 Summary
A partial wave analysis has been presented of all published PS185 data. At 1637 MeV/c, the solution is unique, although care is needed to restrict the amplitude for so that it does not drift away to a large value. The analysis may be extended to cover all other momenta by making the assumption that the and amplitudes are related to simply by the centrifugal barrier for the initial state. The same assumption is employed for initial states and . Below 1637 MeV/c, this assumption is not serious, since the centrifugal barriers for the initial state suppress these amplitudes strongly.
There is direct evidence for a cusp at threshold in . This cusp needs to be included into the treatment of the partial waves.
There is evidence for large phase variations in several partial waves in Fig. 12. If resonances are fitted to , and partial waves, observed resonance parameters are remarkably close to resonances reported earlier in Crystal Barrel data. With that identification, a new resonance is required at 2290 MeV. Also in , there is evidence for a resonance around 2360 MeV which fits well as the reported by Etkin et al.
7 Acknowledgments
I am grateful to Prof. T. Johansson for providing tables of final data. Also to Dr. K. Paschke and Dr. B. Quinn for extensive discussions on formulae for observables.
References
- [1] P.D. Barnes et al., Phys. Lett. B189 (1987) 249.
- [2] P.D. Barnes et al., Phys. Lett. B229 (1989) 432.
- [3] P.D. Barnes et al., Phys. Lett. B331 (1994) 203.
- [4] P.D. Barnes et al., Phys. Rev. C62 (2000) 055203.
- [5] P.D. Barnes et al., Nucl. Phys. A526 (1991) 575.
- [6] B. Bassalleck et al., Phys. Rev. Lett. 89 (2002) 212302.
- [7] F. Tabakin, R.A. Eisenstein and Y. Lu, Phys. Rev. C44 (1991) 1749.
- [8] M. Elchikh and J.-M. Richard, Phys. Rev. C61 (2000) 035205.
- [9] K.D. Paschke and B. Quinn, Phys. Lett. B495 (2000) 49.
- [10] A.V.Anisovich et al., Phys. Lett. B491 (2000) 47.
- [11] D.V. Bugg, Reinterpreting several narrow ’resonances’ at threshold cusps’, submitted to Phys. Lett. B.
- [12] L.D. Landau and E.M. Lifshitz, Quantum Mechanics, Pergamon Press, London, 1959, pp 438-440.
- [13] N.A. Törnqvist, Z. Phys. C 68 (1995) 647.
- [14] N. Hoshizaki, Suppl. Progr. Theor. Phys. 42 (1968) 107.
- [15] D.V. Bugg, A.V. Sarantsev and B.S. Zou, Nucl. Phys. B471 (1996) 59.
- [16] A.V.Anisovich et al., Phys. Lett. B542 (2002) 19.
- [17] Particle Data Group, Phys. Rev. D66 (2002) 1.
- [18] A. Etkin et al., Phys. Lett. B201 (1988) 568.
- [19] G.F. Chew and F.E. Low, Phys. Rev. 101 (1956) 1570.