LC–PHSM–2003–071August 2003Study of Sleptons at a Linear Collider – Supersymmetry
Scenario SPS 1a111
Contribution to the Extended ECFA/DESY Study on Physics and
Detectors for a Linear Electron-Positron Collider (2001 – 2003)
Hans-Ulrich Martyn222email: martyn@mail.desy.de I. Physikalisches Institut, RWTH Aachen, Germany
The properties of the light charged sleptons in
, and production
are studied within the mSUGRA scenario SPS 1a.
Various method are presented to determine very precisely masses,
angular distributions, spin and couplings as well as the
polarisation and mixing parameter in the sector.
The analysis is based on a complete simulation of signal and
background reactions assuming experimental conditions of the
Tesla Linear Collider.
1 Introduction
This note describes, for a particular bench mark model, how masses and
couplings of scalar leptons can be accurately measured at a future
linear collider Tesla [1].
Beam conditions are chosen such as to stay below production thresholds
of the heavier sleptons, the assumed luminosity corresponds to about one year
of running at design parameters.
Details of the experimental simulation, analysis
and background information on kinematics and theory
are given in sketchy form.
Particle spectrum
mSUGRA SPS 1a scenario [2]
(parameters
, , ,
, sign)
shown in fig. 1.
Cascade decays of , lead to abundant final
states.
Event generation
Pythia 6.2 [3] including
beam polarisations ,
QED radiation, beamstrahlung à la Circe [4],
decays and polarisation treated by Tauola [5]
Operating conditions
, beam polarisations
, ,
integrated luminosity
efficient suppression of SUSY ()
and SM background
known: energy-momentum conservation constrains
construction of
kinematically allowed minimum mass
sharp peak around true mass
and known: reconstruct direction
two-fold ambiguity,
false solution flat in
2 Properties of smuons
Selection criteria
at
 nr  cut                              min       max      eff
 ------------------------------------------------------------
  0. n_ch, n_gamma in accept.           2         0     0.815
     n_charge in acceptance             2         2     0.989
     n_gamma  in acceptance           5.0         0     0.851
     n_veto   in acceptance           5.0         0     0.960
  1. Q*cos_theta_l                 -0.900     0.750     0.693
  2. delta phi_(l+,l-) (deg)                  160.0     0.555
  4. p_T event (GeV)                 10.0               0.553
  5. p_miss cos_theta_(l+l-)                  0.900     0.537
  7. lepton energy (GeV)              2.5     150.0     0.537
 10. m_recoil + 0.4*m_ll (GeV)      240.0               0.537

  efficiency     0.5365

  lepton energy  E_min 16.52       E_max 93.30
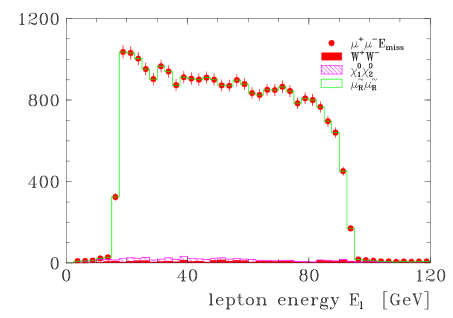
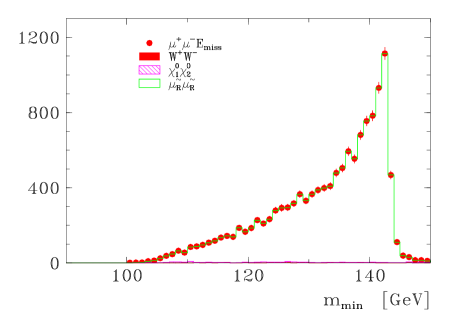
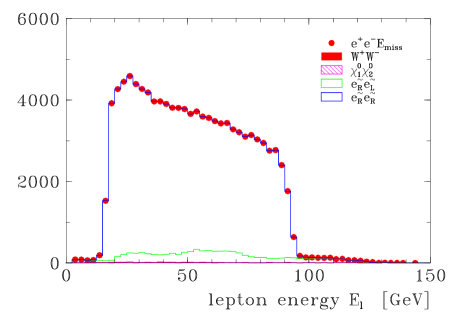
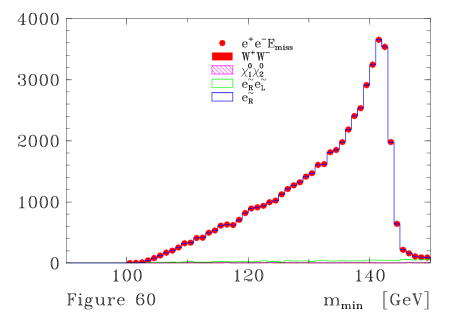
Mass determination
Spectra of the muon energy and minimum mass
are shown in fig. 2.
The endpoint energies,
and
,
give strongly correlated and masses.
The reconstructed masses from both methods agree well with the input
values.
method spectrum spectrumfixedSPS 1a input
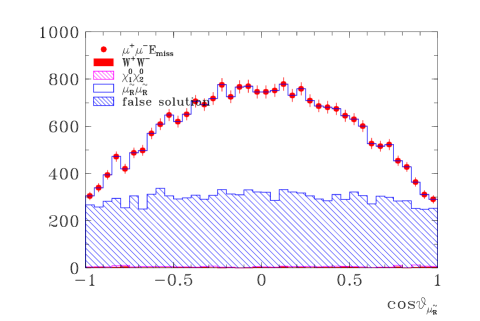
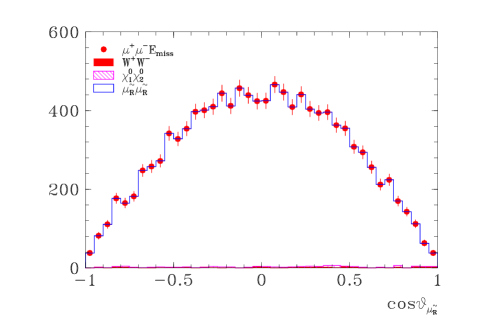
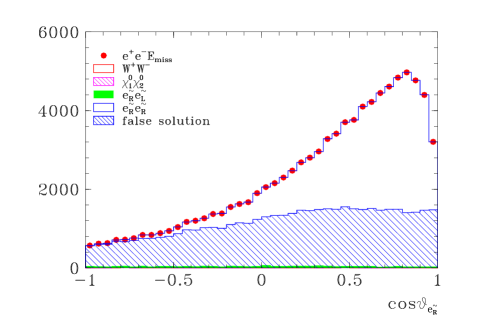
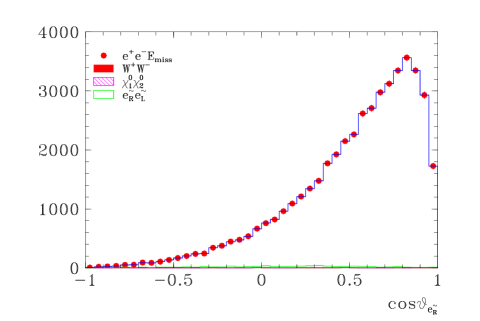
Spin of
The polar angle distribution of production is presented
in fig. 3.
After background subtraction on finds the typical cross section dependence
as expected for a scalar particle.
3 Properties of selectrons
Selection criteria
at
 nr  cut                              min       max      eff
 ------------------------------------------------------------
  0. n_ch, n_gamma in accept.           2         0     0.742
     n_charge in acceptance             2         2     0.984
     n_gamma  in acceptance           5.0         0     0.780
     n_veto   in acceptance           5.0         0     0.960
  1. Q*cos_theta_l                 -0.900     0.750     0.586
  2. delta phi_(l+,l-) (deg)                  160.0     0.484
  4. p_T event (GeV)                 10.0               0.484
  5. p_miss cos_theta_(l+l-)                  0.900     0.468
  7. lepton energy (GeV)              2.5     150.0     0.468
 10. m_recoil + 0.4*m_ll (GeV)      240.0               0.468

  efficiency     0.4675

  lepton energy  E_min 16.52       E_max 93.30
Mass determination
Spectra of the electron energy and minimum mass
are shown in fig. 4.
The endpoint energies,
and
,
give strongly correlated and masses.
The reconstructed masses from both methods are in agreement with the input
values.
method spectrum spectrumfixedSPS 1a input
Angular distribution of
The polar angle distribution of production is presented
in fig. 5.
After background subtraction on finds the typical
behaviour of -channel neutralino exchange, given by the
approximate matrix element
The differential cross section can be used to determine the Yukawa
coupling
and the gaugino mass parameter at the percent level.
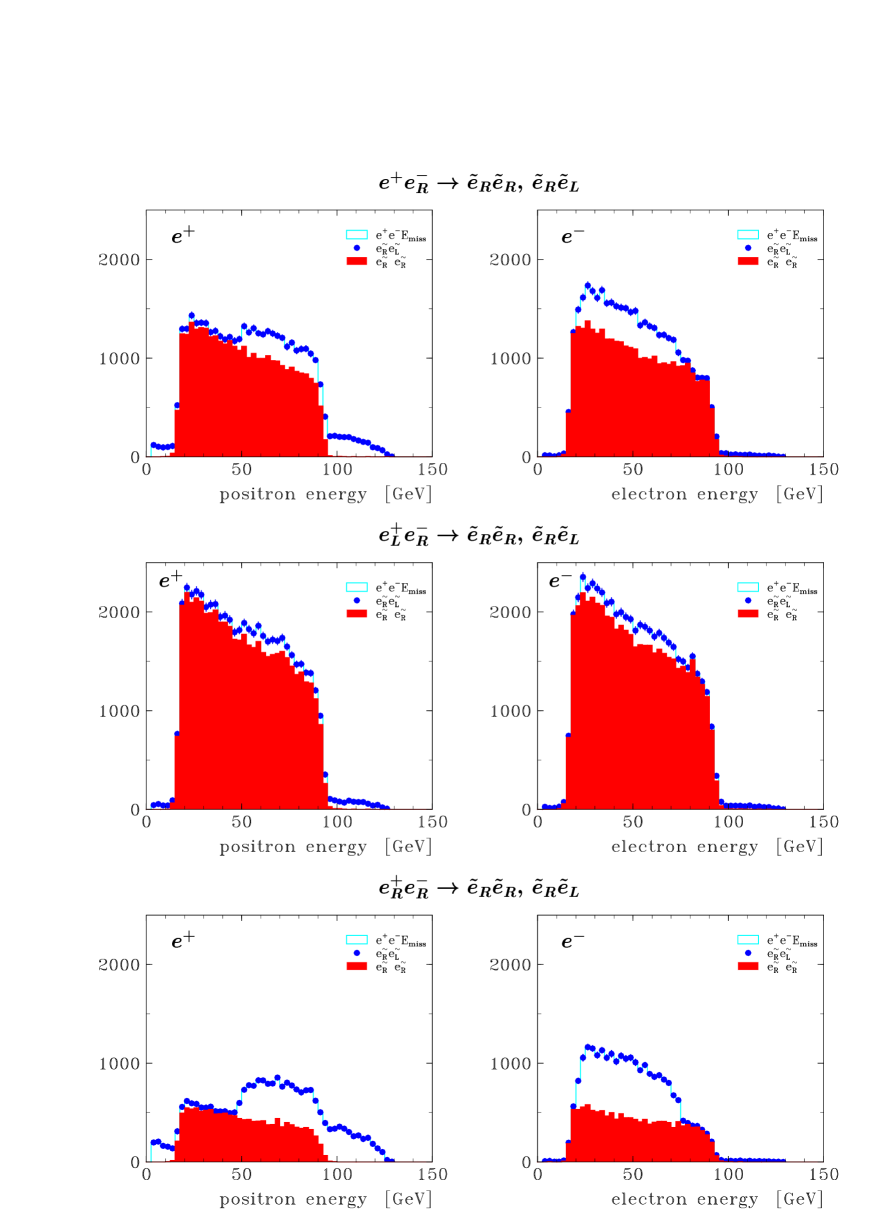
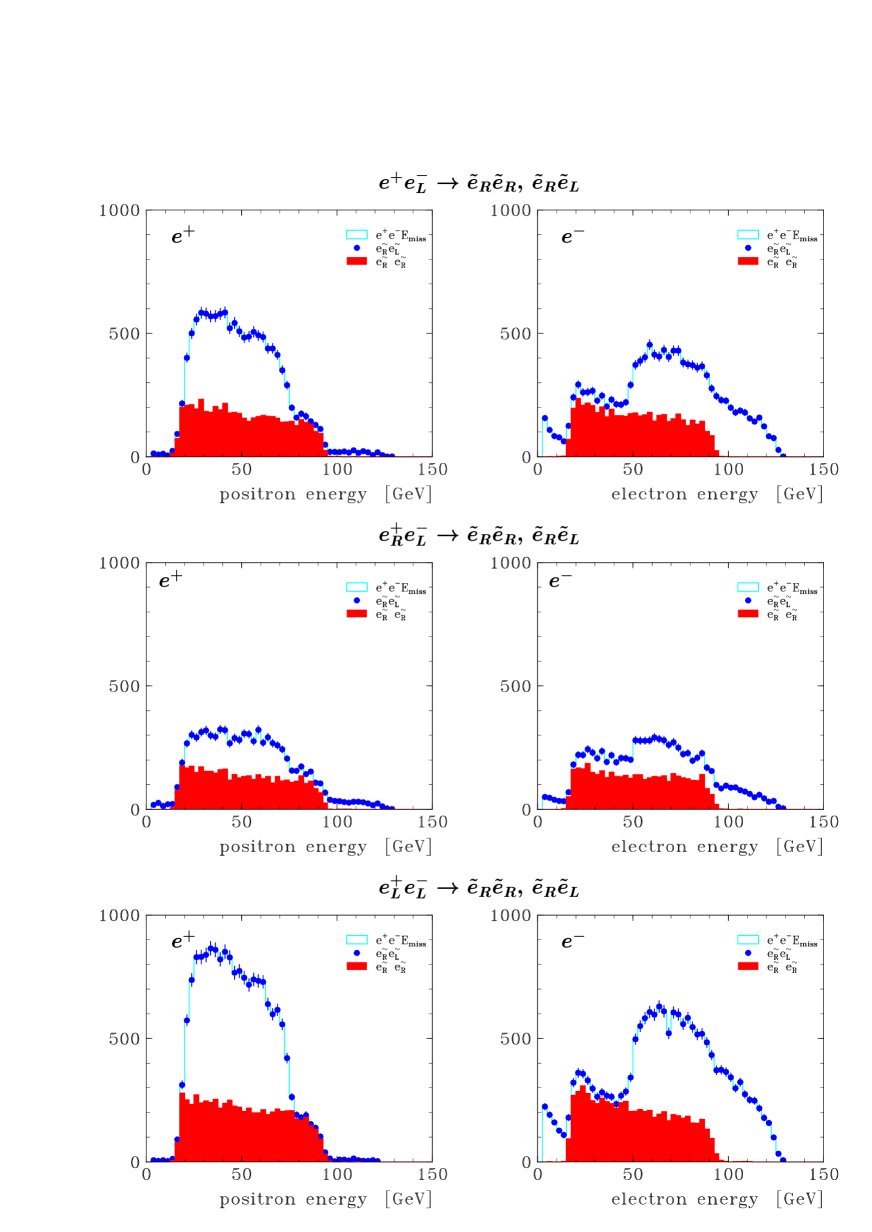
Chiral quantum numbers
A unique determination of the selectron quantum numbers
is offered by the reaction ,
which proceed via pure -channel exchange.
The ‘chiral flow’ at the vertex associates the incoming
electron/positron with its superpartner:
, and
, .
Measuring the energy spectra of the decay and separately
allows for a clear distinction between and .
Moreover, by choosing appropriate beam polarisations,
e.g. ‘odd’ combinations
or ,
one suppresses the -channel
amplitudes of and other background
and enhances the production considerably,
as illustrated in fig. 6 and fig. 7.
Contributions from are identical in both spectra
and can be readily subtracted since is known.
A measurement of the mass of
appears feasible.
Similar studies are reported in [8].
 nr  cut                              min       max      eff
 ------------------------------------------------------------
  0. n_charge, n_veto              2    6         1     0.931
  1. n_jets                             2         4     0.834
  2. n_taus                             2         4     0.829
  3. n_leptons                          0         2     0.780
  4. E_jet (GeV)                      2.5     100.0     0.739
  5. Q*cos_theta_jet               -0.950     0.750     0.597
  8. mass tau_jet (GeV)                       2.000     0.547
 11. delta phi_(l,di-jet) (deg)               160.0     0.426
 12. cos theta_P_miss                          0.95     0.424
 13. p_T (GeV)                       10.0     200.0     0.400

  efficiency SUSY      0.3999

 tau decay statistics
 --------------------
             e      mu      pi     rho    3_pi     sum
 e           0     510     529    1097    1125    3261
 mu          0       0     470    1040    1121    2631
 pi          0       0     200     783     819    1802
 rho         0       0       0     821    1786    2607
 3_pi        0       0       0       0     895     895
 sum         0     510    1199    3741    5746   11196

  lepton energy       E_min 12.19       E_max 83.81
Leptonic decays not useful and discarded due to large background
Analysed decay modes & branching ratios
xxxxx
from decays
and
, sensitive to ,
almost independent of
Analysis of and spectra, shown in fig. 8,
assuming known
modemeanSPS 1a input
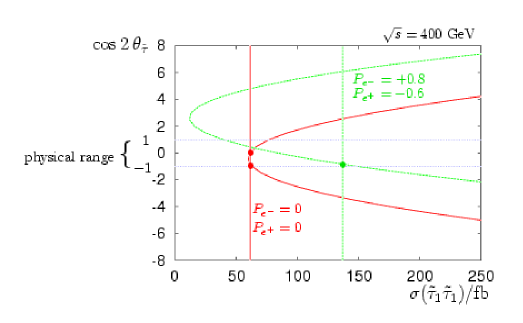
from cross section
A cross section measurement of
(incl. ISR & BS) provides a mixing angle of
, see fig. 10
polarisation
from
and from
, sensitive to ,
almost independent of
is self-analysing system – spin correlations
emitted in forward direction
emitted in backward direction
asymmetric sharing
equal sharing
Analysis of and spectra, shown in fig. 9,
assumed to be known
modemeanSPS 1a input
A polarisation measurement of
is not sensitive enough to determine in SPS 1a, where one has
5 Summary
Simulations of slepton production
in the SPS 1a mSUGRA scenario under realistic experimental conditions assuming
, and beam polarisations
, are presented.
The slepton and neutralino masses
as well as the polarisation and
mixing parameter of the third
generation can be accurately determined with moderate integrated
luminosity.
Improvements on and
are possible if can be reduced,
e.g. by studying neutralino production and decays.
An alternative method to measure selectron and smuon masses via
cross section threshold scans is discussed in [11].
Other estimates on SPS 1a sparticle masses
can be found in [8] and [12]
(not based on detailed simulations).
—
Acknowledgement
I want to thank G. Moortgat-Pick for the stimulating discussions on the
stau sector and for providing the plot of fig. 10.
References
[1]Tesla Technical Design Report, DESY 2001-011,
Part III: Physics at an Linear Collider
[hep-ph/0106315],
Part IV: A Detector for TESLA.
[2] B.C. Allanach et al., Eur. Phys. J. C 25 (2002) 113;
N. Ghodbane, H.-U. Martyn, hep-ph/0201233.
[3]Pythia, T. Sjöstrand et al.,
Comput. Phys. Commun. 135 (2001) 238.
[4]Circe, T. Ohl,
Comput. Phys. Commun. 101 (1997) 269.
[5]Tauola, S. Jadach et al.,
Comput. Phys. Commun. 76 (1993) 361.
[6]Simdet, M. Pohl, J. Schreiber,
DESY-02-061, hep-ex/0206009.
[7] J. Feng, D. Finell,
Phys. Rev. D 49 (1994) 2369.
[8] M. Dima et al.,
Phys. Rev. D 65 (2002) 71701.
[9] M.M. Nojiri,
Phys. Rev. D 51 (1995) 6281;
M.M. Nojiri, K. Fujii, T. Tsukamoto,
Phys. Rev. D 54 (1996) 6756.
[10] E. Boos et al., Eur. Phys. J. C 30 (2003) 395.
[11] A. Freitas, A. von Manteuffel,
proceedings SUSY 02, DESY Hamburg, Germany, 2002,
hep-ph/0211105.
[12] P. Grannis, talk at LCWS 02, Jeju Island, Korea, 2002,
hep-ex/0211002.
Figure 1: Particle spectrum of mSUGRA benchmark scenario SPS 1a
Figure 2: Energy spectrum of muons (left) and
minimum mass (right)
from the reaction
;
mSUGRA model SPS 1a at and
Figure 3: Polar angle distribution of with (left) and without (right)
contribution of false solution in the reaction
;
mSUGRA model SPS 1a at and
Figure 4: Energy spectrum of electrons (left) and
minimum mass (right)
from the reaction
;
mSUGRA model SPS 1a at and
Figure 5: Polar angle distribution of with (left) and without (right)
contribution of false solution
in the reaction
;
mSUGRA model SPS 1a at and Figure 6: energy spectra from
production with polarisations
, variable
for SPS 1a scenario assuming and
Figure 7: energy spectra from
production with polarisations
, variable
for SPS 1a scenario assuming and
Figure 8: Hadron energy spectra of
and of
decays from the reaction
in SPS 1a scenario assuming and
Figure 9: Pion energy spectrum of
and ratio of
decays from the reaction
in SPS 1a scenario assuming and
Figure 10: Mixing angle angle versus cross section
at for mSUGRA scenario SPS 1a