High energy beta beams without massive detectors
F. Terranovaa, A. Marottab, P. Migliozzib,
M. Spinettia
a I.N.F.N., Laboratori Nazionali di Frascati, Frascati (Rome), Italy
b I.N.F.N., Sezione di Napoli, Naples, Italy
Abstract
In this paper, the possibility to exploit a high energy beta beam without massive detectors is discussed. The radioactive ions are boosted up to very high with the neutrino beam pointing towards an instrumented surface located at a moderate baseline (e.g. from CERN to the Gran Sasso Laboratories). oscillations and their CP conjugate are tagged as an excess of horizontal muons produced in the rock and tracked by the low-mass instrumented surface installed in one of the LNGS experimental halls. We show that the performance of this complex for what concerns the determination of the angle of the leptonic mixing matrix is comparable with the current low- design based on a gigantic water Cherenkov at Frejus.
PACS: 14.60.Pq, 14.60.Lm
1 Introduction
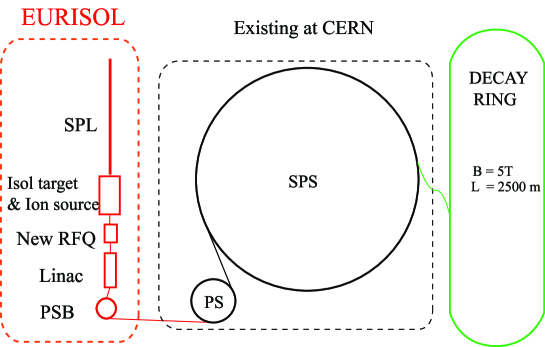
Over recent years there has been a marked growth of interest in the development of non-conventional neutrino sources. An appealing proposal has been put forward by P. Zucchelli [1] in 2002 under the name of “beta beam”. It is based on the production of intense beams of -unstable heavy ions. The ions are accelerated to a given energy and stored in a decay ring with long straight sections pointing towards a far detector. Their decays produce a pure and intense () beam whose spectrum depends solely on the -decay kinematics. The advantages of this configuration, the possibility to explore subdominant oscillations at the atmospheric scale with unprecedented sensitivity and, hence, to extract the and parameters of the leptonic mixing matrix (PMNS [2]) have been discussed by several authors [3, 4, 5]. In particular, it has been noted than an European beta beam complex could leverage existing facilities at CERN and complement the EURISOL physics program [6]. The latter foresees the construction of an intense proton driver for a new generation of radioactive beams. In fact, EURISOL is a significant extension of the program presently being carried out using the first-generation radioactive ion beam facilities in nuclear physics and nuclear astrophysics. It is aimed at increasing the variety of exotic ions produced and their yields by orders of magnitude beyond those presently available. Hence, a CERN-based beta beam complex would exploit the EURISOL ion source and the CERN PS/SPS acceleration complex. Only the dedicated hippodrome-like decay ring should be built on purpose. In its most popular configuration are produced by ions and by [4]; the ions are accelerated by the SPS up to () and (). The ratio between the two boost factors is fixed by the equalization of rigidity, i.e. the need of accumulating simultaneously into the same ring ions with different . The corresponding neutrinos emerge with energies below 1 GeV. In order to observe neutrino oscillations at the peak of the oscillation probability the detector must be located at 130 km from the source, matching, for instance, the distance from CERN to Frejus. It has already been noted [5] that low- choice is, in principle, quite unfortunate. A low- beta beam aimed at the observation of oscillations at the atmospheric scale needs a gigantic detector located at km as the proposed 1 Mton water Cherenkov at Frejus [7]. The size of the detector must overcome the smallness of the cross section at mean () energies of the order of 0.3 (0.2) GeV. A higher energy beta beam and a detector located at a farther location , tuned to operate at the peak of the oscillation probability, would provide a flux similar to the low- option since the neutrino fluxes increase quadratically with the boost factor and decrease as . However, operating at larger show up additional advantages due to the enhanced CC cross section, which depends linearly on the neutrino energy. Hence, as a first approximation, we expect the sensitivity to the subdominant channel to grow as , i.e. as the ratio of the boost factors needed to be at the peak of the oscillation probability for the distance and , respectively. A further increase of with respect to would cause a further quadratic rise of the flux compensated by a quadratic drop of the oscillation probability (“off-peak” configuration [8]). If the dependence of the oscillation probability on the PMNS parameters were the same in the “on-peak” and “off-peak” configuration, this would, anyhow, imply an increase of sensitivity due to the further growth of the cross section. Therefore, even under this condition, the possibility to run the beta beams in an off-peak configuration could be worth being investigated. However, this scenario turns out to be even more attractive if we consider the detector technologies that could be exploited to observe oscillations at high energies. In particular, the and channels could be observed as an excess of high energy ( 1-2 GeV) muons from the rock of an underground laboratory tagged by an instrumented surface installed into the cavern. Since the muon range in the rock grows linearly with the muon energy, the effective mass of the rock that contributes to the event rate adds a further linear dependence on so that a nearly quadratic increase of the sensitivity due to the higher beta beam energy is gained. Clearly, if the background can be kept under control, this configuration allows an enormous simplification and reduction of cost with respect to the Mton water Cherenkov option, especially if the detector can be installed in pre-existing halls as the ones of the Gran Sasso INFN Laboratories. In this paper, we demonstrate the feasibility of this design and determine its performance. The structure of the subdominant oscillations for off-peak scenarios and the functional dependence of the sensitivity to the parameters of the PMNS on the beta beam energy is derived in Sec. 2. The detector concept and the main backgrounds are discussed in Sec. 3. Its sensitivity to the (1-3) sector of the PMNS is computed in Sec. 4.
2 Oscillations at a high beta beam
The acceleration of radioactive ions is a prominent technique for nuclear physics studies and several facilities have been developed worldwide. The use of short-lived -decay isotopes transforms these facilities into high intensity sources of pure or . The source has practically no contamination from other flavors and a well defined energy spectrum that depends on the kinematic of -decay. The annual flux for a far detector located at a distance and aligned with the boost direction of the parent ion is [5]:
| (1) |
where , and
| (2) |
In this formula represents the electron end-point energy, the electron mass, the energy of the final state neutrino and is the total number of ion decays per year. A beta beam facility based on existing CERN machines has been discussed in [4, 6, 9]. The protons would be delivered by the Super Proton Linac (SPL) [10]. This driver has been studied at CERN in the framework of the neutrino factory [11] but could be an essential part of the EURISOL complex. The SPL would provide 2.2 GeV (kinetic energy) protons with an intensity of 2 mA. The targets for ion production would be similar to the ones envisioned by EURISOL. In particular, antineutrinos could be produced by decays (a emitter with keV and a 806.7 ms half life) from a target consisting either of a water cooled tungsten core or of a liquid lead core which works as a proton to neutron converter surrounded by beryllium oxide. Neutrinos could result from the decay of ( keV and half life of 1.672 s); the isotope can be produced by spallation reactions and, in this case, protons directly hit a magnesium oxide target. The ions can be further accelerated using the EURISOL linac and the PS/SPS complex (see Fig. 1) and sent to the decay ring. In this case the nominal is fixed by the present SPS design. It corresponds to for and for . Higher values of can be achieved upgrading the SPS with superconducting magnets or making use of the LHC. The top rigidity available at the LHC could allow for () and () [12] even if in this case the construction of the decay ring would be challenging. In particular, due to the high rigidity, it would be unrealistic to build a ring with a curved-over-straight section ratio similar to the low- option [4]. Here, the ratio is 0.94 km/2.5 km (see Fig. 1) and the useful fraction of decays is limited by the decays occurring when the bunch is located in the return straight section (i.e. the boost has opposite direction w.r.t. the far detector). The overall live-time, i.e. the fraction of decays occurring at the straight section pointing to Frejus, is 36%. If the size of the straight section is kept unchanged (2.5 km) in a high- configuration, the live-time is limited by the size of the curved parts, which in turns is related to the maximum magnetic field achievable with superconducting, radiation-hard magnets. It drops at the level of 20% and 10% for a straight section of 2.5 km and a curved section comparable with the size of the SPS and the LHC, respectively. The corresponding loss of statistics can be easily and more cheaply recovered by instrumenting a larger surface at the far location (e.g. more than one experimental hall at LNGS - see below). The actual cost of the decay ring depends on the maximum field available and on the possibility to use a significant fraction of the accelerating ring also in the storage phase. In the low- design and decays per year are expected. If the LHC were used, some injection losses would be expected due to the different optics; these losses could be compensated by an increase of the number and of the length of the bunches [5].
The number of oscillated events per year that can be observed at a distance with a detector of kton is
| (3) | |||||
where is the Avogadro’s number, is the boost factor of the beta beam complex, is the neutrino energy, the detector efficiency, the CC cross section at a given energy and the oscillation probability. The latter depends on the baseline , the energy and the parameters of the PMNS matrix. In particular, in the energy/baseline range of interest, can be expressed as [13]:
| (4) | |||||
In this formula and the terms contributing to the Jarlskog invariant are split into the small parameter , the term and the CP term ; with the Fermi coupling constant and the electron density in matter. Note that the sign of depends on the sign of which is positive (negative) for normal (inverted) hierarchy of neutrino masses. In the following we assume the present best fits for the solar and atmospheric parameters: eV2, , eV2, [14].
Far from the oscillation peak (, ) the functional dependence of becomes similar to the one of CNGS [8], i.e.
| (5) |
and the oscillation probability mainly depends on and . Matter effects are strongly suppressed and CP asymmetries appear only at the subleading order . However, even in the highest scenario, the mean neutrino energy remains significantly lower than CNGS and the cancellation of the term is not complete. Hence, the flux (“antineutrino run”)111The antineutrino run is done in parallel with the neutrino one, since it is possible to circulate and ions simultaneously in the decay ring and exploit the time structure of the beam to separate the two contributions at the far detector. still contributes to constrain the parameter space. At fixed baseline , an increase of implies a quadratic increase of the flux while an increase of the mean neutrino energy causes a quadratic decrease of the oscillation probability, a linear increase of the cross section ( in the region dominated by deep inelastic scattering) and a linear increase of the mean primary muon energy. Clearly, and are fully correlated and :
| (6) | |||||
This functional behavior is depicted in Fig. 2. The upper plot shows the average neutrino energy versus . The average muon energy for the final state is also shown. The lower plot represents the number of oscillated events per kton-year as a function of assuming 100% conversion probability (Eq.(3) with ) and an isoscalar target. The baseline is fixed at km, i.e. at the location of the Gran Sasso Laboratories (LNGS). The number of oscillated events () per kton-y for , and normal neutrino hierarchy () assuming perfect detector efficiency is also shown. Due to the assumption , the linear increase of the average muon energy, resulting in a further linear rise of the effective fiducial mass, is not exploited. This issue will be discussed in the next section.

3 The detector concept
One of the most remarkable features of the beta beams is the clearness of the final state to be observed. This advantage is less evident for low- configurations (neutrinos in the sub-GeV energy range); here, the total cross section is dominated by quasi-elastic interactions whose kinematic is obscured by Fermi motion. The latter makes impossible to extract the full spectral information from the final state reconstruction. In this energy range, a massive water Cherenkov performing a pure counting experiment could be an appropriate detector. At higher neutrino energies, the interactions are mainly deep inelastic and the use of denser detectors becomes rather attractive. For a counting experiment, a dense tracking detector provides a strong muon/pion and muon/electron separation and identifies the neutrino direction through the reconstruction of the muon track. Moreover, if the interaction vertex is contained, a kinematic analysis is possible and greatly contributes to the determination of the PMNS parameters [5]. CC interactions occurring into the rock which surrounds the detector can be exploited as well. In this case the rock acts as a massive target. Electrons and pions mainly interact before reaching the surface of the experimental hall and the tracking capability of the detector can be used to veto punch-through hadrons and reconstruct the residual muon energy at the entrance of the hall. The main difference with respect to the case of fully instrumented volume is that the kinematic analysis is deteriorated by the energy loss through the rock but the event rate scales no more as the tracking volume but it is proportional to the tracking surface. Hence, an instrumented surface located in an existing deep underground hall would imply order-of-magnitude cost reductions compared to a massive water Cherenkov. In the following we consider an instrumented surface (1515 m2) installed in one of the halls of LNGS. The tracking device is made of vertical iron walls interleaved with active detectors. The granularity is chosen to guarantee an angular resolution of a few degrees for horizontal muons. The overall thickness of the iron must be appropriate to effectively separate pions from muons at energies greater than 1-2 GeV. These requirements are discussed in details in the following sections.
The signal detection efficiency as well as the rate of pions, muons from decays and muons from semi-muonic charmed hadron decays entering the instrumented surface have been computed through a full Monte Carlo simulation based on GEANT 3.21 [15]. The target is the LNGS rock, corresponding to a nearly isoscalar target with density g/cm3. Neutrino interactions have been produced by using the event generator described in Ref. [16] and final state particles are propagated through the rock by accounting for all physical processes described in GEANT. Particles at the exit of the rock are recorded and used for the analysis described in the following.
3.1 Signal
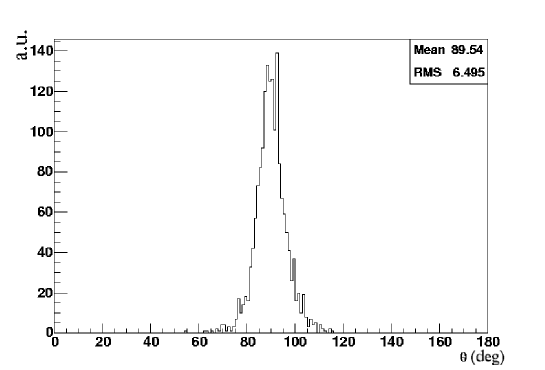
An instrumented surface tags oscillations as an excess of horizontal multi-GeV muons plus a small contamination (“silver channel” [17]) that can be safely neglected here. The direction of these muons corresponds approximately to the boost direction of the CERN decay ring ( below the horizon at LNGS) smeared by multiple scattering in rock and iron. Their time structure must be consistent with the time structure of the circulating beams in the decay ring. A primary muon whose vertex is located near the instrumented surface will reach the detector with almost its original energy and in coincidence with other particles belonging to the hadronic system. CC interactions occurring deeper in the rock will have a cleaner topology due to the screening of the accompanying hadrons but softer muons. Since the energy loss of muons in rock is nearly linear with range (2 MeV g-1cm2), the target mass contributing to the overall event rate grows linearly with the mean muon energy222Similar considerations hold for interactions. However, at a given (anti)neutrino energy, higher efficiencies than for CC are expected due to the different dependence of the cross section.. Fig. 3 (top plot) shows the probability for a muon to exit from the rock with an energy greater than 0.5 (full circles), 1 (empty circles) and 2 GeV (empty crosses) as a function of the interaction vertex. The muons come from CC interactions in the rock and are computed assuming 100% oscillations at . Their angle distribution with respect to the horizontal direction is shown in Fig. 4 for GeV ( corresponds to the boost direction of the decay ring). The muon identification efficiency as a function of the parent neutrino energy for a rock volume of 401515 m3 (24.4 kton) is shown in Fig. 3 (bottom plot). Finally, the number of expected events per year (corresponding to decays) for , and normal hierarchy as a function of ( GeV) is shown in Fig. 5.


3.2 Beam related background
The main sources of background having the same time structure of the signal are the punch-through or decayed in flight (DIF) pions from the bulk of CC and NC interactions in the rock and the semi-muonic decay of charmed particles. Punch-through pions are mainly suppressed by the instrumented iron acting as a pion plug (iron interaction length cm). The early decays in flight of pions result into soft muons which are strongly reduced by the energy cut. Table 1 (2) shows the fraction of CC and NC interactions in a rock volume giving a pion (muon) that enters the surface with an energy greater than 0.5, 1, 2 GeV. These energy cuts correspond to a range in iron of about 2.1, 4.2 and 8.4 interaction lengths. The first half of the table refers to () and (); the second one to () and ().
| No cut | GeV | GeV | GeV | |
| CC | 1.00(0.62)% | 0.70(0.38)% | 0.41(0.18)% | 0.17(0.07)% |
| NC | 0.76(0.82)% | 0.52(0.54)% | 0.27(0.29)% | 0.11(0.12)% |
| CC | 0.18(0.41)% | 0.10(0.25)% | 0.05(0.11)% | 0.018(0.024)% |
| NC | 0.33(0.32)% | 0.20(0.20)% | 0.09(0.09)% | 0.02(0.02)% |
| No cut | GeV | GeV | GeV | |
| CC | 1.59(1.07)% | 1.01(0.71)% | 0.69(0.38)% | 0.35(0.19)% |
| NC | 1.27(1.34)% | 0.90(0.91)% | 0.53(0.53)% | 0.26(0.27)% |
| CC | 0.36(0.69)% | 0.24(0.46)% | 0.11(0.23)% | 0.04(0.08)% |
| NC | 0.56(0.57)% | 0.38(0.38)% | 0.20(0.19)% | 0.07(0.07)% |
| No cut | GeV | GeV | GeV | |
| CC | 0.030(0.012)% | 0.016(0.004)% | 0.004(0.001)% | 0.001(0.001)% |
| NC | 0.025(0.018)% | 0.010(0.009)% | 0.002(0.004)% | 0.001(0.001)% |
| CC | 0.007(0.011)% | 0.003(0.005)% | 0.001(0.001)% | 0.001((0.001)% |
| NC | 0.011(0.008)% | 0.004(0.002)% | 0.002(0.001)% | 0.001(0.001)% |
| No cut | GeV | GeV | GeV | |
| CC | 0.04(0.02)% | 0.02(0.01)% | 0.008(0.006)% | 0.004(0.003)% |
| NC | 0.03(0.03)% | 0.015(0.014)% | 0.008(0.006)% | 0.002(0.001)% |
| CC | 0.010(0.014)% | 0.004(0.008)% | 0.001(0.003)% | 0.001(0.001)% |
| NC | 0.018(0.012)% | 0.007(0.004)% | 0.002(0.001)% | 0.001(0.001)% |
The charm production rate has been estimated by using the latest results from the CHORUS [18] experiment and accounting for the different (anti)neutrino energy spectrum. For of the order of the cross sections are 2.3% and 1.8% for and , respectively. They grow up to 3.5% () and 2.7% () for . The semi-muonic branching ratio is about 7%. Note that in the highest scenario, the muon spectrum from charm is significantly harder than in the region close to the kinematic threshold and the contamination increases substantially. This effect is described in Table 3 where the expected background at and with different momentum cuts are shown. It is worth noting that this background would be substantially reduced if the sign of the muon were available, its charge being opposite with respect to the primary from CC. For such a soft muon spectrum, a large-surface magnetized iron detector with a field of about 1 Tesla would have a rejection factor greater than 99% and, in addition, would suppress the punch-through and DIF background by about 50%.
| No cut | GeV | GeV | GeV | |
|---|---|---|---|---|
| CC () | 6.46 % | 6.33 % | 5.85 % | 2.92 % |
| CC () | 5.51 % | 5.51 % | 3.94 % | 0.95 % |
| No cut | GeV | GeV | GeV | |
| CC () | 10.63 % | 10.53 % | 10.31 % | 7.63 % |
| CC () | 7.15 % | 6.89 % | 5.92 % | 3.44 % |
3.3 Beam unrelated background
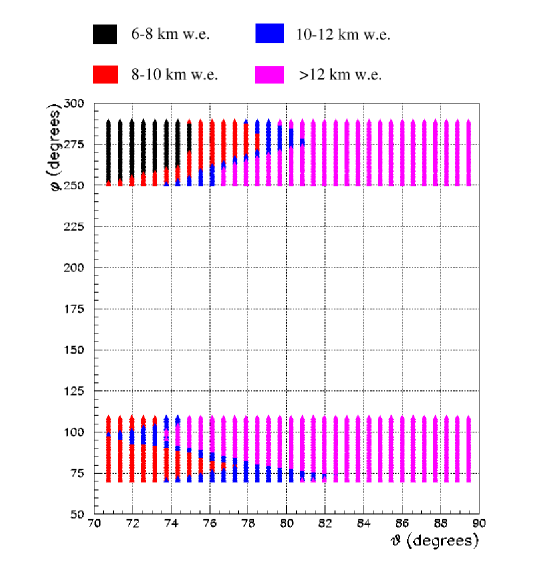
The LNGS underground halls are located at a slant depth that strongly depends on the zenithal and azimuthal direction. The minimum depth is 3200 hg/cm2 but, due to a fortunate conspiracy of the mountain profile, the largest rock depths near the horizon are reached in the CERN-to-LNGS direction. The rock coverage in the zenith () and azimuth () region pointing to CERN is shown in Fig. 6. Here, corresponds to the horizon; at the muons come from the CERN direction and enter the instrumented surface from the front. At muons enter the detector from the back. The latter can be vetoed if the active detectors provide proper timing. As can be inferred from Fig. 6, the slant depth is greater than 12 km of water-equivalent (km w.e.) in most of the region of interest. Here, the muon flux is dominated by atmospheric neutrinos and it is of the order of [19].
A detailed calculation has been carried out through a full parametrization of the data from the MACRO experiment [20]. Results are shown in Table 4. It is clear that, even at the largest angle (), the time structure of the beam ( suppression factor) allows a complete rejection of the background. In fact, this result suggests that, opposite to the low- option (CERN to Frejus), the constraint on the bunch length of the beta beam ( ns) can be released by at least one order of magnitude.
| All | |||||||
| 425945 | 424537 | 301795 | 100681 | 19 | 126 | 728 | |
| 510743 | 509033 | 361332 | 120797 | 27 | 177 | 928 | |
| All | |||||||
| 425945 | 423105 | 300753 | 100362 | 19 | 126 | 727 | |
| 510743 | 507273 | 360088 | 120391 | 27 | 176 | 922 | |
| All | |||||||
| 425945 | 420298 | 298738 | 99703 | 19 | 125 | 725 | |
| 510743 | 503765 | 357664 | 119578 | 27 | 173 | 918 |
3.4 Summary of expected rates
From the above discussion, it is apparent that the sensitivity of the detector under consideration will be limited mainly by the beam related background. A severe requirement on the visible range of the penetrating tracks, corresponding to an energy cut of about 2 GeV, will bring the punch-trough contamination at the level of a few events per year (suppression factor ). The charm contamination is expected to limit the sensitivity at the highest (see Table 3); a further suppression factor of the charm background () from charge reconstruction is available for a magnetized detector333In the few GeV energy range, a magnetized iron detector with and, if necessary, precision trackers before and after the iron plug can achieve charge misidentification probabilities well below [17]. In order to determine the actual efficiency, an optimization of the detector and of the pattern recognition algorithm is mandatory. Clearly, this issue is beyond the scope of this paper; in the following we assume very conservatively a 99% charge identification efficiency.. In most of the cases, however, the sensitivity is limited by the contamination of secondary muons from and decay in flight. A synopsis of the expected rates per year for a instrumented surface in the occurrence of the null hypothesis ( ) for and an angle with respect to the nominal beam direction is shown in Table 5. The events per year expected for 100% conversion probability are ( at ), ( at ), ( at ) and ( at ).
| Detector | charm | ||||
|---|---|---|---|---|---|
| T | 1.5 | 0.5 | 11.6 | 20.2 | |
| T | 0.8 | 0.02 | 3.5 | 1.5 | |
| T | 4.9 | 4.6 | 153.4 | 357.1 | |
| T | 3.2 | 0.3 | 15.4 | 37.1 | |
| T | 1.5 | 0.2 | 5.8 | 0.2 | |
| T | 0.8 | 0.01 | 1.8 | 0.01 | |
| T | 4.9 | 1.8 | 64.8 | 3.6 | |
| T | 3.2 | 0.1 | 7.8 | 0.4 |
4 Sensitivity
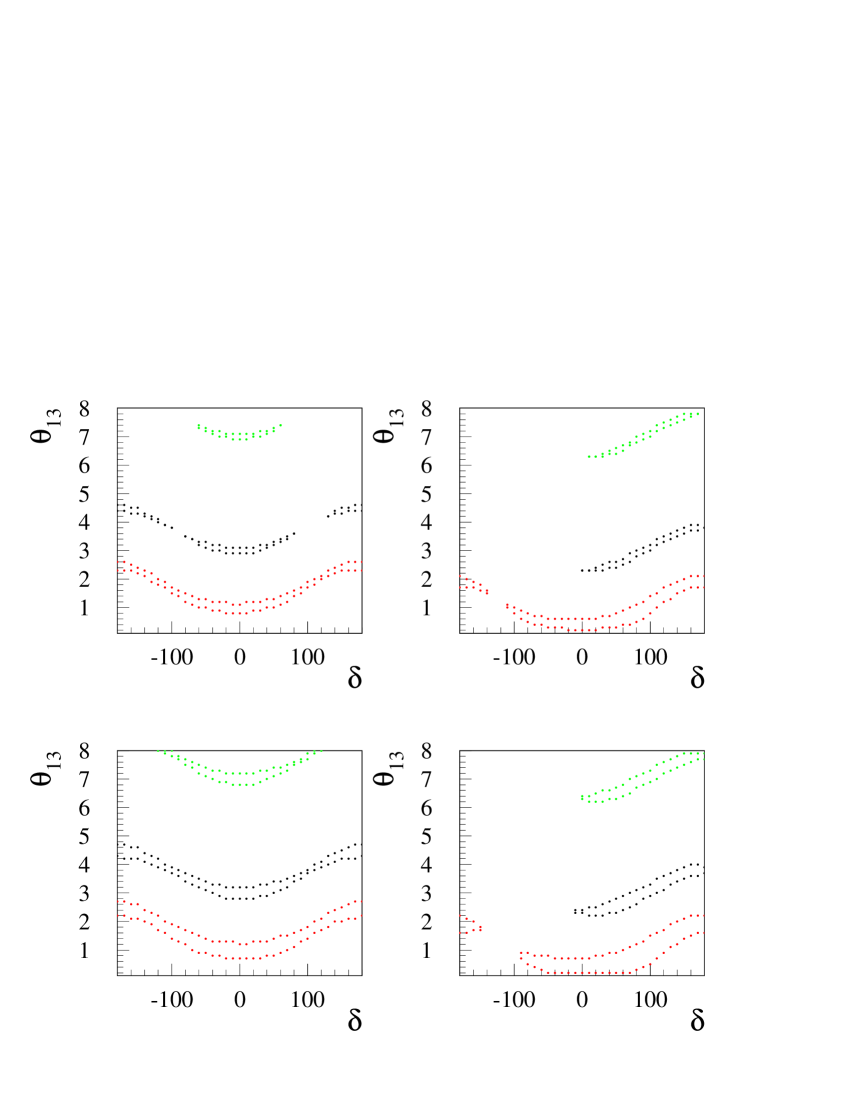
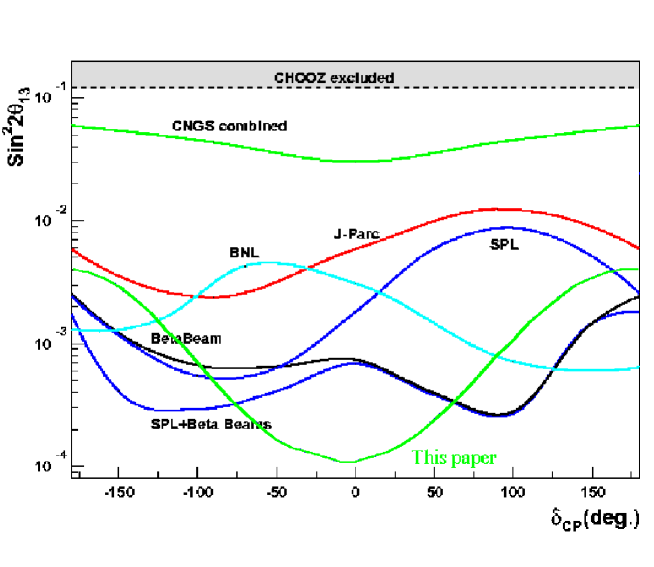
The sensitivity to the and parameters is evaluated assuming an instrumented surface of m2 with a detector having an iron depth greater than 8 interaction lengths. Only muons with energy greater than 2 GeV at the entrance of the detector are considered. A 5 year data taking with and decays per year is assumed444Note that, in current literature, sometimes results for the low- CERN to Frejus option are given assuming 10 years of data taking.. The baseline corresponds to the CERN to Gran Sasso distance (732 km). Results are provided for two high- options: and . The former is dominated by the pion background from CC and NC. The latter suffers from a significant charm contamination which can be eliminated by charge reconstruction (magnetized iron detector option). The sensitivity has been computed fixing all parameters but and to their current best values ( eV2, , eV2, ) and performing a two-parameter fit. The facility is used as a pure counting experiment and the information coming from the reconstructed muon spectrum at the entrance of the instrumented surface is not exploited. Fig. 7 shows the parameter region excluded at 90% C.L. in the occurrence of the null hypothesis () for normal (left plots) and inverted hierarchy (right plots) and for (lower plots) and (upper plots). Here, we assume reconstruction of the muon charge, use the neutrinos coming from decays (dots), the antineutrinos from (dashed line) and combine the two measurements (solid line). The dot-dashed line represents the sensitivity for a detector without magnetic field. Note that, in spite of the reduced cross section, the antineutrino flux strongly contributes to the sensitivity of the apparatus due to the lower background contamination. As noted above, the suppression of matter effect does not allow an unique determination of the neutrino hierarchy so that remains undetected. The allowed regions at 90% C.L. for (red), (black), (green), (left plot) and (right plot) are shown in Fig. 8 (lower plots) for normal hierarchy, a magnetized detector operating at and combining both the neutrino and the antineutrino flux. The corresponding curves for are shown in Fig. 8 (upper plots). The sensitivity of this apparatus compared with other proposed facilities [4, 21] is shown in Fig. 9. The facilities under consideration are the CERN to Gran Sasso beam (CNGS), JAERI to Kamioka (J-Parc), BNL to Homestake (BNL), the low- beta beam (“Beta beam”) and the SPL to Frejus superbeam (SPL). The current CHOOZ limit is also shown. The label “This paper” refers to the magnetized detector configuration after 5 years of data taking.

5 Conclusions
The fluxes at large distance produced by decays of boosted radioactive ions has a strong quadratic dependence on the Lorentz factor of the ions. For a fixed baseline, an increase of that brings the average neutrino energy well above the maximum of the oscillation probability does not imply a loss of events since the increase of the flux compensates for the smallness of the oscillation probability. Moreover, a net gain of events is obtained by the linear rise of the CC cross section and by the increase of the detector efficiency. The latter effect is particularly valuable for purely passive detectors. In this paper we propose to observe oscillations as an excess of horizontal muons produced in the rock and tracked by a low-mass instrumented surface installed in an underground hall of LNGS. This configuration allows a very precise determination of and turns out to be competitive with the current low- design based on a gigantic water Cherenkov at Frejus [7]. Similarly to the latter, it has limited sensitivity to the sign of . However, opposite to the facilities operating at the peak of the oscillation maximum, it shows maximal sensitivity for small CP violation (). For , this complex would significantly constrain the parameter space (see Fig. 8) but, in general, would not tag explicitly CP violation through a lepton/antilepton asymmetry, since the off-peak configuration suppresses the CP odd terms. Clearly, the cost of the detector is negligible compared e.g. with a Mton water Cherenkov, while most of the acceleration system is either shared with other non-neutrino projects (EURISOL) or based on existing CERN machines.
Acknowledgments
We wish express our gratitude to A. Marini, F. Ronga and L. Votano for many useful suggestions. We thank M. Selvi and M. Sioli for providing us with current data on cosmic background at LNGS. A special thank to M. Mezzetto for interesting comments and discussions concerning the physics and technological challenges of the beta beams.
References
- [1] P. Zucchelli, Phys. Lett. B 532 (2002) 166.
- [2] B. Pontecorvo, Sov. Phys. JETP 6 (1957) 429; Z. ‘¡Maki, M. Nakagawa, S. Sakata, Prog. Theor. Phys. 28 (1962) 870.
- [3] M. Mezzetto, J. Phys. G 29 (2003) 1781.
- [4] J. Bouchez, M. Lindroos and M. Mezzetto, Contributed to 5th International Workshop on Neutrino Factories and Superbeams (NuFact 03), New York, 5-11 Jun 2003; arXiv:hep-ex/0310059.
- [5] J. Burguet-Castell, D. Casper, J. J. Gomez-Cadenas, P. Hernandez and F. Sanchez, Nucl. Phys. B 695 (2004) 217 [arXiv:hep-ph/0312068].
- [6] Workshop on “Radioactive beams for nuclear physics and neutrino physics” 37th Rencontre de Moriond, Les Arcs (France) March 17-22nd, 2003; http://moriond.in2p3.fr/radio/index.html.
- [7] L. Mosca, “A European Megaton Project at Frejus”, Talk at the 8th International Workshop on Topics in Astroparticle and Underground Physics (TAUP2003), Seattle, Washington, September 2003.
- [8] P. Migliozzi, F. Terranova, Phys. Lett. B 563 (2003) 73.
- [9] B. Autin et al., J. Phys. G 29 (2003) 1785.
- [10] B. Autin et al.,”Conceptual design of the SPL, a high-power superconducting linac at CERN”, CERN-2000-012.
- [11] M. Apollonio et al., CERN-TH-2002-208, arXiv:hep-ph/0210192.
- [12] M. Lindroos, “Accelerator based neutrino beams”, in [6].
- [13] A. Cervera et al., Nucl. Phys. B579 (2000) 17, erratum ibid. Nucl. Phys. B593 (2001) 731; M. Freund, Phys. Rev. D64 (2001) 053003.
- [14] M. Maltoni, T. Schwetz, M. A. Tortola, J. W. F. Valle, Phys. Rev. D 68 (2003) 113010.
- [15] GEANT Detector Description and Simulation Tool, CERN Program Library long Writeup W5013, Geneve, 1993.
- [16] D. Autiero, “The OPERA event generator and the data tuning of nuclear reinteractions”, Talk at the International Workshop on Neutrino-Nucleus Interactions in the Few GeV Region (NuInt04), March 17-21, 2004, Assegi, Italy.
- [17] A. Donini, D. Meloni and P. Migliozzi, Nucl. Phys. B 646 (2002) 321; D. Autiero et al., Eur. Phys. J. C 33 (2004) 243.
- [18] A. Artamonov, “Cross section measurements in CHORUS”, Talk at the International Workshop on Neutrino-Nucleus Interactions in the Few GeV Region (NuInt04), March 17-21, 2004, Assegi, Italy.
- [19] M. Ambrosio et al. [MACRO Coll.], Phys. Lett. B 517 (2001) 59.
- [20] Courtesy of M. Sioli.
- [21] The plot is based on the analyses of M. Apollonio et al., Phys. Lett. B 466 (1999) 415; Y. Itow et al., arXiv:hep-ex/0106019; M. V. Diwan et al., Phys. Rev. D 68, 012002 (2003); M. Mezzetto, J. Phys. G 29 (2003) 1771 and of Refs.[3, 8]