Solar Neutrino Oscillation Parameters in Experiments with Reactor Anti-Neutrinos
Abstract
We review the current status of the solar neutrino oscillation parameters. We discuss the conditions under which measurements from future solar neutrino experiments would determine the oscillation parameters precisely. Finally we expound the potential of long baseline reactor anti-neutrino experiments in measuring the solar neutrino oscillation parameters.
INFN, Sezione di Trieste, Trieste, Italy
Scuola Internazionale Superiore di Studi Avanzati,
I-34014,
Trieste, Italy
E-mail: sandhya@he.sissa.it
1 Introduction
Recent data on charged current (CC) and neutral current (NC) break-up of deuterons by the solar neutrinos from the Sudbury Neutrino Observatory (SNO) ?,?,?), have confirmed the solar neutrino deficit problem, first observed in the pioneering experiment at Homestake (Cl), and later corroborated by the observations in the SAGE, GALLEX, GNO (Ga) and Kamiokande and Super-Kamiokande (SK) experiments ?). Spearheaded by the CC to NC ratio observed in SNO, the global solar neutrino data collected over the last few decades, established the Large Mixing Angle (LMA) solution as the most favored solution to the solar neutrino deficit problem ?,?,?,?,?). The other oscillation solutions such as SMA, LOW, QVO and VO are strongly disfavored, although alternative mechanisms involving flavor changing neutral currents (FCNC) or transition magnetic moment (RSFP) ?) would still be allowed by the global solar neutrino data. The KamLAND reactor anti-neutrino experiment has observed flavor oscillations of and therefore under the plausible assumption of CPT invariance has independently given a conclusive evidence in favor of the LMA solution ?). The global data, including the KamLAND and the solar neutrino results pick eV2 and as the best-fit solution ?). KamLAND virtually “rules out” all the alternative solution to the solar neutrino problem and relegates them to play at best a sub-dominant role in the deficit of solar neutrinos.
The observed depletion of the atmospheric muon neutrino flux in SK, and in particular the Zenith angle dependence of this observed deficit, have given strong evidence for the existence of oscillations of atmospheric muon neutrinos. The SK atmospheric data is best explained in terms of dominant () oscillations with maximal mixing and eV2 ?).
The two sectors, solar and atmospheric, are related by the mixing angle which is currently bound by the CHOOZ and Palo-Verde ?) reactor data as , dependending on the “true” value of .
2 Status of the Solar Neutrino Oscillation Parameters
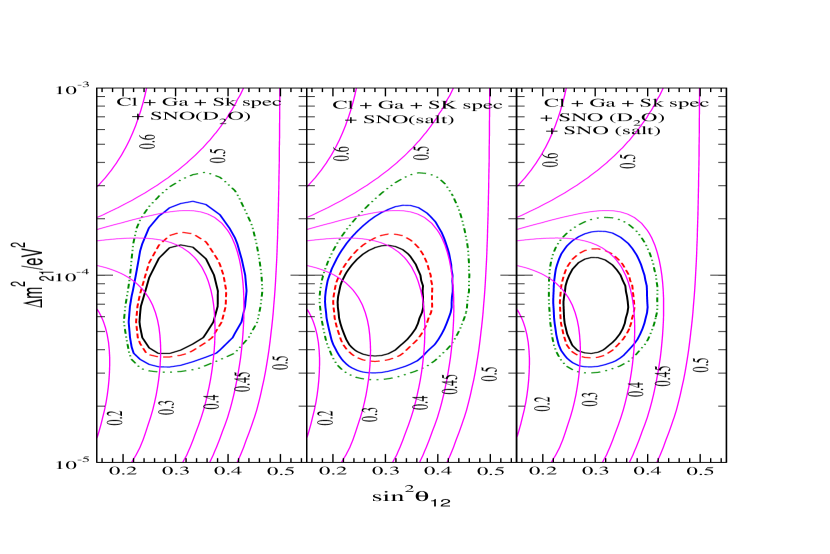
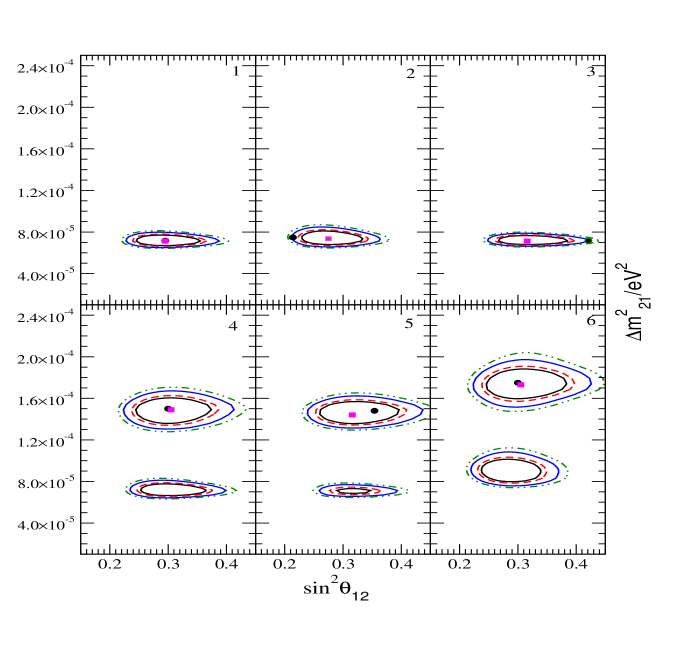
In figure 1 we show the areas of the solar neutrino oscillation parameter space, which are allowed by the global solar neutrino data. In particular, this figure shows the impact of the salt phase of the SNO results ?). In the left-hand panel of the figure 1, we show the allowed areas obtained when global solar data includes only the phase of SNO. In the middle panel we show the corresponding contours when global solar data includes only the salt phase of SNO. Finally, in the right-hand panel we give the allowed areas obtained from the global solar neutrino data including SNO results from both the and the salt phases. Also superimposed on the figures are the constant lines of the ratio of the CC to NC rates, in SNO ?). We note that smaller values of roughly trace smaller values of and . In particular, since the value of this ratio has reduced from as in the phase to as in the salt phase, comparison of the left and the middle panels of figure 1 reflect the fact that for the salt phase the allowed areas have shifted to lower values of (the impact on is not seen to be very significant). The third panel shows the allowed areas after including data from both the and salt phase of SNO. The combined SNO data has a much larger statistical power and this results in tighter constraints both on the upper bound on and upper bound on . SNO also disfavors maximal mixing at the level.
| Data | best-fit parameters | 99% C.L. allowed range | ||
|---|---|---|---|---|
| set used | /(eV2) | /(eV2) | ||
| Cl+Ga+SK+ | 0.29 | |||
| Cl+Ga+SK+salt | 0.28 | |||
| Cl+Ga+SK++salt | 0.29 | |||
| Cl+Ga+SK++KL | 0.3 | |||
| Cl+Ga+SK++salt+KL | 0.3 | |||
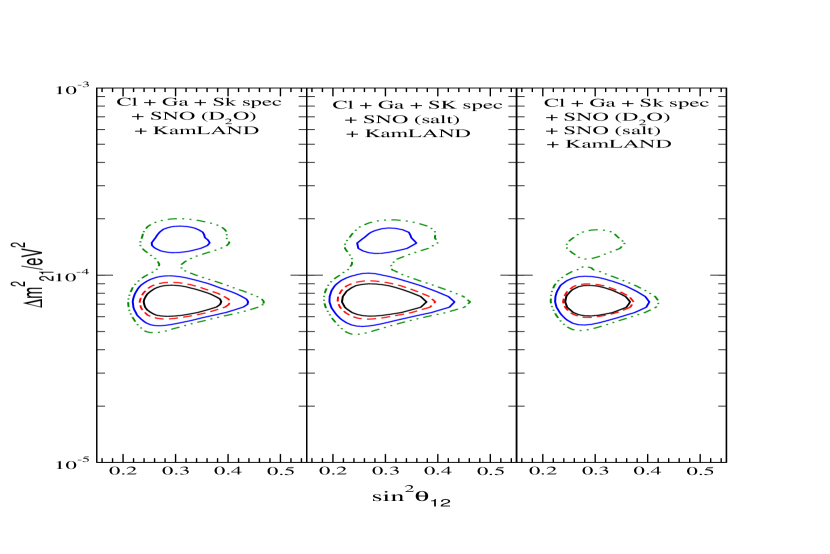
We next include the 162 ton-year first results from KamLAND ?) in the analysis and present the corresponding allowed areas obtained from the combined KamLAND + solar analysis in figure 2. Again we present our results separately for three cases for SNO: with the global solar data including only the phase (left-hand panel), with the global solar data including only the salt phase (middle panel) and with the global solar data including the two phases combined (right-hand panel). We note the shift in the allowed zones to smaller values of for the salt phase panel in figure 2. This is due to the change in the value of for SNO, as discussed above. The main impact of the KamLAND data is to split the LMA zone into two allowed sub-zones, which we will call the low-LMA and the high-LMA, with best-fit around eV2 and eV2 respectively. The best-fit value of for both the solutions. We note that the high-LMA solution is allowed at the 99% C.L. when the two phases of the SNO data are included separately. However the combined SNO data along with the other solar neutrino data and the KamLAND results, allow the high-LMA only at 99.13% C.L. (2.63) with respect to the global obtained in the low-LMA region.
In Table 1 we show the best-fit points and the 99% C.L. allowed range of parameter values for the different combination of data sets. We note that while the inclusion of KamLAND data severely restricts the range of allowed values for the mass difference , the range of allowed values for remains virtually the same as that allowed by the global solar neutrino data alone.
3 Potential of the Future Solar Neutrino Experiments
With LMA confirmed as the solution to the solar neutrino problem, the stage is set for the herald of the era of precision measurement in the field of neutrino physics. We would first want to glean into the immediate future and see how much light the next generation results from solar neutrino experiments could shed into our understanding of the solar neutrino oscillation parameters.
After having completed the very successful salt phase of their experiment, the SNO collaboration will use Helium proportional counters to observe directly the neutrons released in the neutral current break-up of deuteron. This phase 3 result from SNO will give a totally uncorrelated and clean signal for the observed CC and NC event rates. The phase 3 results will also have higher statistics and therefore will be further constraining in and . In the near future, SNO is expected to provide data on the day/night spectrum, which could be used in a statistical analysis to further constrain the solar neutrino oscillation parameters. One of the related observables is the day-night asymmetry:
| (1) |
The predicted in SNO, for the current best-fit values of the parameters in the low-LMA region, as well as the corresponding range, are given by
| (2) |
For the barely allowed high-LMA solution we get:
| (3) |
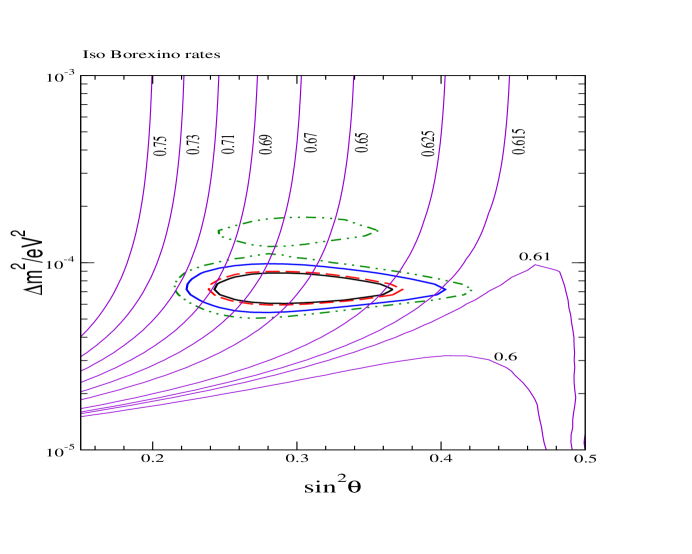
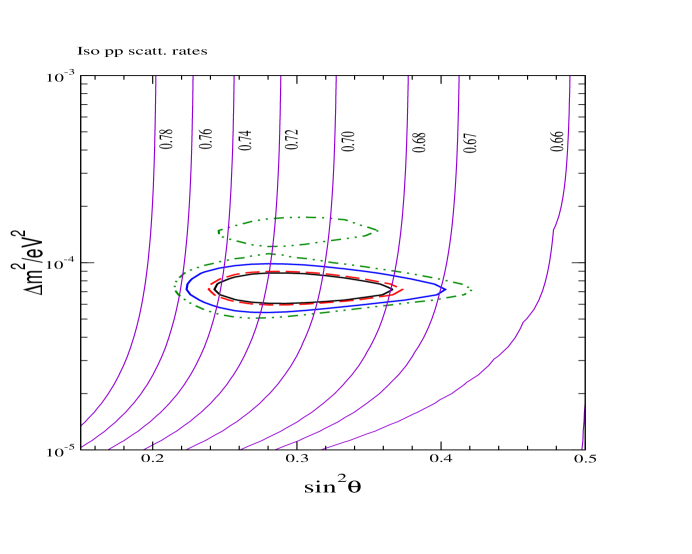
The potential of Borexino ?) and any generic electron scattering experiment for the low energy neutrinos – the LowNu experiments ?) – in constraining the mass and mixing parameters have been studied most recently in ?,?). For the current range of allowed parameter values, we find the predicted rates for Borexino and LowNu experiments to be
| (4) | |||||
| (5) |
Figures 3 and 4 show the iso-rate contours for the observed rates in Borexino and a generic LowNu experiment. Also superimposed on the figures are the current allowed zone from the global solar and reactor data. The figure 3 shows that there is almost no dependence for the observed rate in Borexino over most of the allowed range of the parameter space. Thus we would not expect the range of to improve much with Borexino. The Borexino rate is seen to have some dependence on the value of . Thus the range of could be improved upon if Borexino would be successful in measuring the solar rate with a experimental error of less than about ?). Indeed it was shown in ?) as well that even with 5% error in the observed rate in Borexino, the range of allowed values of and do not change much.
The figure 4 shows that the iso-rates for a generic neutrino-electron scattering experiment are also nearly independent of but carry a fair degree of dependence on the value of . The advantage of these kind of experiments is that the flux is theoretically known to within 1% accuracy ?). However one would still need an experimental error of less that a few percent to be able to constrain any further ?).
4 Potential of KamLAND for Precision Measurement
| Data | 99% CL | 99% CL | 99% CL | 99% CL |
|---|---|---|---|---|
| set | range of | spread | range | spread |
| used | of | of | in | |
| 10-5eV2 | ||||
| only sol | 3.2 - 17.0 | 68% | 29% | |
| sol+162 Ty | 5.3 - 9.8 | 30% | 29% | |
| sol+1 kTy | 6.5 - 8.0 | 10% | 26% | |
| sol+3 kTy | 6.8 - 7.6 | 6% | 21% |
The KamLAND experiment with their first results have already shown remarkable promise to measure precisely the solar neutrino oscillation parameters. In figure 5 we show the allowed areas obtained from a combined analysis performed with the current global solar neutrino data and a projected 1 kTy KamLAND data simulated at various points shown in the figure by black dots. We note that the precision on the allowed value of improves, however for there seem to little improvement. Also note that if the future KamLAND spectral data corresponds to a point in the high-LMA zone, then the ambiguity between the high-LMA and low-LMA solution would again get enhanced to the 90% C.L. due to the conflicting trends between the solar and KamLAND data.
We present in Table 2 the values of and allowed at 99% C.L. by the existing and prospective KamLAND data, and the corresponding uncertainty (“spread”) defined as ?,?),
| (6) |
where is the largest(smallest) allowed value of the given parameter. The uncertainty in , determined using only the data, reduces from 68% to 30% after the inclusion of the first KamLAND data in the analysis, while that in does not change, remaining rather large - 29%. The uncertainty in would further diminish to 10% (6%) after 1 kTy (3 kTy) data from KamLAND. However, there is little improvement in the precision on the value of with the increase of KamLAND statistics ?).
5 The importance of the SPMIN
The survival probability, , in the reactor experiments of interest, depends on , , , the angle limited by the CHOOZ and Palo Verde experiments, and on the type of neutrino mass hierarchy ?,?). The potential sensitivity of a reactor experiment to each of these parameters depends crucially on the baseline of the experiment. Experiments with a baseline km can be used to get information on , since over these distances oscillations induced by are mainly operative and determines their amplitude. For baselines km, the oscillations due to average out and we have, . Therefore long baseline reactor experiments can measure and .
In the absence of oscillations, the maximal contribution to the signal in a reactor experiment comes for energy MeV. For a fixed , maximal sensitivity to can be achieved if for MeV, is “tuned” to a survival probability minimum (SPMIN), i.e., if . The corresponding , and thus very sensitive to the value of . If in contrast, is such that , would have a maximum (SPMAX): . In this case the sensitivity to is worse than in the preceding one. The positions of the extrema in both cases are highly sensitive to the value of . We note that for KamLAND the dominant reactor anti-neutrino flux coming from the Kashiwazaki reactor power complex corresponds to a SPMAX for the low-LMA and the high-LMA solutions. This is why the sensitivity is not good in KamLAND.
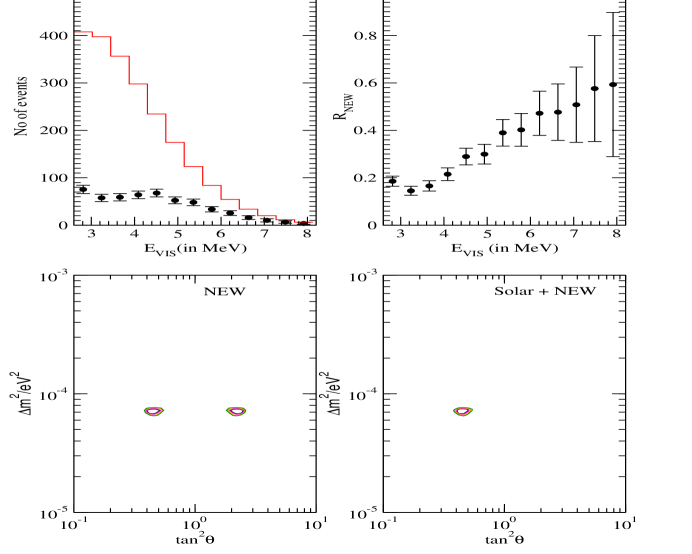
6 Impact of new reactors on KamLAND
A new reactor power complex called “Shika-2”, with a thermal power of about 4 GW and close to the old Shika site, at a distance of about 88 km from KamLAND, is expected to start operations from March 2006 onward. In Fig. 6, the upper panels show the spectrum of the observed to expected positron events ratio in KamLAND, induced by the “individual” reactor fluxes from the Kashiwazaki (panel (a)) and the Shika-2 (panel (b)) reactor complexes. The spectra corresponding to both low-LMA and high-LMA solutions are displayed. We note that for the Kashiwazaki flux, the events spectra for both low- and high-LMA correspond to roughly a SPMAX. Since the flux from Kashiwazaki dominates the total observed flux at KamLAND, the fact that for both low- and high-LMA solutions the Kashiwazaki flux produces a similar spectrum at KamLAND, results in the two degenerate solutions allowed by the current data.
For Shika-2, the low-LMA solution produces a SPMIN in the resultant spectrum at the detector, while the high-LMA solution produces a SPMAX. Therefore, with the inclusion of the Shika-2 flux, we could expect that the (i) ability of KamLAND to discriminate between the low- and the high-LMA solutions should improve and (ii) in the case of low-LMA as the true solution, sensitivity of KamLAND to measure should improve.
The bottom panels in Fig. 6 show the positron spectrum corresponding to the cumulative flux seen at KamLAND from all the reactors combined. Panel (c) shows the spectrum corresponding to the low-LMA solution while panel (d) shows the spectrum expected for the high-LMA solution. The solid line in both panels correspond to the cumulative spectrum from the current 16 main reactors operating around KamLAND, while the dashed lines show the case when the Shika-2 reactor also starts operation, along with the 16 already existing reactor facilities. Clearly we see that even after the starting of the Shika-2 reactor, the resultant spectrum is a SPMAX for the low-LMA solution. This happens because the Kashiwazaki power plant even though farther from KamLAND , is much more powerful than Shika-2. The effective of Kashiwazki at KamLAND is , which should be compared with Shika-2 effective flux of only . Further, a comparison of the panels (c) and (d) show that the impact of the Shika-2 flux is actually to reduce the difference between the spectral distortion produced in the case of the low- and high-LMA solutions. Therefore instead of improving the sensitivity of KamLAND to distinguish between the two solutions, the effect of turning on the Shika-2 flux could further decrease it ?).
In Fig. 7 we show the projected allowed areas obtained by analysing a prospective 1.3 kTy KamLAND data with either the current 16 reactor fluxes (left-hand panels) or with the 17 reactor setup, including the Shika-2 flux (right-hand panels). The upper (lower) panels for both the setups are for the low-LMA (high-LMA) as the true solution: which means that we simulate the prospective KamLAND spectrum at the low-LMA (high-LMA) best-fit. We note that with the addition of the Shika-2 flux into the KamLAND spectrum, the spurious high-LMA (low-LMA) solution gets allowed at even the 90% C.L., showing a clear deteoration in the experiment’s ability to pick the right solution. The sensitivity to does not improve either ?).
7 Optimizing the Reactor Anti-Neutrino Experiment for and
For in the low-LMA region, we expect to find a minimum in the survival probability (SPMIN) when km. This value of is therefore best suited for measuring if lies in the low-LMA region ?). For a reactor complex having a power of 24.6 GW (e.g., Kashiwazaki) and data of 3 kTy from a KamLAND -like detector at km, can be determined with a 10% uncertainty ?). In figure 8 we show the allowed areas in the parameter space we would expect after 3 kTy of data from this experiment if low-LMA was the true solution to the solar neutrino problem.
8 Conclusions
In conclusion, future solar neutrino data can lead to precise measurement of the neutrino oscillation parameters only if they can reduce the experimental uncertainties. The KamLAND experiment can measure the solar mass squared difference very precisely but not the mixing angle. If low-LMA is confirmed by the next results from KamLAND, a reactor experiment with a baseline of 70 km should be ideal to measure the solar neutrino mixing angle. A new reactor power plant, Shika-2, is expected to start operations in Japan in March 2006. It will be located at km from KamLAND . This baseline is close to the “ideal” one of km. However due to averaging effects of the anti-neutrino fluxes from the Kashiwazaki and Shika-2 reactors, the sensitivity of KamLAND to would not improve, while its sensitivity to would diminish.
9 Acknowledgments
It is a pleasure to thank Milla Baldo Ceolin for her hospitality at the very stimulating NO-VE conference in Venice. The results summarized in the present note were obtained in collaboration with A. Bandyopadhyay, S. Goswami, S.T. Petcov and D.P. Roy.
References
- [1] Q. R. Ahmad et al. [SNO Collaboration], Phys. Rev. Lett. 87, 071301 (2001).
- [2] Q. R. Ahmad et al. [SNO Collaboration], Phys. Rev. Lett. 89, 011301 (2002). Q. R. Ahmad et al. [SNO Collaboration], Phys. Rev. Lett. 89, 011302 (2002).
- [3] S. N. Ahmed et al. [SNO Collaboration], arXiv:nucl-ex/0309004.
- [4] B. T. Cleveland et al., Astrophys. J. 496, 505 (1998); J. N. Abdurashitov et al. [SAGE Collaboration], arXiv:astro-ph/0204245; W. Hampel et al. [GALLEX Collaboration], Phys. Lett. B 447, 127 (1999); E. Bellotti, Talk at Gran Sasso National Laboratories, Italy, May 17, 2002; T. Kirsten, talk at Neutrino 2002, XXth International Conference on Neutrino Physics and Astrophysics, Munich, Germany, May 25-30, 2002. (http://neutrino2002.ph.tum.de/); S. Fukuda et al. [Super-Kamiokande Collaboration], Phys. Lett. B 539, 179 (2002); M. B. Smy et al. [Super-Kamiokande Collaboration], Phys. Rev. D 69, 011104 (2004).
- [5] A. Bandyopadhyay, S. Choubey, S. Goswami and K. Kar, Phys. Lett. B 519, 83 (2001).
- [6] A. Bandyopadhyay, S. Choubey, S. Goswami and D. P. Roy, Phys. Lett. B 540, 14 (2002).
- [7] A. Bandyopadhyay, S. Choubey, S. Goswami, S. T. Petcov and D. P. Roy, arXiv:hep-ph/0309174 (to appear in Phys. Lett B).
- [8] A. B. Balantekin and H. Yuksel, Phys. Rev. D 68, 113002 (2003); G. L. Fogli, E. Lisi, A. Marrone and A. Palazzo, arXiv:hep-ph/0309100; M. Maltoni, T. Schwetz, M. A. Tortola and J. W. F. Valle, Phys. Rev. D 68, 113010 (2003); P. C. de Holanda and A. Y. Smirnov, arXiv:hep-ph/0309299.
- [9] W. Grimus, M. Maltoni, T. Schwetz, M. A. Tortola and J. W. F. Valle, Nucl. Phys. B 648, 376 (2003); J. Barranco, O. G. Miranda, T. I. Rashba, V. B. Semikoz and J. W. F. Valle, Phys. Rev. D 66, 093009 (2002).
- [10] K. Eguchi et al. [KamLAND Collaboration], Phys. Rev. Lett. 90, 021802 (2003).
- [11] A. Bandyopadhyay, S. Choubey, R. Gandhi,S. Goswami,D. P. Roy, Phys. Lett. B 559, 121 (2003).
- [12] Super-Kamiokande Coll., Y. Hayato et al., Talk given at the Int. EPS Conference on High Energy Physics, July 17 - 23, 2003, Aachen, Germany.
- [13] M. Apollonio et al., Phys. Lett. B466, 415 (1999); F. Boehm et al., Phys. Rev. D62, 072002 (2000).
- [14] M. Maris and S. T. Petcov, Phys. Lett. B 534, 17 (2002).
- [15] G. Alimonti et al. [Borexino Collaboration], Astropart. Phys. 16, 205 (2002).
- [16] S. Schönert, talk at Neutrino 2002, Munich, Germany.
- [17] A. Bandyopadhyay, S. Choubey and S. Goswami, Phys. Rev. D 67, 113011 (2003).
- [18] J. N. Bahcall and C. Pena-Garay, JHEP 0311, 004 (2003).
- [19] J.N. Bahcall, M.H. Pinsonneault and S. Basu, Astrophys. J. 555, 990 (2001).
- [20] S. Choubey, S. T. Petcov and M. Piai, Phys. Rev. D 68, 113006 (2003).
- [21] S. T. Petcov and M. Piai, Phys. Lett. B 533 (2002) 94.
- [22] A. Bandyopadhyay, S. Choubey, S. Goswami and S. T. Petcov, Phys. Lett. B 581, 62 (2004).