LEARNING FROM DECAYS 111Contribution to the Proceedings of the Workshop on the Discovery Potential of an Asymmetric B Factory at Luminosity, SLAC, Stanford, California, 2003
CLNS 03/1852
TECHNION-PH-2003-41
hep-ph/0311280
Michael Gronau 222Physics Department, Technion – Israel Institute of Technology, Haifa 3200, Israel and Jonathan L. Rosner 333Laboratory of Elementary Particle Physics, Cornell University, Ithaca, NY 14850, on leave from Enrico Fermi Institute and Department of Physics, University of Chicago, 5640 S. Ellis Avenue, Chicago, IL 60637
Current information on from other CKM constraints is still in need of improvement, with at 95% c.l. [1]. Direct probes of can tighten these bounds, possibly indicating new physics effects in case that an inconsistency with this range is observed. In order to study directly in charmless two-body decays, which involve a to transition, one must generally separate strong and weak phases from one another. We describe several cases of decays in which progress in this work has been accomplished, and what improvements lie ahead. Some additional details are noted in earlier reviews [2, 3, 4] and in Refs. [5] and [6].
A great deal of information can be obtained from decay rates averaged over CP, supplemented with measurements of direct CP asymmetries. One probes in this manner tree-penguin interference in various processes. The data which are used in these analyses are summarized in Table 1 [7]. The to lifetime ratio is taken to be , based on ps and ps [8]. Table 1 also contains contributions to the four decay processes of penguin (), electroweak penguin (), tree () and color-suppressed tree () amplitudes. These contributions are hierarchical and can be classified using flavor symmetries [9, 10, 11, 12]. Smaller contributions, from color-suppressed electroweak penguin amplitudes, annihilation and exchange amplitudes, are not shown in Table 1. All four decays are dominated by penguin amplitudes, which are related to each other by isospin. Tree amplitudes and electroweak penguin amplitudes are subdominant and can be related to each other by flavor SU(3) [13]. SU(3) breaking in tree amplitudes is introduced assuming factorization.
| Decay mode | Amplitude | (units of ) | |
|---|---|---|---|
Several comparisons between pairs of processes can be made:
- •
- •
- •
We give the example of in detail. The tree amplitude for this process is , with weak phase , while the penguin amplitude is with weak phase . We denote the penguin-tree relative strong phase by and define . Then we may write
| (1) | |||||
| (2) | |||||
| (3) |
In the last two amplitudes we neglect small annihilation contributions with weak phase , assuming that rescattering effects are not largely enhanced. A test for this assumption is the absence of a CP asymmetry in , and a U-spin relation between this process and [24], in which a corresponding amplitude with weak phase is expected to be much larger. One also neglects small color-suppressed electroweak contributions, for which experimental tests were proposed in [25].
One now forms the ratio
| (4) | |||||
Fleischer and Mannel [14] pointed out that for any so if one can get a useful bound. Moreover, if one uses
| (5) |
as well and eliminates one can get a more powerful constraint, illustrated in Fig. 1.
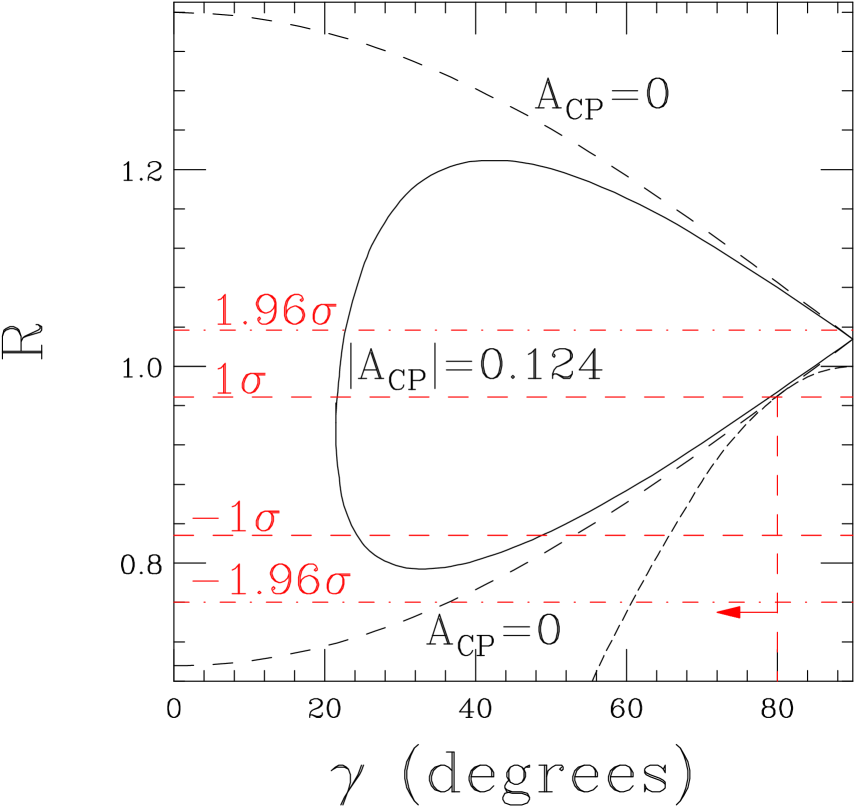
We have used and based on recent averages [7] of CLEO, BaBar, and Belle data, and . In order to estimate the tree amplitude and the ratio of amplitudes , we have used factorization in at low [26] and . One could also use processes in which dominates, such as or , but these are contaminated by contributions from and , respectively. The allowed region lies between the curves and . The most conservative upper bound on arises for the smallest value of and the largest value of , while the most conservative lower bound would correspond to the largest and the smallest . Currently no such lower bound is obtained at a level. At this level one has , leading to an upper bound .
We note that for the current average value of the upper bound, , happens to coincide with that of Ref. [14]. This bound does not depend much on the value of , for which we assumed factorization of in order to introduce SU(3) breaking. The upper bound on varies only slightly, , for a wide range of values . On the other hand, a potential lower bound on depends more sensitively on the value of , and would result if small values of this parameter could be excluded. For instance, Fig. 1 shows that a value implies at . Thus, it is crucial to improve our knowledge of .
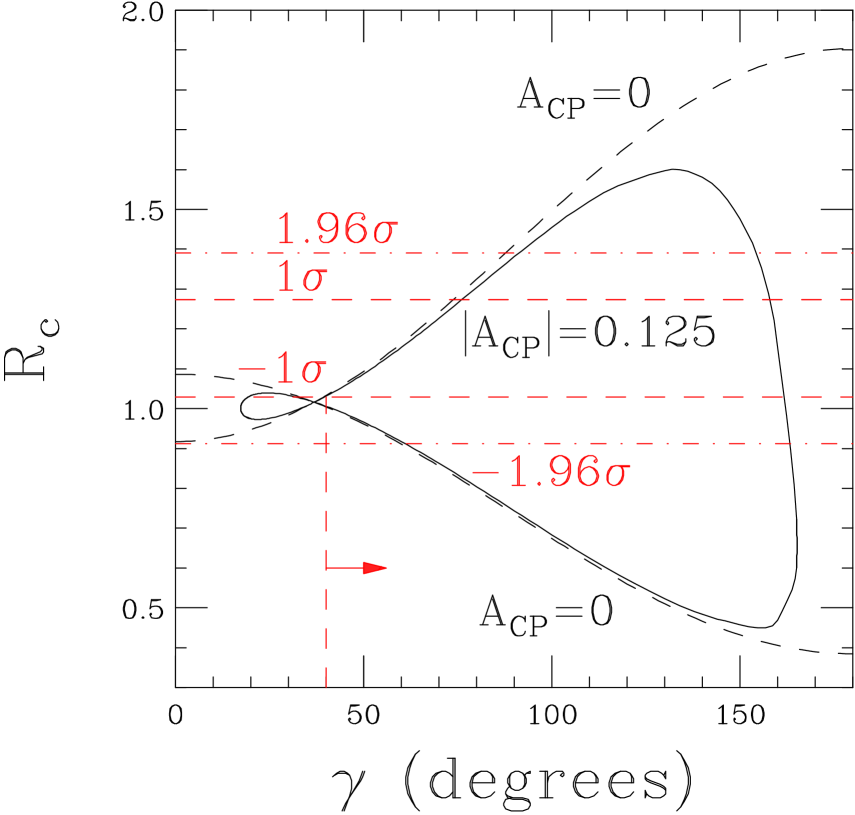
The process also provides constraints on . The deviation of the ratio
| (6) |
from 1, when combined with , and an estimate of the electroweak penguin amplitude , leads to a lower bound . Details of the method may be found in Refs. [2, 3, 5, 13, 17, 18]; the present bound represents an update of previously quoted values. The most conservative lower bound on arises for smallest , largest , and largest , and is shown in Fig. 2. These values of and would also imply an upper bound, , which demonstrates the importance of improving our knowledge of these two hadronic parameters.
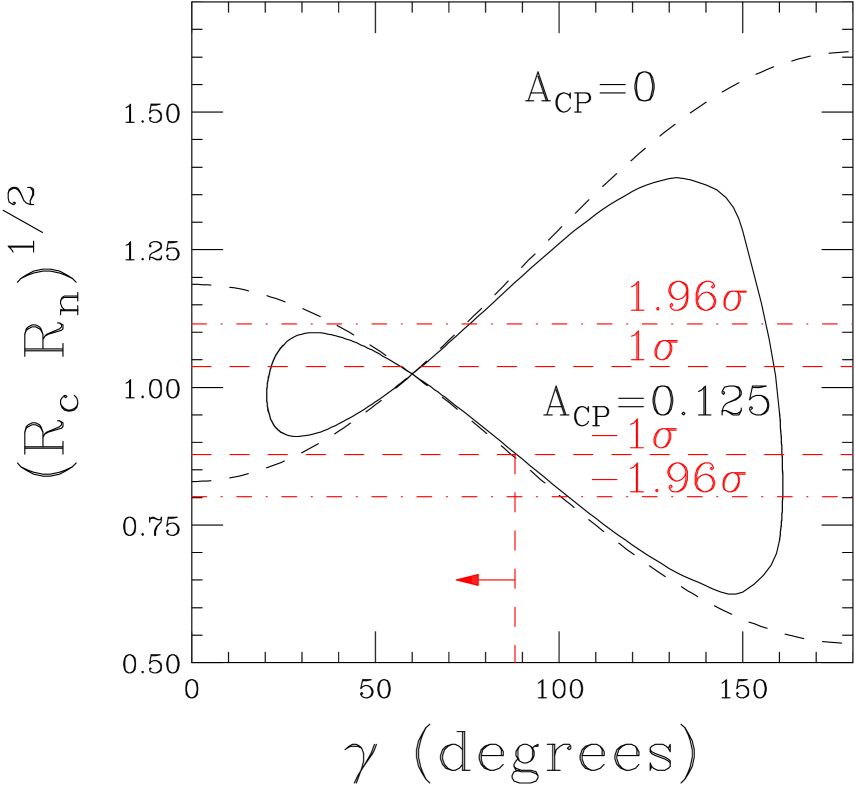
Another ratio
| (7) |
involves the decay . This ratio should be equal to since to leading order in , , and one has
| (8) |
but the two ratios differ by . Possibilities for explaining this apparent discrepancy (see, e.g., Refs. [5, 27]) include (1) new physics, e.g., in the EWP amplitude, and (2) an underestimate of the detection efficiency in all experiments, leading to an overestimate of any branching ratio involving a . The latter possibility can be taken into account by considering the ratio , in which the efficiency cancels. As shown in Fig. 3, this ratio leads only to the conservative bound . A future discrepancy between and at a statistically significant level implying new physics effects would clearly raise questions about the validity of constraints on obtained from these quantities.
Recently a time-dependent asymmetry measurement in was reported [28]
| (9) |
where and are coefficients of and terms in the asymmetry. In the limit of a pure penguin amplitude, , one expects . The color-suppressed amplitude, , contributing to this process involves a weak phase . Its effect was studied recently [6] by relating these two amplitudes within flavor SU(3) symmetry to corresponding amplitudes in . Correlated deviations from , at a level of in the two asymmetries, were calculated and were shown to be sensitive to values of in the currently allowed range. Observing such deviations and probing the value of requires reducing errors in the two asymmetries by about an order of magnitude.
To summarize, promising bounds on stemming from various decays have been mentioned. So far all are statistics-limited. At we have found
-
•
( vs. ) gives ;
-
•
( vs. ) gives ;
-
•
( vs. ) should equal ; gives .
The future of most such determinations remains for now in experimentalists’ hands, as one can see from the Figures. We have noted (see, e.g., [15]) that measurements of rate ratios in can ultimately pinpoint to within about . The required accuracies in , , and to achieve this goal can be estimated from the Figures. For example, knowing to within 0.05 would pin down to within if this ratio lies in the most sensitive range of Fig. 3. A significant discrepancy between the values of and would be evidence for new physics.
It is difficult to extrapolate the usefulness of , , and measurements to very high luminosities without knowing ultimate limitations associated with systematic errors. The averages in Table 1 are based on individual measurements in which the statistical errors exceed the systematic ones by at most a factor of about 2 (in the case of ) [7]. For the statistical and systematic errors are nearly equal. Thus, the clearest path to improvements in these measurements is associated with the next factor of roughly 4 increase in the total data sample. Thereafter, reductions in systematic errors must accompany increased statistics in order for these methods to yield improved accuracies in .
In our study we used the most pessimistic values of the parameters , and leading to the weakest bounds on . The theoretical uncertainties in these parameters can be further reduced, and the assumption of negligible rescattering can be tested. This progress will rely on improving branchng ratio measurements for , and , on an observation of penguin-dominated decays, and on various tests of factorization which imply relations between CP-violating rate differences [29, 30].
A complementary approach to the flavor-SU(3) method is the QCD factorization formalism of Refs. [21, 22, 23]. It predicts small strong phases (as found in our analysis) and deals directly with flavor-SU(3) breaking; however, it involves some unknown form factors and meson wave functions and appears to underestimate the magnitude of penguin amplitudes. Combining the two approaches seems to be the right way to proceed.
This work was supported in part by the United States Department of Energy through Grant No. DE FG02 90ER40560.
References
- [1] A. Hocker, H. Lacker, S. Laplace and F. Le Diberder, Eur. Phys. J. C 21, 225 (2001) [arXiv:hep-ph/0104062]. For periodic updates see http://ckmfitter.in2p3.fr/.
- [2] M. Gronau, Presented at Flavor Physics and CP Violation (FPCP 2003), Paris, France, 3–6 June 2003 [arXiv:hep-ph/0306308].
- [3] J. L. Rosner, AIP Conf. Proc. 689, 150 (2003) [arXiv:hep-ph/0306284].
- [4] J. L. Rosner, Presented at the 9th International Conference on B-Physics at Hadron Machines (BEAUTY 2003), CMU, Pittsburgh, October 2003 [arXiv:hep-ph/0311170].
- [5] M. Gronau and J. L. Rosner, Phys. Lett. B 572, 43 (2003) [arXiv:hep-ph/0307095].
- [6] M. Gronau, Y. Grossman and J. L. Rosner, to be published in Phys. Lett. B [arXiv:hep-ph/0310020].
- [7] C.-W. Chiang, M. Gronau, J. L. Rosner, and D. A. Suprun, 2003, manuscript in preparation; see also Heavy Flavor Averaging Group, Lepton-Photon 2003 branching ratios and CP asymmetries, at http://www.slac.stanford.edu/xorg/hfag/rare/.
- [8] LEP Oscillation Working Group, results for the summer 2003 conferences, http://lepbosc.web.cern.ch/LEPBOSC/.
- [9] D. Zeppenfeld, Z. Phys. C 8, 77 (1981).
- [10] M. J. Savage and M. B. Wise, Phys. Rev. D 39, 3346 (1989) [Erratum-ibid. D 40, 3127 (1989)].
- [11] M. Gronau, O. F. Hernandez, D. London and J. L. Rosner, Phys. Rev. D 50, 4529 (1994) [arXiv:hep-ph/9404283].
- [12] M. Gronau, O. F. Hernandez, D. London and J. L. Rosner, Phys. Rev. D 52, 6374 (1995) [arXiv:hep-ph/9504327].
- [13] M. Neubert and J. L. Rosner, Phys. Lett. B 441, 403 (1998) [arXiv:hep-ph/9808493].
- [14] R. Fleischer and T. Mannel, Phys. Rev. D 57, 2752 (1998) [arXiv:hep-ph/9704423].
- [15] M. Gronau and J. L. Rosner, Phys. Rev. D 57, 6843 (1998) [arXiv:hep-ph/9711246].
- [16] M. Gronau and J. L. Rosner, Phys. Rev. D 65, 013004 (2002) [Erratum-ibid. D 65, 079901 (2002)] [arXiv:hep-ph/0109238].
- [17] M. Neubert and J. L. Rosner, Phys. Rev. Lett. 81, 5076 (1998) [arXiv:hep-ph/9809311].
- [18] M. Neubert, JHEP 9902, 014 (1999) [arXiv:hep-ph/9812396].
- [19] A. J. Buras and R. Fleischer, Eur. Phys. J. C 11, 93 (1999) [arXiv:hep-ph/9810260].
- [20] A. J. Buras and R. Fleischer, Eur. Phys. J. C 16, 97 (2000) [arXiv:hep-ph/0003323].
- [21] M. Beneke, G. Buchalla, M. Neubert and C. T. Sachrajda, Nucl. Phys. B 606, 245 (2001) [arXiv:hep-ph/0104110].
- [22] M. Beneke and M. Neubert, Nucl. Phys. B 651, 225 (2003) [arXiv:hep-ph/0210085].
- [23] M. Beneke and M. Neubert, arXiv:hep-ph/0308039.
- [24] A. F. Falk, A. L. Kagan, Y. Nir and A. A. Petrov, Phys. Rev. D 57, 4290 (1998) [arXiv:hep-ph/9712225].
- [25] R. Fleischer, Eur. Phys. J. C 6, 451 (1999) [arXiv:hep-ph/9802433].
- [26] Z. Luo and J. L. Rosner, Phys. Rev. D 68, 074010 (2003) [arXiv:hep-ph/0305262].
- [27] Y. Grossman, Presented at LP03, XXI International Symposium on Lepton and Photon Interactions at High Energies, Fermilab, 2003 [hep-ph/0310229].
- [28] BaBar Collaboration, A. Farbin et al., PLOT–0053, contribution to LP03, Ref. [27]; https://oraweb.slac.stanford.edu:8080/pls/slacquery/babar_documents.startup.
- [29] N. G. Deshpande and X. G. He, Phys. Rev. Lett. 75, 1703 (1995) [arXiv:hep-ph/9412393].
- [30] M. Gronau, Phys. Lett. B 492, 297 (2000) [arXiv:hep-ph/0008292].