SISSA 78/2003/EP
SINP/TNP/03-32
hep-ph/0309174
Constraints on neutrino oscillation parameters from the SNO salt phase data
Abhijit Bandyopadhyay1,
Sandhya Choubey2,3,
Srubabati Goswami4,5,
S.T. Petcov3,2,6,
D.P. Roy7
1Saha Institute of Nuclear Physics, 1/AF, Bidhannagar, Calcutta 700 064, India,
2INFN, Sezione di Trieste, Trieste, Italy,
3Scuola Internazionale Superiore di Studi Avanzati, I-34014, Trieste, Italy,
4Harish-Chandra Research Institute, Chhatnag Road, Jhusi, Allahabad 211 019, India,
5The Abdus Salam International Centre for Theoretical Physics, I-34100, Trieste, Italy,
6Institute of Nuclear Research and Nuclear Energy, Bulgarian Academi of Science, Sofia, Bulgaria,
7Tata Institute of Fundamental Research, Homi Bhabha Road, Mumbai 400 005, India
Abstract
The physics implications of the just published salt phase data from the SNO experiment are examined. The effect of these data on the allowed ranges of the solar neutrino oscillation parameters, and , are studied in the cases of two- and three- neutrino mixing. In the latter case we derive an upper limit on the angle . Constraints on the solar transitions into a mixture of active and sterile neutrinos are also presented. Finally, we give predictions for the day-night asymmetry in the SNO experiment, for the event rate in the BOREXINO and LowNu experiments, and discuss briefly the constraints on the solar neutrino oscillation parameters which can be obtained with prospective KamLAND data.
1 Introduction
The past two years have witnessed remarkable experimental progress in the studies of neutrino mixing and oscillations. The latest addition to this magnificent effort is the salt phase data from the SNO experiment [1].
In 2001, the evidences for solar neutrino oscillations [2] obtained in the pioneering experiment of Davis et al. (Homestake) [3, 4], and in the Kamiokande, SAGE, GALLEX/GNO [5] and Super-Kamiokande [6] experiments, were reinforced by the first results of the SNO experiment on the charged current (CC) reaction on deuterium induced by solar neutrinos [7]. In conjunction with the Super-Kamiokande (SK) scattering data, the SNO CC data established the existence of solar flavour conversion with a statistical significance of 3.3. This conclusion was further corroborated by the 2002 SNO data on the neutral current (NC) reaction on deuterium, caused by solar neutrinos [8]. The combined CC and NC SNO data showed at 5.3 the presence of a nonzero and/or component in the flux of the solar neutrinos reaching the Earth. At each stage, the SNO data enabled one to determine with improved precision the average solar survival probability from the CC reaction data, and the flux normalisation from the data on the NC reaction. This in turn led to a diminishing of the allowed regions of values of the two parameters - the neutrino mass squared difference () and the mixing angle (), characterizing the solar neutrino oscillations. The SNO CC data had the main impact of ruling out the Small Mixing Angle (SMA) MSW [9] solution in conjunction with the SK data [7, 10, 11]. The SNO data from the phase111Here, and in the rest of the paper, by phase we mean the NC reactions due to the final state neutron capture on deuterium. showed a clear preference for the Large Mixing Angle (LMA) MSW solution of the solar neutrino problem, disfavoring the relatively low (LOW, QVO) solutions [8, 12]. The first results of the KamLAND experiment [13], under the plausible assumption of CPT-invariance in the lepton sector, established the LMA solution as unique solution of the solar neutrino problem.
The combined two-neutrino oscillation analyses of the solar neutrino and KamLAND data, available before the publication of the SNO salt phase results, identified two distinct solution sub-regions within the LMA solution region at 99% C.L. (see, e.g., [14, 15]). The best fit values of and in the two sub-regions - low-LMA and high-LMA, were found to be , , and , , respectively [14]. The low-LMA solution was preferred statistically by the data. At 99.73% C.L. (3) the two regions merged and one obtained:
| (1) |
In the case of 3-neutrino mixing, the analysis of the solar neutrino and KamLAND data involves an additional parameter - the neutrino mixing angle limited by the CHOOZ and Palo Verde experiments [16]. The precise upper limit on depends on the value of - the neutrino mass squared difference responsible for the atmospheric and oscillations. The preliminary results of an improved analysis of the SK atmospheric neutrino data, performed recently by the SK collaboration, gave [17]
| (2) |
with a best fit value eV2.
After the KamLAND results the two major issues to be settled with the future solar neutrino and KamLAND data are:
-
•
Resolving the ambiguity between the low-LMA and the high-LMA solutions and thereby obtaining tighter constraints on .
-
•
Constraining further the allowed range of the solar neutrino mixing angle, .
In the present article we examine some of the physics implications of the latest salt phase data from SNO [1]. We study, in particular, the effect of these data on the allowed ranges of the solar neutrino oscillation parameters, and . This is done in the cases of two- and three- neutrino mixing. In the latter case we obtain an upper limit on the angle . Constraints on the solar transitions into a mixture of active and sterile neutrinos, i.e., on the allowed sterile fraction, are also presented. Finally, we give predictions for the day-night asymmetry in the SNO experiment, for the event rate in the BOREXINO and LowNu experiments, and discuss briefly the constraints on the solar neutrino oscillation parameters which can be obtained with future KamLAND data.
2 Two-neutrino oscillation analysis
2.1 Analysis with global solar neutrino data
| Data | best-fit parameters | 99% C.L. allowed range | ||
|---|---|---|---|---|
| set used | /(eV2) | /(eV2) | ||
| Cl+Ga+SK+ | 0.29 | |||
| Cl+Ga+SK+salt | 0.28 | |||
| Cl+Ga+SK++salt | 0.29 | |||
| Cl+Ga+SK++KL | 0.3 | |||
| Cl+Ga+SK++salt+KL | 0.3 | |||
In this Section we first perform a two-neutrino oscillation analysis of the global solar data, incorporating the new SNO results. We include the total rates from the radiochemical experiments Cl and Ga (Gallex, SAGE and GNO combined) [5] and the 1496 day 44 bin SK Zenith angle spectrum data [6] 222SK has recently reanalyzed their day/night data with improved precision [18]. However, the information content in [18] is not enough for including it in our analysis.. For SNO we take the combined CC, NC and Electron Scattering (ES) 34 bin energy spectrum data from the phase [8], and the recently reported CC, NC and ES rates from the latest salt phase of the experiment [1] 333Note that the salt enriched data from SNO gives the CC, ES and NC total rates without any assumption on the spectrum shape.. To ascertain the impact of the salt phase data and facilitate comparison between the impact of the data from the different phases, the SNO data is included in the following three ways in our analysis:
-
1.
Use only the CC+ES+NC day/night spectra data from the phase,
-
2.
Use only the CC, ES and NC event rate data from the salt phase,
-
3.
Use data from both phases together.
We follow the instructions given in [19] by the SNO Collaboration in treating the SNO data.
For our statistical analysis of the global solar neutrino data we follow a covariant approach and minimise the defined as
| (3) |
where are the solar data points, is the number of data points and is the inverse of the covariance matrix, containing the squares of the correlated and uncorrelated experimental and theoretical errors. The flux normalisation factor is left to vary freely in the analysis. For further details of our solar neutrino data analysis we refer the reader to our earlier papers [10, 12].
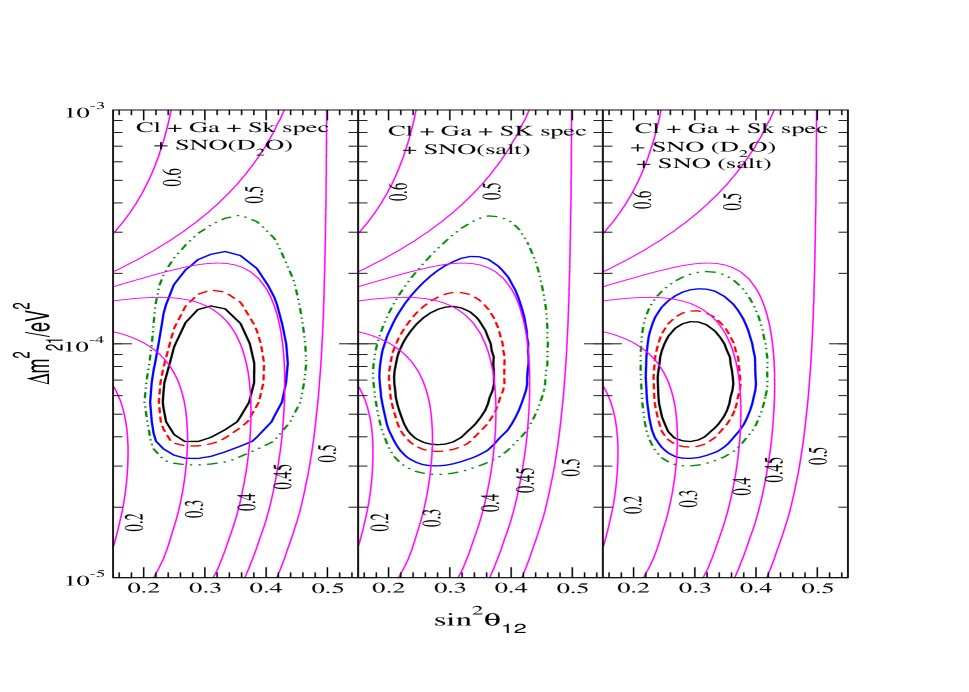
The results of the analysis of the global solar neutrino data are presented in Table 1 and Figure 1. Table 1 gives the best-fit points and the allowed range of parameter values. The best-fit for the global analysis, including the complete SNO data from both phases, is obtained at eV2, and . Note that if we consider only the salt phase data from SNO, the best-fit value of is marginally lower.
In the left panel of Figure 1 we show the allowed region in the parameter space when only the spectrum data from the phase are included. In the middle panel the allowed region, obtained by including the SNO salt phase data but excluding the SNO spectrum data from the phase, is presented. A comparison of the two panels shows that with the exclusion of the phase spectrum data, the allowed region enlarges in size. Even though the SNO data from the phase agrees remarkably well with the salt phase data, the ratio of CC and NC event rates, , is slightly different for the two phases. In particular, for the phase, if one uses the data given by SNO for the null hypothesis, one gets for the ratio . For the salt phase, the ratio is . Thus, the CC to NC event rate ratio has decreased, which has very important implications in constraining and [20, 21] (see also [22]). In Figure 1 the iso- contour lines are superimposed on the allowed regions in the plane. The figure clearly shows that since the for the salt phase data is lower, the allowed regions shift left, following the iso- contours. This results in the shift of the allowed range of to smaller values (see Table 1). The allowed shift to lower values as well for the same reason.
The third panel shows the allowed regions, obtained by including the SNO data from both the phase and the salt phase. Following the SNO collaboration [19], we treat these two phases as separate experiments with no correlation between them. Combination of the salt phase and the phase data produce a more restrictive upper bound on eV2 (99.73% C.L.). The upper limit on also improves compared to what we have before the salt phase data, as can be seen by comparing the first panel with the last one in Figure 1. The exact intervals in which the solar neutrino oscillations parameters are constrained to lie are given in Table 1.
2.2 Constraints from combined solar and KamLAND data
We next include the 162 ton-year results from the KamLAND experiment in the analysis. We use the 13 bin KamLAND spectrum data and defined a assuming a Poissonian distribution as
| (4) |
where is taken to be 6.42% and allowed to vary freely (see [14] for the details of the analysis). In the last 2 rows of Table 1 we give the best-fit data points and the allowed ranges of the parameters obtained before and after including the latest salt phase SNO data in the global analysis. The best-fit point for the combined global analysis is in the low-LMA region at eV2 and . Thus, the best-fit values of the parameters for the combined solar+KamLAND data analysis do not change after inclusion of the latest SNO results. The inclusion of the salt data results in an improvement in the precision of the flux normalisation from , obtained without the salt phase data, to (3 results). The agreement with the Standard Solar Model prediction [23] is excellent.
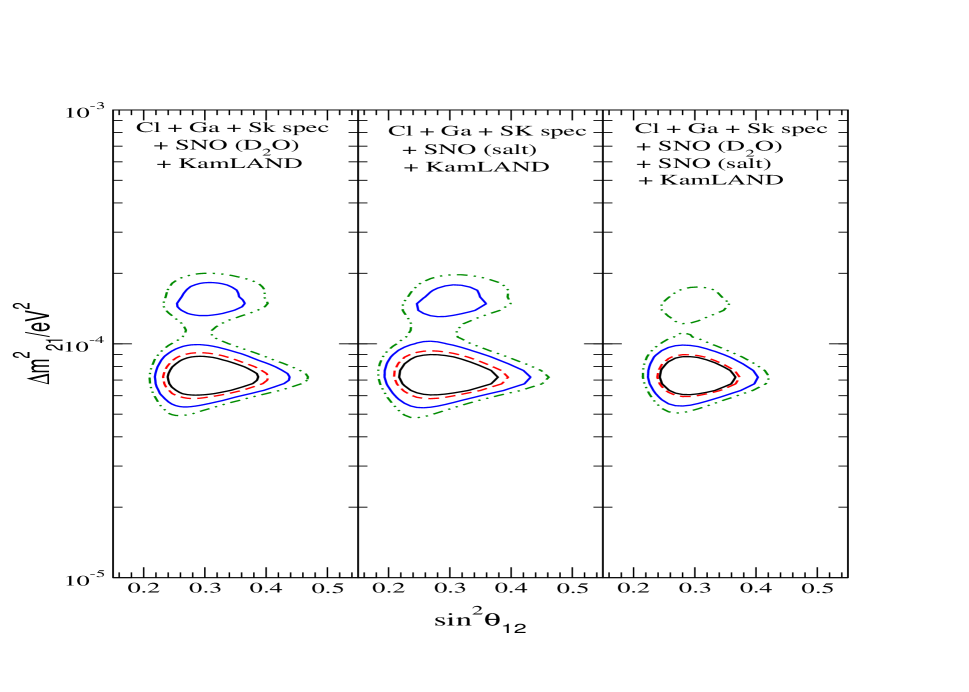
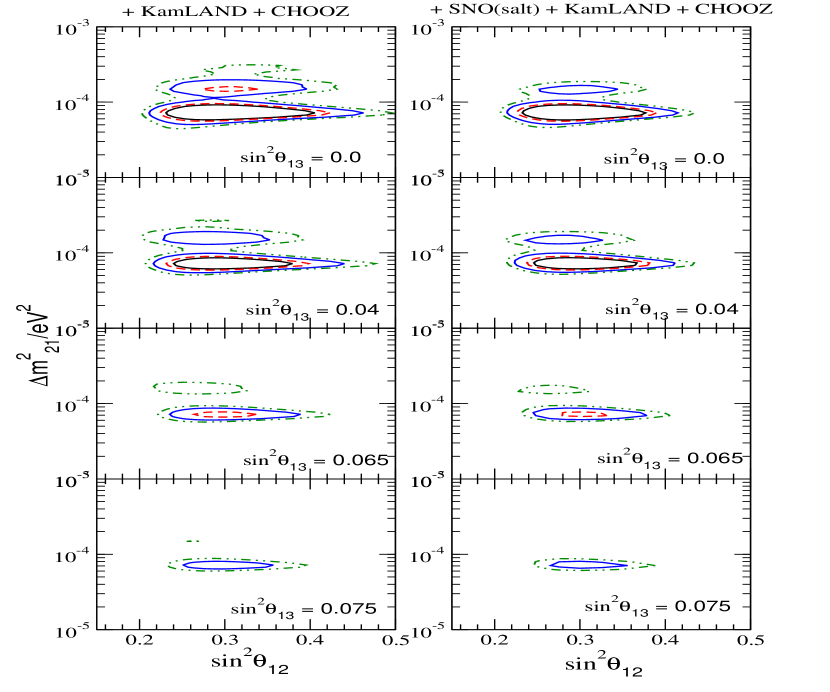
In Figure 2 we present the corresponding allowed regions. Again we show results separately for only the phase (left-hand panel), only the salt phase (middle panel) and the global data, with the two phases combined (right-hand panel). Note the shift of the allowed regions in the middle panel which includes only the salt phase data, to smaller values of . We find that the separate inclusion of the data from each phase of SNO, in the combined analysis with the KamLAND data, allows the high-LMA solution at 99% C.L.. However when the global solar neutrino data – with data from both phases of SNO combined – is included with the KamLAND data, the high-LMA region is allowed only at 99.13% C.L. (2.63) corresponding to a difference of of 9.5, with respect to the global obtained in the low-LMA region.
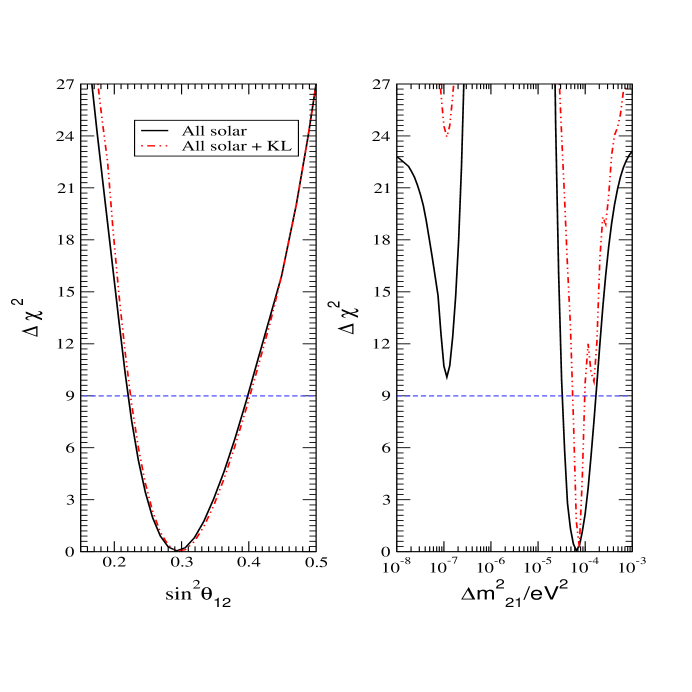
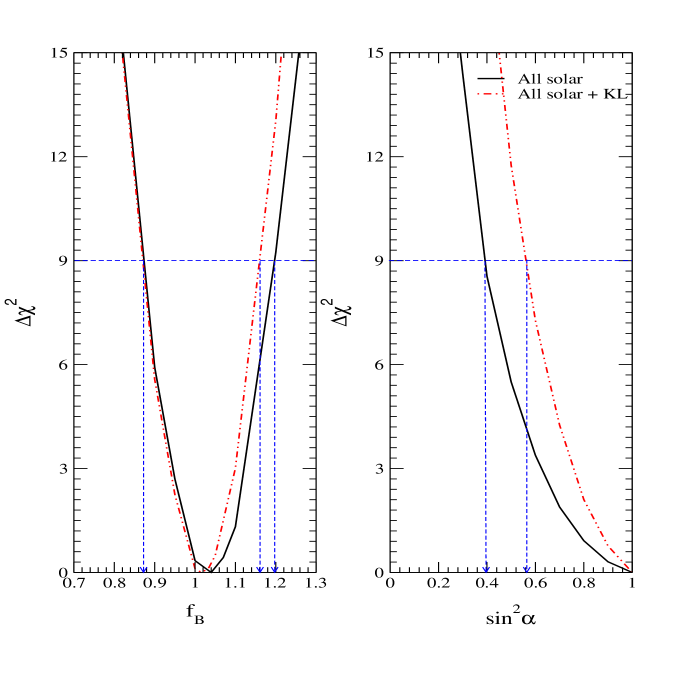
In Figure 3 we show the dependence of on and respectively, after marginalising over the remaining free parameters. The solid lines represent the for the global solar neutrino data, while the dot-dashed curves correspond to the combined solar and KamLAND data. We note that the corresponding to the LOW solution is ruled out at slightly more than by the solar neutrino data alone, and at nearly from the combined solar and KamLAND data. KamLAND results are seen to produce a remarkable constraint on . Maximal mixing is now ruled out at more than level by the solar data alone. The KamLAND data does not put a strong constraint on .
3 Bounds from three-neutrino oscillation analysis
So far we have presented results obtained in the framework of two-neutrino oscillations, where the solar oscillates into another active neutrino with a different flavor. However, if the mixing angle which is restricted by the CHOOZ and Palo Verde data is not zero, the solar oscillations will involve also the third heaviest neutrino mass eigenstate, with the associated neutrino mass squared difference given by . The relevant electron neutrino/antineutrino survival probability in the three-neutrino mixing case is given by the following expression:
| (5) |
where is the survival probability for two-neutrino mixing (see, e.g., [25]). In the case of solar neutrinos, is the two-neutrino oscillation survival probability [26] with the solar electron number density replaced by . The term can be neglected to a good approximation in eq. (5). Since for the solar neutrinos one has in the low-LMA region, we have . For the reactor detected in the KamLAND experiment, the matter effects are negligible and one gets , where is the source-detector distance and the antineutrino energy. As Eq. (5) indicates, the presence of a non-zero shifts obtained from the two-neutrino oscillation solar neutrino data analysis to larger values. In contrast, for the reactor antineutrinos, one can expect the allowed range of , determined from a two-neutrino mixing analysis of the reactor antineutrino data, to shift to smaller values, if is non-zero and is sufficiently large. The survival probability for the short-baseline CHOOZ experiment is approximately given by and is hence very sensitive to the range of allowed value of atmospheric neutrino mass squared difference, 444In our numerical calculation we use the probability keeping the terms [27].. Therefore with the shift of to lower values in the new SK analysis, the constraint on from CHOOZ is expected to get affected. The information in [17] is not sufficient for a full global analysis using the SK atmospheric data. We adopt the following procedure. We allow to vary freely within the range given in [24], obtained using the updated SK [17] and K2K [28] results and perform a combined three-neutrino oscillation analysis of the global solar neutrino and reactor data, including both the KamLAND and CHOOZ results (for earlier global three generation analyses see, e.g. [29]).
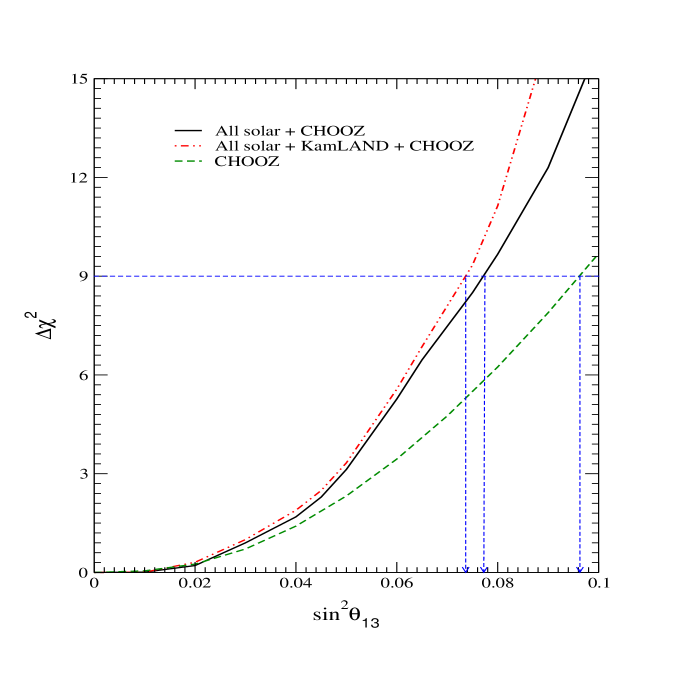
In Figure 4 we present the obtained for various fixed values of , when all other parameters are allowed to vary freely. The bounds on , obtained from the global solar neutrino and CHOOZ data analysis, can be directly read from the figure as . The bound derived from the combined analysis of the solar neutrino, CHOOZ and KamLAND data tightens somewhat to . 555If we let to vary within the range allowed by the earlier SK analysis we get . Thus the ratio of the old and the new bound on is 1.3 and this matches with the corresponding results in [24]. We have checked that at each C.L. the value of the old and the new limit differs by this same factor.. As a result of lowering of the range according to the new SK atmospheric neutrino data analysis, the bound obtained from only CHOOZ data weakens: as can be seen from figure 4, this bound reads now as . We have checked that the marginalised bounds on and , even for the three-generation analysis, are the same as those given in Figure 3.
In Figure 5 we present the allowed regions in the plane, for four fixed values of for cases with and without the SNO salt data. With the inclusion of the salt data the allowed regions decrease in size for all values of . The presence of a small non-zero improves the fit in the regions of the parameter space with higher values of , i.e., in the high-LMA zone, where the neutrino transitions are not affected by matter effects over a part of the energy spectrum [30], and which therefore give a larger value of the CC/NC event rate ratio. The presence of the factor in the survival probability acts as a normalisation which effectively reduces the CC event rate and hence makes the high-LMA region less disfavored by the data. Since matter effects in the Sun are relatively small for the high-LMA values of , the allowed regions in these zones appear at smaller values of , as discussed above. However, as increases, the allowed areas shrink and finally vanish for . Note that we get allowed regions at even though from Figure 4 the range appears to be . This is because in Figure 5 we use a which corresponds to a three parameter fit.
4 Constraints on transitions into a state with a sterile neutrino component
As is well known, the explanation of the positive evidences of oscillations from the LSND [31] experiment and the solar and atmospheric neutrino oscillation data requires the existence of a fourth neutrino which has to be inert [32]. A comparison of the SNO CC and NC data from the phase had already ruled out solar oscillations into pure sterile state at 5.3 [8]. The inclusion of the SNO salt phase data raises the degree of disfavour to 7.8 level [1]. However, transitions to “mixed” states, where the final neutrino state is a mixture of active and sterile components, is still allowed by the data. We find the limits on the sterile fraction from the global data. Bounds on allowed fraction of sterile component in the solar flux has earlier been obtained in [33].
We consider a general case where the produced in the Sun transforms into a “mixed” state given by . Thus, gives the fraction of the active (sterile) component in the resultant solar neutrino flux at Earth. In Figure 6 we present the plots of vs (left-hand panel), and vs (right-hand panel), allowing the mass and mixing parameters to vary freely in the LMA region. The solid lines show the constraints from the solar data alone, while the dot-dashed lines correspond to the combined solar and KamLAND data. The range of allowed values of , determined from the global solar (solar+KamLAND) data analysis at is . The allowed value for the sterile fraction in the resultant solar neutrino flux at Earth is constrained to at by the solar (solar+KamLAND) data. Before the SNO salt phase data was announced, the corresponding limit for the sterile fraction at from the combined solar+KamLAND data analysis was . Thus, the SNO salt data is seen to tighten the noose on the possible presence of a sterile component in the solar neutrino flux.
5 Future and outlook
With the latest salt phase data from SNO giving further credence to the low-LMA solution, we are entering the era of precision measurements in the field of solar neutrino physics. The high-LMA solution stands disfavored at more than 99% C.L. and only a small area appears at the level. The next phase of the SNO experiment will be devoted to obtaining neutral current data using Helium counters [34]. This would give a totally uncorrelated information on the CC and NC event rates observed at SNO. In the near future, SNO is expected to provide data on the day/night spectrum, which could be used in a statistical analysis to further constrain the solar neutrino oscillation parameters [21, 35]. One of the related observables is the day-night asymmetry:
| (6) |
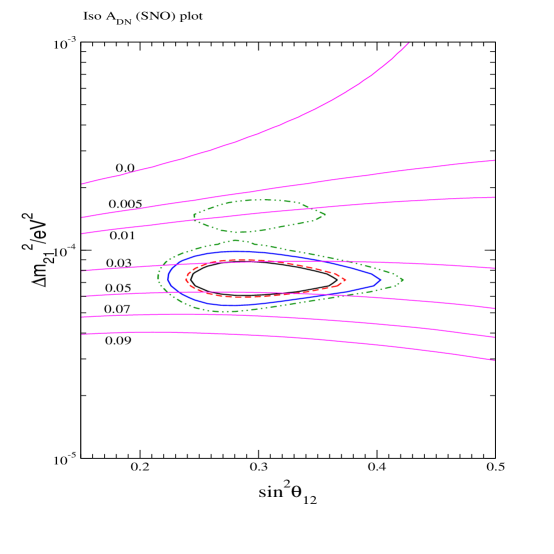
In Figure 7 we show the lines of constant for SNO. The predicted in SNO, for the current best-fit values of the parameters in the low-LMA region, as well as the corresponding range, are given by
| (7) |
For the barely allowed high-LMA solution we get:
| (8) |
The potential of Borexino [36] and any generic electron scattering experiment for the low energy neutrinos – the LowNu experiments [37] – in constraining the mass and mixing parameters have been studied most recently in [38, 39]. For the allowed regions obtained in the current paper, we find the predicted rates for Borexino and LowNu experiments to be
| (9) | |||||
| (10) |
High precision measurement
results
can be
expected
from the reactor experiment
KamLAND [40].
With statistics of 1 kTy,
the KamLAND data
could reduce the uncertainty in the
determination to a
few percent [38].
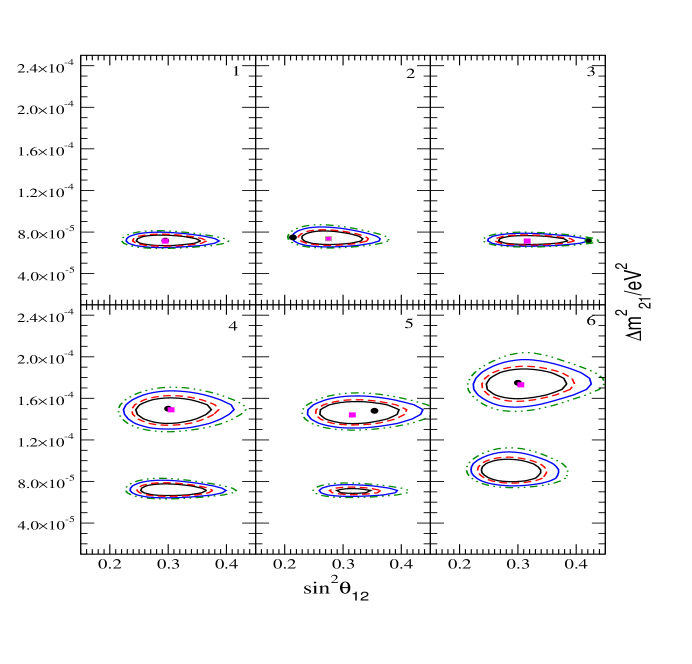
In Figures 8
and 9
we present
the two-neutrino mixing
allowed regions
in the plane,
obtained
from a combined analysis of the
current global solar neutrino data and a prospective
0.41 kTy
666This corresponds to 2.5 times the statistics of the
first published data from KamLAND. and
1 kTy simulated data in KamLAND.
Since in future the systematic uncertainty in KamLAND data
is expected to be reduced
(especially with the fiducial volume calibration),
we use a value of 5% for the KamLAND systematic error in this analysis.
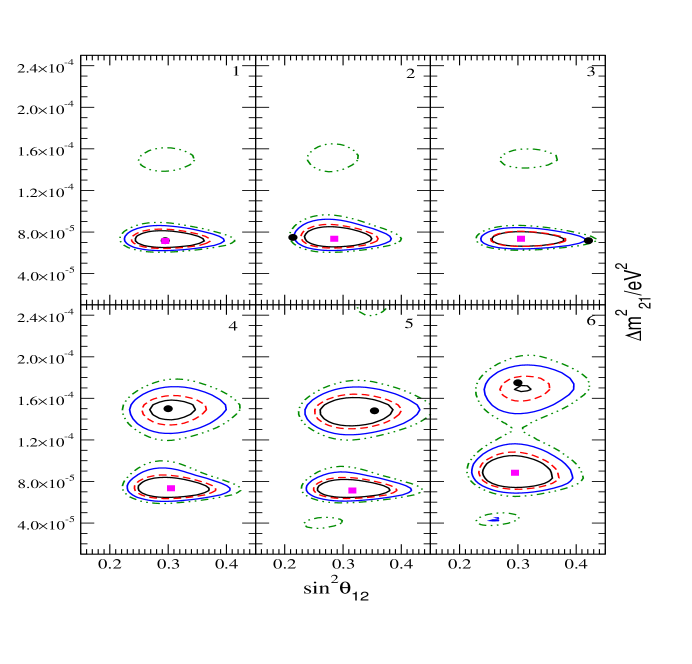
The black dots in the various
panels of Figures 8 and 9
denote the point in the parameter
space, for which the data has been simulated. The pink squares give the
best-fit points obtained in the joint analysis. For the upper
row of panels, the points at which we simulate the KamLAND data lie in the
low-LMA region.
We note that if the true solution lies in the low-LMA region,
a spurious high-LMA solution still appears at level
in the case of 0.41 kTy of statistics,
though the allowed area gets further reduced in size, owing to the
precision of the KamLAND data.
The high-LMA solution disappears if the statistics is
increased to 1.0 kTy.
For all the panels the precision on the
range of allowed value of is seen to improve.
There is little improvement, however, in the precision
of [38, 41].
One expects a significant improvement in the precision of
over the low-LMA region to come from a more precise measurement [42]
of the CC/NC ratio at the next phase
of SNO.
In the lower row of Figures 8
and 9
we illustrate a
scenario that would show itself if the future KamLAND data conforms to
a point in the high-LMA region. Since the low-LMA solution
is now strongly
favored over the high-LMA one by the global solar neutrino data, if
such a contradictory situation arises whereby the KamLAND data alone
would favor the high-LMA solution,
both solutions would get allowed and the
solution ambiguity would remain.
As can been seen in the last row panels of
Figures 8 and 9,
the best-fit point comes in the low-LMA (high-LMA)
region for 0.41 kTy (1 kTy) statistics.
We have checked that if we simulate the spectrum in the
high-LMA region, the best-fit shifts from the low-LMA to
the high-LMA region after KamLAND collects about 1 kTy statistics.
6 Conclusions
We analysed the impact of the salt phase data from the SNO experiment in global solar neutrino oscillation analysis, including the KamLAND data as well. The inclusion of the CC and NC event rates from the SNO salt phase data strongly favours to lie in the low-LMA region. Values of in the LOW area get disfavoured at more than 3 just from global solar neutrino data, and at almost from the combined solar and KamLAND data. The combined effect of the SNO spectrum data from the phase and of the data from the salt phase results in lowering the upper bound on to eV2 (99.73% C.L.). The global solar + KamLAND data still admit the high-LMA solution, but it appears only at 2.63 level. The addition of the new SNO data restricts the mixing angle from above and maximal mixing is now excluded at more than 5. With the inclusion of non-zero values of the mixing angle in a 3-neutrino mixing analysis, the allowed regions in the plane decrease in size as increases. At no allowed regions are obtained at 99.73% C.L. The solution due to transitions into sterile neutrino is excluded at 7.8 with the salt phase data. However, solar transitions into a mixed sterile + active state are allowed, with the sterile fraction restricted to be 44% at 3. With the knowledge of and responsible for the solar neutrino oscillations becoming more precise, the predicted ranges for the day-night asymmetry in SNO, and of the event rates in Borexino and the LowNu, experiments narrow down. We also studied the impact of the prospective increase in statistics of the KamLAND data, on the determination of the solar neutrino oscillation parameters. If the spectrum is simulated at a point in the low-LMA region, the allowed 3 area in the high-LMA zone reduces in size in the case of 0.41 kTy of data, and disappears if the statistics is increased to 1.0 kTy. If, however, the KamLAND spectrum corresponds to a point in the high-LMA zone, the conflicting trend of solar and KamLAND data would make the high-LMA solution reappear at 90% C.L. and the determination of would remain ambiguous.
The authors would like to thank E. Lisi for clarifying comments concerning ref. [24]. S.G. would like to thank The Abdus Salam International Centre for Theoretical Physics for hospitality.
References
- [1] S. N. Ahmed et al. [SNO Collaboration], arXiv:nucl-ex/0309004.
- [2] B. Pontecorvo, Zh. Eksp. Teor. Fiz. 53 (1967) 1717.
- [3] B. Pontecorvo, Chalk River Lab. report PD–205, 1946.
- [4] R. Davis, D.S. Harmer and K.C. Hoffman, Phys. Rev. Lett. 20, 1205 (1968); R. Davis, Proc. of the “Neutrino ‘72” Int. Conference, Balatonfured, Hungary, June 1972 (eds. A. Frenkel and G. Marx, OMKDK-TECHNOINFORM, Budapest, 1972), p.5.
- [5] B. T. Cleveland et al., Astrophys. J. 496, 505 (1998); J. N. Abdurashitov et al. [SAGE Collaboration], J. Exp. Theor. Phys. 95, 181 (2002) [Zh. Eksp. Teor. Fiz. 122, 211 (2002)] [arXiv:astro-ph/0204245]; W. Hampel et al. [GALLEX Collaboration], Phys. Lett. B 447, 127 (1999); E. Bellotti, Talk at Gran Sasso National Laboratories, Italy, May 17, 2002; T. Kirsten, talk at Neutrino 2002, XXth International Conference on Neutrino Physics and Astrophysics, Munich, Germany, May 25-30, 2002. (http://neutrino2002.ph.tum.de/).
- [6] S. Fukuda et al. [Super-Kamiokande Collaboration], Phys. Lett. B 539, 179 (2002) [arXiv:hep-ex/0205075].
- [7] Q. R. Ahmad et al. [SNO Collaboration], Phys. Rev. Lett. 87, 071301 (2001) [arXiv:nucl-ex/0106015].
- [8] Q. R. Ahmad et al. [SNO Collaboration], Phys. Rev. Lett. 89, 011301 (2002) [arXiv:nucl-ex/0204008]; Q. R. Ahmad et al. [SNO Collaboration], Phys. Rev. Lett. 89, 011302 (2002) [arXiv:nucl-ex/0204009].
- [9] L. Wolfenstein, Phys. Rev. D 17, 2369 (1978) ; S. P. Mikheev and A. Y. Smirnov, Sov. J. Nucl. Phys. 42 (1985) 913 [Yad. Fiz. 42, 1441 (1985)].
- [10] A. Bandyopadhyay, S. Choubey, S. Goswami and K. Kar, Phys. Lett. B 519, 83 (2001) [arXiv:hep-ph/0106264].
- [11] G.L. Fogli, E. Lisi, D. Montanino, A. Palazzo, Phys. Rev. D64, 093007 (2001); J.N. Bahcall, M.C. Gonzalez-Garcia, C. Pana-Garay, JHEP 0108, 014 (2001); P. I. Krastev and A. Y. Smirnov, Phys. Rev. D 65, 073022 (2002) [arXiv:hep-ph/0108177]; M.V. Garzelli and C. Giunti, JHEP 0112, 017 (2001).
- [12] A. Bandyopadhyay, S. Choubey, S. Goswami and D. P. Roy, Phys. Lett. B 540, 14 (2002) [arXiv:hep-ph/0204286]; S. Choubey, A. Bandyopadhyay, S. Goswami and D. P. Roy, arXiv:hep-ph/0209222 and references therein.
- [13] K. Eguchi et al. [KamLAND Collaboration], Phys. Rev. Lett. 90, 021802 (2003) [arXiv:hep-ex/0212021].
- [14] A. Bandyopadhyay, S. Choubey, R. Gandhi, S. Goswami and D. P. Roy, Phys. Lett. B 559, 121 (2003) [arXiv:hep-ph/0212146].
- [15] G. L. Fogli et al., Phys. Rev. D 67, 073002 (2003) [arXiv:hep-ph/0212127]; M. Maltoni, T. Schwetz and J. W. Valle, Phys. Rev. D 67, 093003 (2003) [arXiv:hep-ph/0212129]; J. N. Bahcall, M. C. Gonzalez-Garcia and C. Pena-Garay, JHEP 0302, 009 (2003) [arXiv:hep-ph/0212147]; H. Nunokawa, W. J. Teves and R. Zukanovich Funchal, Phys. Lett. B 562, 28 (2003) [arXiv:hep-ph/0212202]; P. Aliani et al., arXiv:hep-ph/0212212; P. C. de Holanda and A. Y. Smirnov, JCAP 0302, 001 (2003) [arXiv:hep-ph/0212270].
- [16] M. Apollonio et al., Phys. Lett. B466 (1999) 415; F. Boehm et al., Phys. Rev. D62 (2000) 072002.
- [17] Super-Kamiokande Coll., Y. Hayato et al., Talk given at the Int. EPS Conference on High Energy Physics, July 17 - 23, 2003, Aachen, Germany.
- [18] [Super-Kamiokande Collaboration], arXiv:hep-ex/0309011.
- [19] “HOWTO use the SNO Salt Flux Results”, and “HOWTO use the SNO Solar Neutrino Spectral data”, SNO Collaboration, http://www.sno.phy.queensu.ca/.
- [20] M. C. Gonzalez-Garcia, C. Pena-Garay, Y. Nir and A. Y. Smirnov, Phys. Rev. D 63, 013007 (2001) [arXiv:hep-ph/0007227].
- [21] M. Maris and S. T. Petcov, Phys. Lett. B 534 (2002) 17 [arXiv:hep-ph/0201087].
- [22] J. N. Bahcall and E. Lisi, Phys. Rev. D 54, 5417 (1996) [arXiv:hep-ph/9607433]; E. Lisi and D. Montanino, Phys. Rev. D56 (1997) 1792; J. N. Bahcall, P. I. Krastev and A. Y. Smirnov, Phys. Rev. D 62, 093004 (2000) [arXiv:hep-ph/0002293]; J.N. Bahcall, P.I. Krastev and A. Y. Smirnov, JHEP 0105 (2001) 015; J.N. Bahcall, M.C. Gonzalez-Garcia and C. Peña-Garay, JHEP 0204 (2002) 007.
- [23] J.N. Bahcall, M.H. Pinsonneault and S. Basu, Astrophys. J. 555, 990 (2001).
- [24] G. L. Fogli, E. Lisi, A. Marrone, D. Montanino, A. Palazzo and A. M. Rotunno, arXiv:hep-ph/0308055.
- [25] S.T. Petcov, Phys. Lett. B 214, 259 (1988).
- [26] S.T. Petcov, Phys. Lett. B 200, 373 (1988), and Phys. Lett. B 214, 139 (1988); S.T. Petcov and J. Rich, Phys. Lett. B 224, 401 (1989); P.I. Krastev and S.T. Petcov, Phys. Lett. B 207, 64 (1988); E. Lisi et al., Phys. Rev. D 63, 093002 (2000).
- [27] S.M. Bilenky, D. Nicolo and S.T. Petcov, Phys. Lett. B538 (2002) 77.
- [28] M. H. Ahn et al. [K2K Collaboration], Phys. Rev. Lett. 90, 041801 (2003) [arXiv:hep-ex/0212007].
- [29] G. L. Fogli, E. Lisi and D. Montanino, Phys. Rev. D 54, 2048 (1996) [arXiv:hep-ph/9605273]; M. C. Gonzalez-Garcia, M. Maltoni, C. Pena-Garay and J. W. F. Valle, Phys. Rev. D 63, 033005 (2001) [arXiv:hep-ph/0009350]; A. Bandyopadhyay, S. Choubey, S. Goswami and K. Kar, Phys. Rev. D 65 (2002) 073031 [arXiv:hep-ph/0110307]; G. L. Fogli, G. Lettera, E. Lisi, A. Marrone, A. Palazzo and A. Rotunno, Phys. Rev. D 66, 093008 (2002) [arXiv:hep-ph/0208026]; M. C. Gonzalez-Garcia and C. Pena-Garay, Phys. Rev. D 68, 093003 (2003) [arXiv:hep-ph/0306001].
- [30] S. Choubey, S. Goswami and D. P. Roy, Phys. Rev. D 65 (2002) 073001 [arXiv:hep-ph/0109017]; S. Choubey, S. Goswami, N. Gupta and D. P. Roy, Phys. Rev. D 64 (2001) 053002 [arXiv:hep-ph/0103318].
- [31] C. Athanassopoulos et al., (The LSND Collaboration) Phys. Rev. Lett. 77, 3082 (1996); C. Athanassopoulos et al., (The LSND Collaboration) Phys. Rev. Lett. 81, 1774 (1998).
- [32] For an exhaustive list of reference for analysis including sterile neutrinos see .
- [33] An incomplete list of relevant references includes:: V. D. Barger, D. Marfatia and K. Whisnant, Phys. Rev. Lett. 88, 011302 (2002) [arXiv:hep-ph/0106207]; A. Bandyopadhyay, S. Choubey, S. Goswami and D. P. Roy, Mod. Phys. Lett. A 17, 1455 (2002) [arXiv:hep-ph/0203169]; J. N. Bahcall, M. C. Gonzalez-Garcia and C. Pena-Garay, Phys. Rev. C 66, 035802 (2002) [arXiv:hep-ph/0204194]; P. C. de Holanda and A. Y. Smirnov, arXiv:hep-ph/0211264; M. Maltoni, T. Schwetz, M. A. Tortola and J. W. F. Valle, Phys. Rev. D 67, 013011 (2003) [arXiv:hep-ph/0207227].
- [34] J. Formaggio, talk at 5th International Workshop on Neutrino Factories & Superbeams, NuFact ’03, Columbia University, New York, 5-11 June 2003; http://www.cap.bnl.gov/nufact03.
- [35] M. Maris and S. T. Petcov, Phys. Rev. D 62, 093006 (2000), (arXiv:hep-ph/0003301); G. L. Fogli, E. Lisi, D. Montanino and A. Palazzo, Phys. Rev. D 62, 113003 (2000) [arXiv:hep-ph/0008012]; M. C. Gonzalez-Garcia, C. Pena-Garay and A. Y. Smirnov, Phys. Rev. D 63, 113004 (2001), [arXiv:hep-ph/0012313].
- [36] G. Alimonti et al. [Borexino Collaboration], Astropart. Phys. 16, 205 (2002) [arXiv:hep-ex/0012030].
- [37] S. Schönert, talk at Neutrino 2002, Munich, Germany, (http://neutrino2002.ph.tum.de).
- [38] A. Bandyopadhyay, S. Choubey and S. Goswami, Phys. Rev. D 67, 113011 (2003) [arXiv:hep-ph/0302243].
- [39] J. N. Bahcall and C. Pena-Garay, JHEP 0311, 004 (2003) [arXiv:hep-ph/0305159].
- [40] V. D. Barger, D. Marfatia and B. P. Wood, Phys. Lett. B 498, 53 (2001) [arXiv:hep-ph/0011251]; H. Murayama and A. Pierce, Phys. Rev. D 65, 013012 (2002) [arXiv:hep-ph/0012075]; A. de Gouvea and C. Pena-Garay, Phys. Rev. D 64, 113011 (2001) [arXiv:hep-ph/0107186]; A. Bandyopadhyay, S. Choubey, R. Gandhi, S. Goswami and D. P. Roy, J. Phys. G 29, 2465 (2003) [arXiv:hep-ph/0211266].
- [41] S. Choubey, S. T. Petcov and M. Piai, arXiv:hep-ph/0306017.
- [42] H. Robertson, talk at Eight international workshop on astroparticle and underground physics, TAUP 2003, Univ. of Washington, Seattle, Washington, September 5 - 9, 2003; http://mocha.phys.washington.edu/taup2003/.