RRC
”Kurchatov Institute”
IAE-6274/4
scattering at low energy:
S-wave phase shifts and scattering lengths.
V.N.Maĭorov, O.O.Patarakin
Russian Research Center ”Kurchatov Institute”,
Institute of General and Nuclear Physics,
pl. Kurchatova 1, 123182 Moscow, Russian Federation
E-mail: mvn@dnuc.polyn.kiae.su; patarak@dnuc.polyn.kiae.su
Abstract
On the basis of the S-wave phase shifts scattering behaviour from the threshold up to dipion mass , it is shown, that the linear correlation relates the S-wave phase shifts: , where . By using this correlation at the solution of the Roy equations, the accuracy of determination of S-wave lengths and is considerably improved: ; . The obtained result unambiguously witnesses in favor of the standard ChPT with large quark condensate.
PACS: 11.30.Qc; 11.55.Fv; 11.80.Et; 13.75.Lb; 14.40.Aq
Keywords: Roy equation; S-wave phase shift; S-wave scattering length; Chiral
Perturbation Theory
1 Introduction
The chiral symmetry of QCD Lagrangian is well known to be spontaneously broken down.
Two theories - Chiral Perturbation Theory (ChPT) [1,2] and Generalised Chiral Perturbation
Theory (GChPT) [3] based on QCD - can describe the strong interactions at low energies.
The determinative factor in these theories is the existence of vacuum condensates violating
chiral symmetry. These theories having the same form of the effective Lagrangian differ
from each other by value of quark condensate and light quark masses.
The fact determining the choice of the version is that
the S-wave scattering lengths and are very sensitive to the
parameters of the model and consequently are the key parameters for unambiguous
determination of the scenario of chiral symmetry violation. So, ChPT predicts the value
=0.220 and GChPT 111The S-wave scattering lengths
and are given in .
During some time, despite large accumulated experimental material on scattering lengths,
this choice was difficult to be made. The matter is that the experiment [4] gave
evidence in favor of GChPT, whereas most experiments inclined
rather to ChPT.
The situation has changed recently as the latest experiment E865 [5]
showed evidence for ChPT, i.e. for the version with strong quark condensate and small
masses of light quarks.
The present work shows that even without using the latest results,
based only on the information contained in experimental S-wave scattering
data array, it is possible to improve considerably the accuracy of determination
of and and thus to choose the scenario of chiral symmetry violation
for certain.
2 Roy equations
In our previous work [6] the Roy equations [7,8] were used to calculate the S-wave scattering lengths. The experimental values of the S- and P-wave phase shifts, obtained from an analysis of five charged channels, were presented by that time in all dipion mass region from the threshold up to [9-22]. Based on this fact we could realize the consecutive solution technique of the Roy equations without using iterative procedures. Due to this approach the problem of convergence of the solutions was eliminated automatically and the process of calculation of scattering lengths and becomes absolutely clear.
For the case of the charged pions, the Roy equations are given by :
Explicit expressions for 222Here and below, s is the Mandelstam variable, are given in [6]. The corrections , estimating the contributions from the higher waves () and from the large mass region were adopted from [23]. According to the theory [8] subtractions are defined as follow:
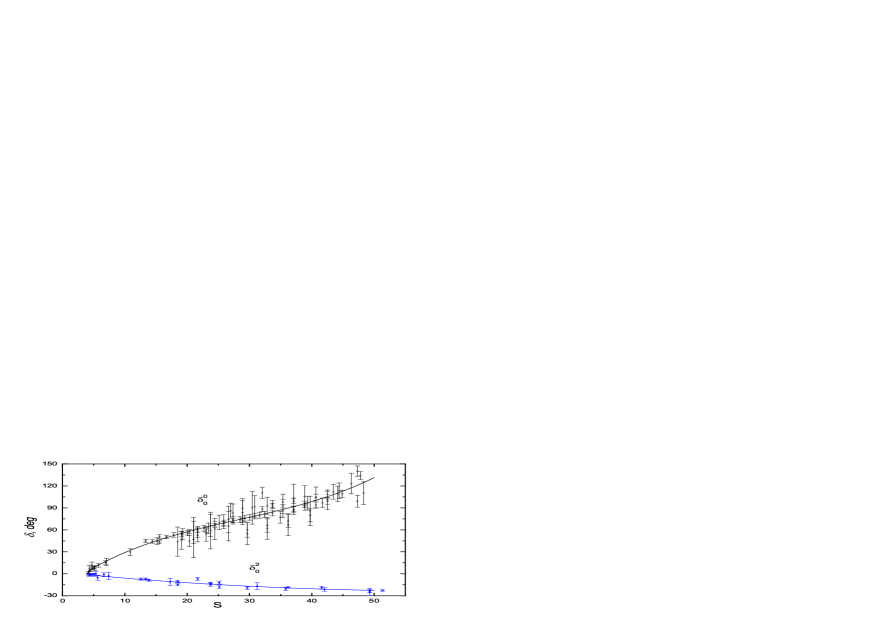
The solution of the Roy equations (1) comprised some steps. First, we performed fitting for each phase shifts and obtained smooth curves adequately describing experimental data. In particular for the S-wave phase shifts expansion (3) was used:
Where - is c.m. pion momentum and - are free parameters (I=0,2; . Experimental values of phase shifts and fitting curves (3) are shown in Fig.1. Then, the resulting smooth curve were input into the Roy equations (1) to find subtractions . At the conclusive stage we carried out fitting of the subtractions using terms (2) and determined the S-wave lengths. The resulting subtractions with fitting straight lines (2) are shown in Fig.2. Note that the phase shifts from ”electronic experiment” [18] were not used. This question was considered in [6] in detail.
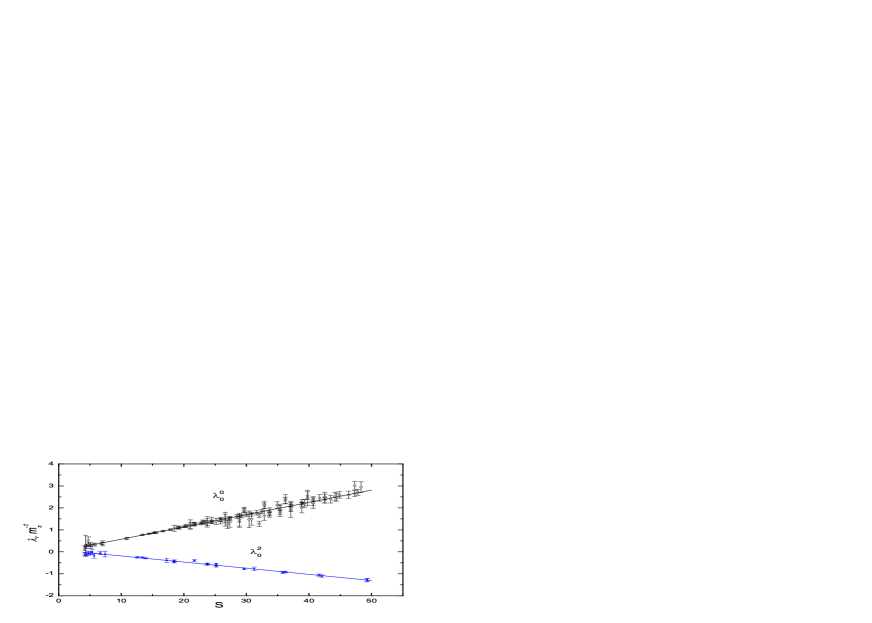
We stress that the linear relations were obtained indeed when fitting subtractions . For us, it is a proof of that all the calculation steps of the solving the Roy equations and also all the preliminary work comprising the fitting phase shifts in terms (3) were carried out correctly. In our previous study [6] we obtained:
with correlation coefficient r=0.945. We stress that in [6] we made use of all available experimental data, carried out the consequent analysis, but resulting uncertainties of and were so large that they did not allow to choose between ChPT and GChPT.
3 Correlation between and
The analysis which has been carried out showed that the general statistics contained in the available data for the phase shifts is enough to improve significantly the accuracy of determination of the S-wave scattering lengths and thus to choose correct ChPT version. But the strong correlation between and , which is present in any method of the solution of the Roy equations, in a latent form may be, prevents one to make the above and results in large uncertainties of the values and .
It should be noted, that the correlation between and is present in both
scenarios ChPT and GChPT [24] due to causes of fundamental nature.
The principal conclusion can be made that using model-independent analysis, based solely
on the Roy equations, it is impossible to increase the accuracy of definition of the S-wave
lengths and without removing
beforehand the correlation between them.
Therefore we need some additional constraint on and . And we shall
demonstrate that such constraint can be retrieved from the available data.
Let us analyse our previous result (4).
As the correlation coefficient r is very close to one,
it implies the values and are related by linear dependence.
Then, as near the threshold , the phase shifts
and must be related by linear dependence too.
In this way the simplest hypothesis, i.e. the hypothesis about
proportionality phase shifts into some area above the threshold, must be verify.
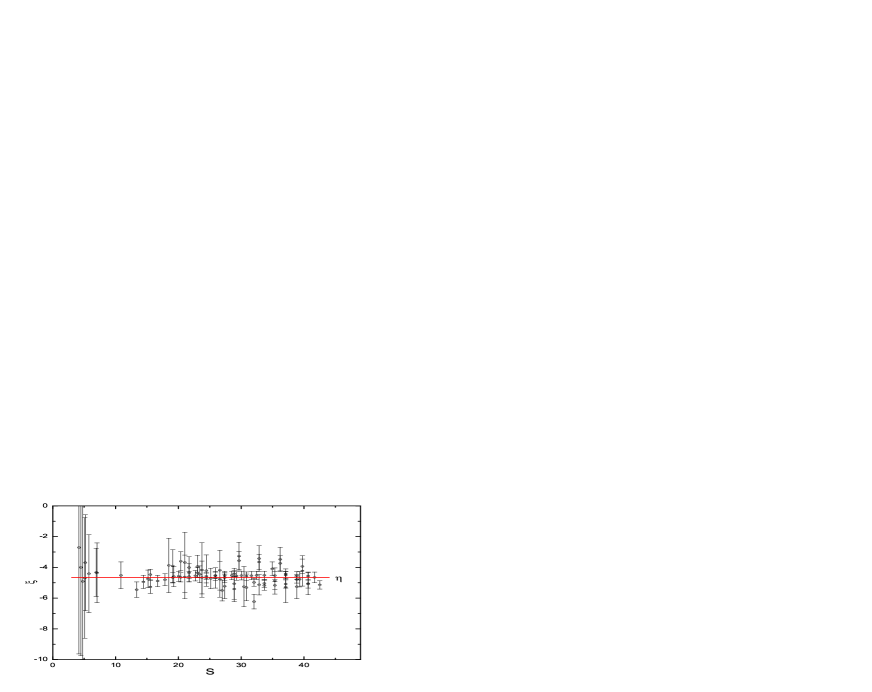
For this the ratio was analysed for the available
experimental data. As the phase shifts and were
measured mainly at different energy values, the smoothed curve (Fig.1) representing
the fitting function (3) was used for calculation of the phase shifts
at the points , where the phase shifts were measured.
Thus, the ratio of the S-wave phase shifts was calculated as
.
The values are given in Fig.3.
The uncertainties were calculated by the standard rule of propagation
of errors and finally they were defined both by errors of phase shifts
and .
The form of the dependence up to s=42, i.e. up to =900MeV,
makes one think that is really a constant in this energy region.
It witnesses in favor of the hypothesis being verified.
It was calculated by fitting –const for the
interval S = :
; =75; =80.
So, the proposed hypothesis is proved by statistics and consequently we can conclude that in the wide enough region the ratio of the S-wave phase shifts does not depend on energy. Thus the new correlation take place for this energy region:
where . As stated above, from the fact of strong correlation of the scattering lengths follows the linear dependence of the phase shifts near the threshold and such dependence is found in some region above the threshold. Based on these facts we suppose that the phase shifts proportionality keeps constant for all the energy region up to s=42.5. So we extrapolate the relation (5) down to the threshold and assume that the factor of proportionality keeps its value in close vicinity to the threshold. The fitting –const for the interval s = gets naturally the same value of , because statistical weights of the points near the threshold are insignificant. In general, vast uncertainties of the values near the threshold (Fig.3) are caused by the fact that the phase shifts and have large relative errors in that region. And apparently this situation will not change in the nearest future. If the relation (5) is true near the threshold, as we assume, then we obtain the new constraint on the scattering lengths:
This relation can be used to improve the accuracy of determination of the S-wave lengths.
4 Calculation of scattering lengths and
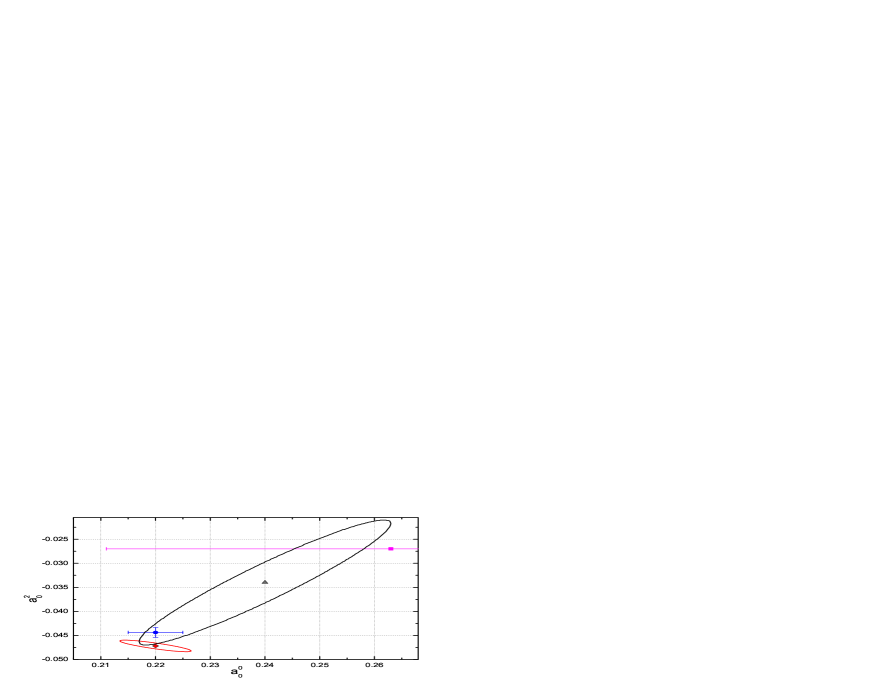
First, the estimation of the values and was made without using the Roy equations. Two equations, the correlation (6) and the equation of the ”universal curve” [25] were solved together. As a result we had:
It is necessary to note, that in the work [26] in which the ”universal curve” was introduced,
attempt also was made to estimate independently the ratio for further
calculating the S-wave lengths and .
Then, the correlation (6) was used as a supplementary condition when solving the Roy equations.
And we obtained at the end:
The final result (8) together with our previous result (4) as well as the theoretical predictions of ChPT and GChPT are presented in Fig.4.
5 Conclusion
1) On the basis of the consequent statistical analysis of the S-wave phase shifts
scattering behaviour the new correlation (5) has been obtained which relates
the S-wave phase shifts and from the threshold up
to . We believe that this correlation has value in itself for understanding
the mechanism of strong interactions.
2) The new constraint (6) on the S-wave scattering lengths
and has been computed by extrapolation of the relation (5) to the threshold.
3) The constraint (6) has been used as a supplementary condition when solving the Roy equations (1).
As the result the exact values of S-wave scattering lengths have been calculated:
.
4)Comparison with the results of the work [27]:
, where ChPT calculations were supplemented with the phenomenological
representations [25], shows that one more argument is found for the standard
ChPT [1,2] with small light quark masses and large quark condensate.
This work was supported in part by the Russian Foundation for Basic Research (project no. 00-02-17852).
References
- [1] J.Gasser and H.Leutwyler, Phys. Lett. B125 (1983)321; 325
- [2] J.Bijnens et al., Phys. Lett. B374 (1996) 210
- [3] M.Knecht et al., Nucl. Phys. B457 (1995) 513; B471 (1996) 445
- [4] L.Rosselet et al., Phys. Rev. D15 (1977) 574
- [5] S.Pislak et al., Phys. Rev. Lett. 87 (2001) 221801
- [6] V.N.Maĭorov, O.O.Patarakin and V.N.Tikhonov, Yad. Fiz. 63 (2000) 1699 [Phys.At.Nucl.63(2000)1612]
- [7] S.M.Roy, Phys. Lett. B36 (1971) 353
- [8] J.L.Basdevant, C.D.Frogatt and L.Petersen, Nucl. Phys. B72 (1974) 413
- [9] R.Kaminski et al., Z. Phys. C74 (1997) 79
- [10] S.D.Protopopescu et al., Phys. Rev. D7 (1973) 1279
- [11] E.A.Alekseeva et al., Zh.Eksp.Teor.Fiz. 82(1982)1007 [Sov. Phys. JETP 55(1982)591]
- [12] J.Carroll et al., Phys. Rev. D10 (1974) 1430
- [13] E.A.Estabrooks and A.D.Martin, Nucl. Phys. B79 (1974) 301
- [14] O.O.Patarakin and V.N.Tikhonov, IAE preprint IAE-5629/2 (Moscow,1993)
- [15] M.Kermani, O.Patarakin, G.R.Smith et al., Phys. Rev. C58 (1998) 3431
- [16] D.Cohen et al., Phys. Rev. D7 (1973) 661
- [17] A.Engler et al., Phys. Rev. D10 (1974) 2070
- [18] W.Hoogland et al., Nucl. Phys. B126 (1977) 109
- [19] J.Losty et al., Nucl. Phys. B69 (1974) 185
- [20] E.Colton et al., Phys. Rev. D3 (1971) 2028
- [21] G.V.Beketov et al., Yad. Fiz. 19(1974)1032 [Sov. J. Nucl. Phys. 19(1974)528]
- [22] N.B.Durusoy et al., Phys. Lett. B45 (1973) 517
- [23] M.R.Pennington, S.D.Protopopescu, Phys. Rev. D7 (1973)1429
- [24] G.Colangelo, J.Gasser and H.Leutwyler, Nucl. Phys. B603 (2001) 125
- [25] B.Ananthanarayan et al., Hep-ph/0005297
- [26] D.Morgan and G.Shaw, Phys. Rev. D2 (1970)520
- [27] G.Colangelo, J.Gasser and H.Leutwyler, Phys. Lett. B488 (2000) 261