Production in p+p Collisions
at = 200 GeV
Abstract
Total and differential cross sections for inclusive production have been measured in 200 GeV p+p collisions at Relativistic Heavy Ion Collider in Brookhaven National Laboratory. particles have been clearly identified via decays measured in the forward muon spectrometer covering and via decays measured in the mid-rapidity spectrometers of the PHENIX experiment. Details of the muon channel measurement are presented in this paper based upon an 81-nb-1 integrated luminosity obtained in the second run period at RHIC.
Corrected with the detection efficiency, the branching fraction times rapidity-differential cross section at forward rapidity = 37 7 (stat.) 11 (syst.) nb has been obtained. The average transverse momentum of the ’s, = 1.66 0.18 (stat.) 0.12 (syst.) GeV/, is slightly higher than lower-energy results and consistent with a model expectation based on perturbative QCD. The total production cross section = 3.8 0.6 (stat.) 1.3 (syst.) b has been extracted by fitting both the muon and electron channel measurements, which is related with lower-energy results by gluon distribution functions currently available. Its normalization is well reproduced by both the color-octet model and color-evaporation model.
The results have established the baseline necessary for the QGP search in Au+Au collisions as well as gluon polarization measurements in polarized p+p collisions at RHIC, where the unpolarized cross sections presented here will determine the absolute normalization.
1 Introduction
Since the sensational discovery of the particle [1, 2] as a triumph of the Quark Model, heavy-quarkonium production in hadron-hadron collisions and in photon-hadron collisions has drawn attentions because it involves both perturbative and non-perturbative aspects of Quantum Chromodynamics (QCD), which describes interactions between quarks and gluons. A sufficiently large scale (heavy quark mass) enables perturbative treatments of the production of a heavy-quark pair. On the other hand, its hadronization into a quarkonium state, with a scale of a typical hadron size (), is considered to be a non-perturbative phenomenon, where perturbative calculation is not applicable.
Thanks to narrow resonances found in the invariant mass of lepton pairs and relatively large cross-sections especially for the case of (1S), abundant experimental data have been accumulated on heavy quarkonia. Results of cross sections, polarization, relative yields such as the to ratio, have led to better understanding of quarkonium production. However the production mechanism involving non-perturbative QCD phenomena is still controversial. To understand it, more data on various observables in a wider energy range are needed.
We have added new measurements of in p+p collisions at unexploited energy ( = 200 GeV) with the PHENIX experiment at Relativistic Heavy Ion Collider (RHIC). The results are expected to provide better understanding of non-perturbative aspects of the hadro-production of , as well as further knowledge of perturbative QCD.
In addition, our measurements play crucial roles for both two innovative measurements realized for the first time at RHIC, heavy ion physics and spin physics, which will bring new insights into both perturbative and non-perturbative aspects of QCD.
1.1 Heavy ion physics
Provided nucleons are in high temperature and/or high density environment, hadronic matter is expected to turn into the Quark-Gluon Plasma (QGP), a new phase of matter whose degrees of freedom are quarks and gluons instead of hadrons. Understanding the behavior of bulk matter governed by QCD elementary degrees of freedom and interactions, and studying how it turns into hadronic matter, offers challenging perspectives and touches fundamental issues in the study of QCD in its non perturbative regime, such as the nature of confinement and chiral symmetry breaking.
RHIC is the first heavy-ion collider in the world to create the highest temperature environment experimentally. In the most central Au+Au collisions at the center-of-mass energy = 200 GeV per nucleon-nucleon collision, initial temperature, , is expected to reach as high as 0.5 GeV [3] at which the formation of QGP is expected.
A heavy quarkonium, a bound state of a heavy quark () and anti heavy quark (), is detected via a leptonic decay with the PHENIX detector at RHIC. It is considered to be one of the best probes for the earliest stages of collisions since pairs can be produced only in hard parton interactions (dominantly gluon fusion at RHIC energies) and final state leptons do not suffer from interactions with hadronic matter in the later stages of the collisions. In deconfined (QGP) matter, and tend not to form a quarkonium and diffuse away from each other instead, because attractive color forces between them are reduced by a Debye-type screening. Therefore, suppression of quarkonium yield is expected in QGP [4]. Another theoretical model predicts enhancement of quarkonium production due to recombination of and produced in different nucleon-nucleon collisions because of their higher mobility inside the QGP [5]. If we observed an anomalous suppression or enhancement of quarkonium production in Au+Au collisions, it could be interpreted as evidence of QGP. This study definitely requires the reference of unsuppressed cross section, which can be best served by p+p collisions at the same energy. There has been, however, no data of production in p+p collisions at = 200 GeV, and such measurements play a crucial role to establish the basis of the QGP search in heavy ion collisions.
The has the largest production cross-section among all the heavy quarkonia and possible to be measured even with such a small integrated luminosity as obtained in the RHIC Run-2 period (2001-2002) where accelerator performance was in the stage of progress. With an increased luminosity, measurements and comparison with other charmonium and bottomonium states are important, since different binding radii for each quarkonium will result in different degrees of suppressions.
1.2 Spin physics
Spin is one of the fundamental properties indigenous to nuclei and elementary particles. Studies of spin have been providing deep understandings of properties of particles and their interactions.
An example is the studies of nucleon spin structure using deep inelastic scattering (DIS) of polarized leptons from polarized nucleons. Since the 1970s, the polarized structure functions of nucleons, have been measured using polarized electrons or muons and polarized nuclear targets [6]. As a result, the net quark polarization inside a proton has turned out to be as small as 0.1 to 0.3 which is much smaller than the naive expectation ( 1). This discrepancy is called the “proton spin puzzle”. A significant fraction of the proton spin is allegedly carried by gluons in analogy to the case of momentum. However, polarized gluon distribution where is distribution of gluons polarized in the same (opposite) direction as the proton helicity, suffers from large theoretical uncertainties in extraction from the DIS results since gluons do not couple to photons at the leading order.
RHIC has been added a new feature of accelerating polarized protons up to 250 GeV/ momentum keeping 70% polarization with the advent of innovative technologies such as Siberian Snakes [7] to keep proton polarization through acceleration. Studying polarized phenomena at the perturbative QCD regime is now accessible using polarized p+p collisions at the highest energies up to = 500 GeV [8], which is much higher than the previous polarized p+p experiment ( = 19 GeV) [9]. For example, we plan the first direct measurement of , through double-spin asymmetries () for cross sections of gluon-initiated subprocesses such as the direct-photon production [10]. It is important to measure for various subprocesses to elude theoretical uncertainties to extract . Quarkonium production is one of them. An asymmetry for quarkonium production can be written as
where denotes a momentum fraction of each parton and is a partonic asymmetry for the subprocess 111 represents inclusive production. An advantage of this channel is an experimental feasibility due to a relatively large cross-section and small background especially for the case of as already stated. Also the subprocess (gluon fusion) can be identified with a small (%) contamination from others. Therefore we will be able to measure for with a small uncertainty.
However, the extraction of from suffers from large theoretical ambiguities due to the lack of knowledge of , which is sensitive to the production mechanism. Therefore the elucidation of the production mechanism is a crucial key to extract from .
In summary, measurements of in p+p collisions at RHIC are vital to: (1) discuss the formation of QGP in Au+Au collisions and (2) clarify the mechanism of quarkonium production to obtain in polarized p+p collisions.
1.3 production in hadron-hadron collisions
Current theoretical and experimental knowledge of hadro-production of charmonia is described in the following.
Production of and other charmonia in hadron-hadron collisions is understood in the following framework based upon the QCD factorization theorem [11]. Figure 1 shows an example of Feynman diagram for hadro-production of . According to the factorization theorem, the cross section to produce a charmonium in a collision of hadron and , can be factorized into:
-
•
: Probability for a parton to be found in a hadron , called a P̱arton Ḏistribution F̱unction (PDF), where is a momentum fraction of to and is a scale for the parton interaction,
-
•
: Probability for a parton to be found in a hadron and
-
•
: Cross section for the partonic subprocess , where is produced in the hard scattering of the parton and ,
and written as
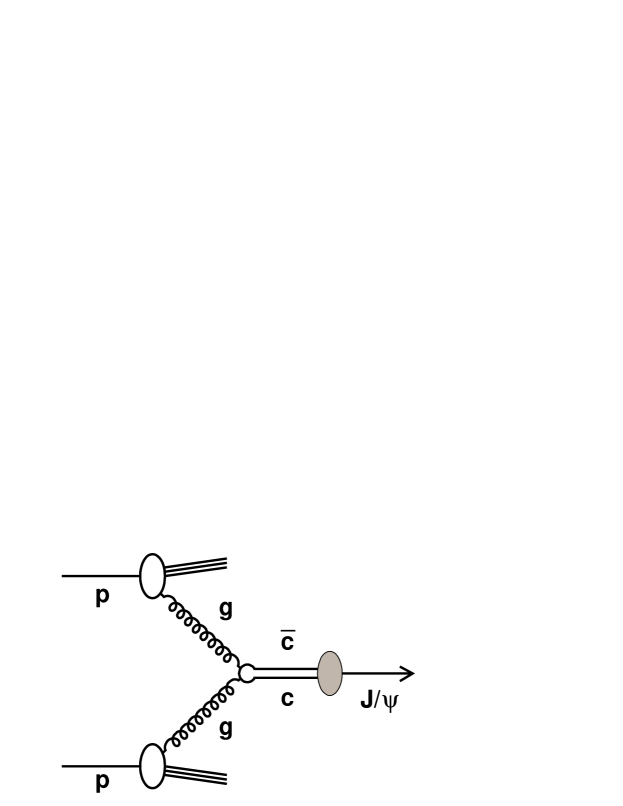
Following 21 subprocesses contribute to low- (transverse momentum) production of ( 1 GeV/):
-
•
and
-
•
,
where and denote a quark and a gluon respectively. Figure 1 is an example of the subprocess. Medium and high ’s are produced in the following 22 subprocesses:
-
•
,
-
•
and
-
•
.
At RHIC energies ( = 200 to 500 GeV) and subprocesses contribute to cross sections significantly.
Production of from initial partons is further separated into two steps: production of a pair in the hard scattering of the initial partons (step 1) and hadronization of a charmonium from the pair (step 2). This is possible since energy scales for each step are well separated, that is, 2 3 GeV ( is the charm quark mass) for step 1 and 0.2 GeV for step 2 which is the inverse of a typical hadron size. The cross section for step 1 can be calculated using perturbative QCD. On the other hand, the probability for step 2 is not calculable with it, because it is a non-perturbative phenomenon. There are some theoretical models for charmonium production each of which assumes a different assumption and treatment on step 2.
The color-evaporation model (CEM) or the semi-local duality approach [12, 13], born in the 1970s, simply ignores the color and other quantum numbers of pairs and assumes a certain fraction of them, which is needed to be determined from experimental data, forms each charmonium state through multiple soft-gluon emissions as illustrated in Fig. 2. The CEM describes experimental data on low- or -integrated results well, where the soft gluon picture is expected to be valid. For example, the CEM describes ’s total cross sections in both hadro-production and photo-production at lower energies [14]. Also the CEM prediction of zero polarization (spin-alignment) of ’s is consistent with the lower-energy experiments where low- contribution is dominant [43], but contradicts to the CDF data at medium and high [47].

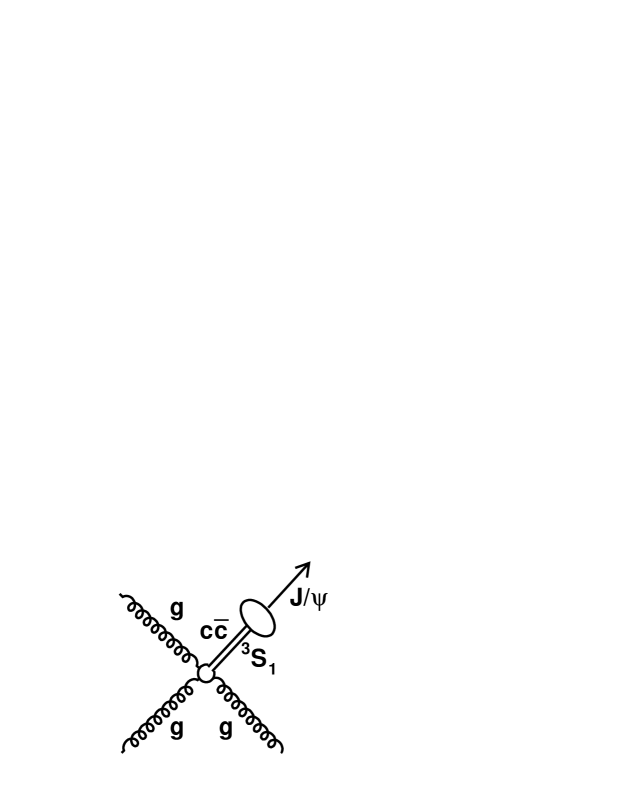
A more sophisticated model born in the 1980s, the color-singlet model (CSM) [15, 16], requires a pair to be the color-singlet state and have the same quantum numbers as the charmonium to be formed. Figure 3 shows an example of the lowest order production of a with the CSM where the pair should be in = and the color-singlet state as the . It should be noted that an additional hard-gluon emission is necessary to conserve the -parity. The CSM can unambiguously predict production cross sections for each charmonium without any free parameters and has explained distributions of production at ISR energies ( = 30 to 63 GeV) reasonably well [15]. However the CSM failed to explain differential cross sections of the Tevatron data in p+ collisions at = 1.8 TeV by large factors (30 50) [45]. CSM predictions do not agree either with the total cross sections at lower energies by a factor of about 20 [22].
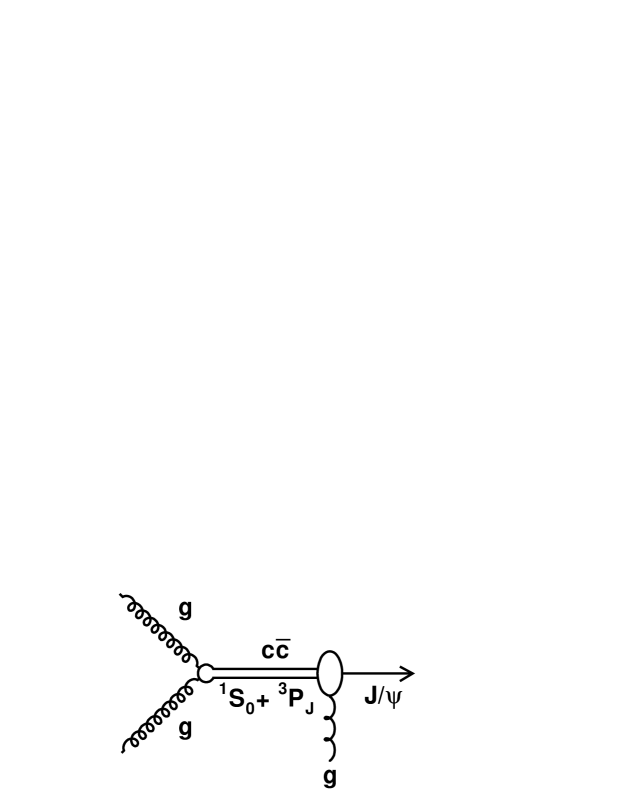
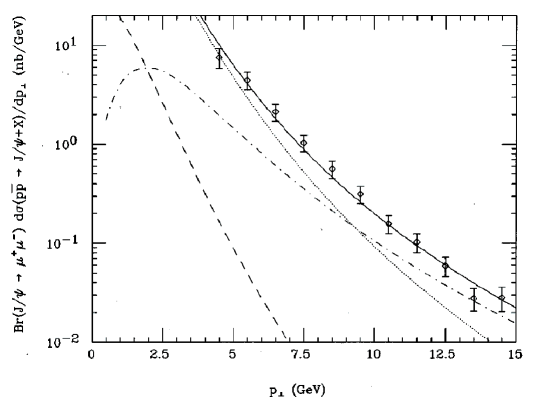
To explain these discrepancies, the color-octet model (COM) [17] has been developed in the 1990s based upon the non-relativistic QCD framework [18]. The COM allows the formation of a charmonium from a color-octet pair with one or some soft gluon emissions. Figure 4 shows an example of the lowest order production of a with the COM from the gluon fusion subprocess. The pair, which is in (or ) and the color-octet state, forms a with a soft gluon emission. Using appropriate color-octet matrix elements, which are additional free parameters needed to be extracted from experimental data, the COM has successfully reproduced distributions at CDF [19, 20, 21] as shown in Fig. 5 and total cross sections at lower-energy experiments [22, 23, 24]. COM predictions for the relative yields for each charmonium state (for example, to direct ratio) are also consistent with the experimental data [23], which will be discussed in Appendix A. However extraction of these matrix elements is still controversial and therefore large ambiguities are left for the prediction with the COM.
Hadro-production data on and other charmonia are available in both fixed-target experiments and collider experiments in a wide energy range (6.1 GeV 1.8 TeV) [25, 26, 27, 28, 29, 30, 31, 32, 33, 34, 35, 36, 37, 38, 39, 40, 41, 42, 43, 44, 45, 46, 47, 48]. Measurements of such as total and -differential cross-sections, polarization, and relative yields of each charmonium have promoted better understanding of production mechanism. However more data on different observables at different energies are required since currently none of the theoretical models can successfully explain all the experimental data at all energies.
Our measurements of in p+p collisions using the PHENIX detector at RHIC will result in another critical input for understanding of hadro-production of . The energy region of RHIC ( = 200 to 500 GeV) has never been exploited yet by previous experiments. Thanks to excellent lepton-identification capabilities of two independent spectrometers of PHENIX which cover both the central rapidity region (0.35) and the forward region (1.2 1.2), we are able to extract total cross-section for production with less ambiguity in the extrapolation to unmeasured kinematical region, unlike higher-energy ( 630 GeV) collider experiments with a cut ( 4 or 5 GeV/) and limited kinematical coverage in the forward region. Therefore, we can obtain total cross-section results at the highest energies, which are sensitive to the production models.
In addition, our measurements of differential cross sections will provide further information to understand perturbative QCD. Our wider kinematical coverage enables us to measure rapidity-differential cross section which is reflected by gluon distribution function in the proton. Transverse momentum () distribution at lower , which dominates our inclusive yield, and the average value of are sensitive to intrinsic transverse-momentum of partons ().
RHIC has started a physics run from year 2000. In the 2001-2002 run period (Run-2), both Au+Au collision and p+p collision data have been accumulated, where particles have been successfully detected via both the and decay channels. In this paper, measurements of total and differential cross sections for inclusive production in p+p collisions at = 200 GeV are presented. In section 2 and 3, details of the experimental setup and analysis procedure are described respectively, focusing on the channel measurement. In section 4, results are discussed together with theoretical predictions as well as results of other experiments, followed by the conclusion.
2 Experimental setup and data acquisition
2.1 The RHIC accelerator complex
The Ṟelativistic H̱eavy-I̱on C̱ollider (RHIC), located in Brookhaven National Laboratory, Upton, New York, is capable of accelerating a wide variety of nuclei and ions from protons to Au (gold) nuclei up to 250-GeV energy for protons (or 100-GeV per nucleon for Au) using two independent rings and colliding them at six interaction points. The design luminosities are 2 cm-2 sec-1 for Au beams and 2 1031 cm-2 sec-1 for proton beams (2 1031 cm-2 sec-1 in an enhanced mode) at the top energy.
RHIC also has a capability of accelerating polarized protons. In the Run-2 period (year 2001-2002), RHIC has successfully achieved transversely-polarized proton-proton collisions at 200 GeV and delivered an integrated luminosity of roughly 1 pb-1 to each experiment. In this paper we will present unpolarized cross sections for the production, that is, spin-averaged results. Therefore, descriptions of the polarized proton acceleration are not described here.

Attached figure 1 shows an aerial view of the RHIC accelerator complex. The route for the proton acceleration to RHIC is shown in Fig. 6. Starting from the polarized ion source, (polarized) protons are accelerated through Linac, Booster and AGS then injected into both rings of RHIC, whose circumference is 3.834 km. The Blue ring runs clockwise and the Yellow ring runs counter-clockwise. There are currently 120 bunch buckets in each ring whose interval is 106 nsec (or 9.4 MHz frequency). In Run-2, only about a half of them (54 bunch buckets) have been filled. Typical bunch length was 2 nsec (60 cm) in rms during the p+p run.
Experiments are located at the interaction points in RHIC where two bunches in each ring collide at an angle of 0∘. There are six interaction points called 12, 2, 4, 6, 8, and 10 o’clock respectively starting from the north and going clockwise. Table 1 shows the experiments at each interaction point. Each experiment demonstrates its unique feature. STAR and PHENIX are the largest experiments at RHIC each with more than 400 collaborators. STAR (S̱olenoid Ṯracker A̱t ṞHIC) tracks and identifies charged particles with a time projection chamber covering a large solid angle. PHENIX (P̱ioneering H̱igh E̱nergy Ṉuclear and I̱on eX̱periment) was designed to measure hadrons, leptons and photons in both high multiplicity and high rate environments. BRAHMS measures hadrons over wide ranges of rapidity and momentum using two magnetic spectrometers. PHOBOS consists of a large number of silicon detectors surrounding the interaction region to measure charged particle multiplicities even in the most central Au+Au collisions. The pp2pp experiment is aiming at measuring p+p total and elastic cross sections.
| Interaction Point | Experiment |
|---|---|
| (o’clock) | |
| 12 | - |
| 2 | pp2pp, BRAHMS |
| 4 | - |
| 6 | STAR |
| 8 | PHENIX |
| 10 | PHOBOS |
2.2 Coordinates and formulae
In this subsection, coordinate system and formulae used to describe the experimental setup and results are introduced.
Coordinate system at PHENIX
The axis stands for the beam line which runs straight in the experimental area, where positive points to the north. The polar angle and azimuthal angle are defined with respect to the axis. The north (south) direction is usually defined as = 0 (180) degrees and the west (east) direction is defined as = 0 (180) degrees.
Rapidity
Rapidity of a particle is defined as
where is the energy and is the -component of momentum of the particle.
Pseudo rapidity
Pseudo rapidity of a particle is defined as
where is the scalar value of momentum and is the polar angle of the particle direction. In the massless limit, reaches .
In the definition above, ) of a particle going to the south is negative. However, absolute (positive) values of ) will be often used for those particles in this paper, since results with the spectrometer on the south side of PHENIX will be mainly described and physics should be symmetric with respect to = 0.
2.3 The PHENIX experiment overview
PHENIX is one of the largest experiments at RHIC, located at the 8-o’clock interaction region. Attached figure 2 shows a schematic view of the PHENIX experiment. PHENIX was designed to measure leptons, photons and hadrons in both high-multiplicity heavy-ion collisions and high event-rate p+p collisions.
There are two independent spectrometers in PHENIX which cover different pseudo-rapidity regions. Two Central Arms, East and West Arms, cover the pseudo-rapidity range of with a quarter azimuth for each Arm and measure electrons, photons and hadrons. Two Muon Arms, North and South Arms, cover and respectively with a full azimuth and measures muons.
There are three magnets in PHENIX. The Central Magnet provides an axial magnetic field for the Central Arms while two Muon Magnets produce a radial field for each Muon Arm. Attached figure 3 shows magnetic field lines inside the magnets. A part of the Central Magnet steel and a copper spacer mounted on each side of it (called a copper nosecone) work as a hadron absorber of about five interaction-length for the Muon Arms. The positions of the nosecones, = 40 cm, determine a useful vertex region for physics events ( 30 to 40 cm depending on analysis).
The Central Arms consist of three kinds of tracking chambers (Drift Chambers, Pad Chambers and Time-Expansion Chambers), Ring-Imaging erenkov Counters for the electron identification, Time-Of-Flight detectors for the particle-identification for hadrons, and Electro-Magnetic Calorimeters for measuring energies of electrons and photons. These detectors are positioned radially with respect to the -axis extending from 2 m to 5 m. Details of operation and performance of the Central Arm detectors can be found in [49, 50, 51]. Descriptions of the analysis of the channel using the Central Arms are found in [52].
In addition to these four Arms, there are three kinds of counters to trigger p+p interactions which will be described in the next subsection followed by the subsection dedicated to description of the Muon Arms.
2.4 Interaction trigger counters
Three kinds of interaction-trigger counters (ITC) have been used to trigger p+p inelastic events and find vertices during the Run-2 p+p period. They are Beam-Beam Counters (BBC), Normalization Trigger Counters (NTC) and Zero-Degree Calorimeters (ZDC). Table 2 summarizes acceptance and performance of each ITC. Since trigger efficiency of the ZDC for p+p inelastic events is small (0.01), it was not used for the analysis, hence will not be described here. Detailed information on the ZDC is found in [53]
| Counters | Acceptance | Sensitive particle | Typical | Typical vertex |
|---|---|---|---|---|
| type | efficiency | resolution (cm) | ||
| BBC | 3.03.9 | charged particles | 0.5 | 2 |
| NTC | 1.12.8 | charged particles | 0.6 | 10 |
| ZDC | 6.2 | neutral particles | 0.01 | 10 |
2.4.1 The Beam-Beam Counters
Two Ḇeam-Ḇeam C̱ounters (BBC) have been used for the primary trigger and vertex counter for the p+p interactions. They are positioned 1.4 meters away from the interaction point along the beam axis on each side and cover from 2.4 to 5.7 degrees (3.0 3.9) with a full azimuth. They determine the vertex position of an event from the time difference between two counters. Attached figure 4 shows a photograph of a BBC. Each BBC consists of 64 hexagonal erenkov radiators each of which is mounted on a 1” photomultiplier tube (PMT). They are sensitive to charged particles whose is greater than 0.7.
With a beam test, intrinsic timing resolution of 50 psec was obtained for one module [54]. In Au+Au collisions, better vertex resolution is expected because hit multiplicity is higher. Actually 0.5-cm vertex resolution has been obtained in Run-2 Au+Au collisions. In p+p collisions, about 2-cm vertex resolution is expected which is still good enough not to worsen invariant mass resolution for particles measured in the Muon Arm. Trigger efficiency for p+p inelastic events is expected to be about 0.5, which will be discussed in section 3.
Beam-Beam Local-Level-1
Hit time information of all PMTs is sent to the Beam-Beam Local-Level-1 (BBLL1) board where a trigger decision is made. Online vertex position is obtained from hit time information without pulse-height corrections (threwing corrections). During the p+p run, a trigger is fired when there is at least one hit on both sides of the BBC counters and online -vertex position 75 cm which is sufficiently large compared to offline vertex cuts (30 to 40 cm). Online vertices (without slewing corrections) and offline vertices (with slewing corrections) agree within the accuracy of the vertex determination (2 cm).
2.4.2 The Normalization Trigger Counters
Ṉormalization Ṯrigger C̱ounters (NTC) have been introduced to increase trigger efficiency for p+p inelastic (including diffractive) events which is about 0.5 with the BBC only.
Each NTC is located on top of each side of the nosecone which is 40-cm away from the interaction point. Pseudo-rapidity coverage is 1.1 2.8. It consists of four fan-shaped scintillators (called quadrants) each of which is mounted on a PMT to collect scintillation light emitted when a charged particle traverses. Single-particle detection efficiency obtained with a beam test is about 90% [55].
A simple NIM-logic makes NTC triggers using hit time information of all quadrants, which are sent to the Global-Level-1 board (see section 2.7). A trigger is fired when at least one quadrant on both sides has a hit. Trigger efficiency for p+p inelastic events is estimated with a simulation to be 60% by the NTC itself and go up to 74% when combined with the BBC where statistical errors of the simulation is 1%. Although NTC-triggered events without a BBC-trigger have not been used to increase the number of ’s because of its poor vertex-resolution (10 cm), they are used to confirm trigger efficiency of the BBC which will be discussed in section 3.
2.5 The Muon Arms
The PHENIX Muon Arms were designed to detect muon pairs from decays of vector mesons and bosons produced in the forward rapidity region ( for the South Muon Arm and for the North Muon Arm) as well as single muons from (semi-)leptonic decays of open heavy flavors and bosons. Attached figure 5 shows a schematic view of a Muon Arm. Since only the South Arm was operational in Run-2, following descriptions specifically focus on it.
In this forward region, hadron background is relatively larger than that in the central region, since hadrons can be produced in soft processes with wider rapidity distribution than hard processes, while signal muons such as from heavy flavors are produced in hard processes. Good hadron rejection while keeping good momentum resolution is achieved with the following components of the Muon Arms and PHENIX.
-
1.
Pre-rejection of hadrons with a five-interaction-length absorber of the nosecone and Central Magnet. Interaction length was determined not to degrade momentum resolution for low momentum (2 to 5 GeV/) muons and to keep good mass resolution for ’s. Hadron rejection factor of about 100 is achieved here.
-
2.
Measurement of particle momentum with a magnetic spectrometer (Muon Tracking Chamber inside the Muon Magnet)
-
3.
Further rejection of hadrons with an array of coarse-segmented tracking chambers and absorbers (Muon Identifier). Another factor of about 30 is achieved for the hadron rejection.
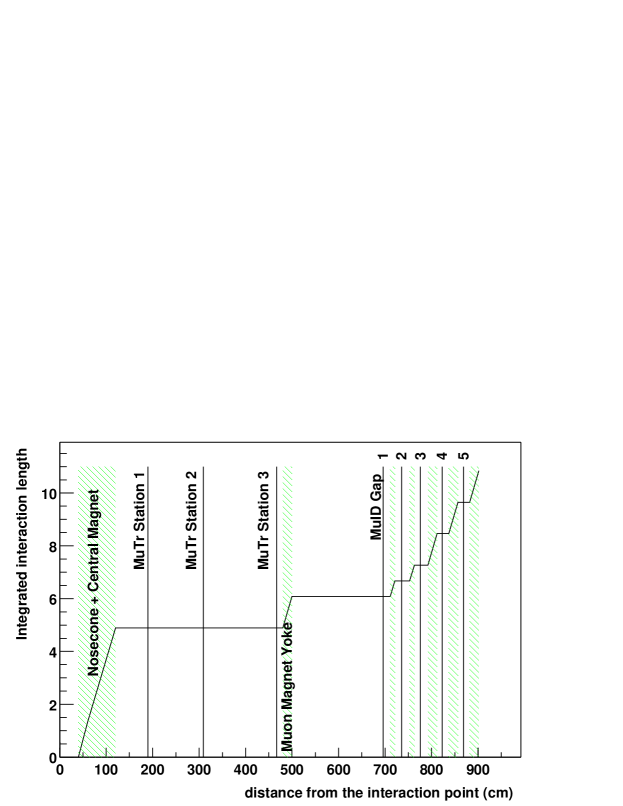
Figure 7 shows integrated nuclear interaction-length () in the South Muon Arm as a function of the distance from the interaction point in the direction. At the last MuID gap (gap 5), becomes 9.65. The minimum (-component of momentum) for a muon to reach gap 5 is 2.5 GeV/.
2.5.1 The Muon Tracker
The PHENIX M̱uon Ṯracker (MuTr) comprises three stations of tracking chambers inside the Muon Magnet as shown in Fig. LABEL:fig:muon_north. Its design was driven by requirements from both heavy-ion physics and spin physics. The separation of each charmonium or bottomonium state from the others, from ’ for example, is essential to find a QGP signal, since the degrees of suppression for each state are expected to vary because of different binding radii. For spin physics, charges of high- ( 20 GeV/) muons from and boson decays are needed to be identified [8]. To satisfy the requirements above, 100-m resolution is needed for chamber resolution. In addition, multiple cathode-strip orientations and read-out planes are required for each station to reconstruct tracks efficiently even in the most central Au+Au events. A MuTr electronics design was also driven by the requirement of 100-m resolution measurements.
With 100-m position resolution, momentum resolution = 3 to 5% is achieved for 2 to 10 GeV/ muons as shown in Fig. 8. For low momentum (2 to 5 GeV/) muons, multiple scattering is the dominant factor to smear muon momenta, whereas position resolution of chambers becomes dominant for high momentum (above 10 GeV/) muons. Polar angle dependence of momentum resolution for high momentum muons is due to the difference in magnitudes of the magnetic field inside the South Muon Magnet as shown in Table 3.
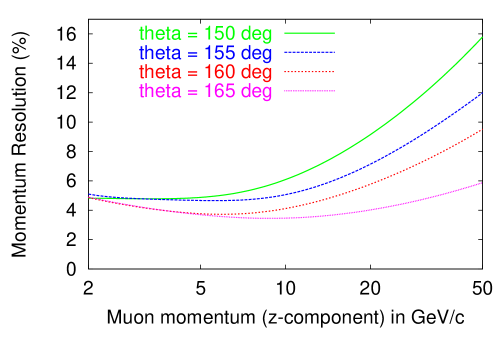
| Polar angle in degrees | 165 | 160 | 155 | 150 |
|---|---|---|---|---|
| Integrated magnetic field in Tm | 0.774 | 0.494 | 0.344 | 0.255 |
Mechanical design
All chamber planes inside the Muon Magnet are perpendicular to the -axis. Their -positions for each station are shown in Fig. 7. The magnetic field is in the radial direction so that charged particles from the interaction vertex bend primarily in the azimuthal direction, which is perpendicular to the direction of cathode strips to determine the track positions. Typical bend from the straight line at station 2 is 1 cm for medium-momentum (5 to 10 GeV/) muons.
In one MuTr station there are three (or two) gaps each of which consists of two cathode-strip planes and one anode-wire plane in between with a 3.2-mm anode-cathode spacing. Attached figure 6 shows a cross section of a MuTr station. Station 3 has only two gaps because it can exploit additional two-dimensional position information of MuID roads. All gaps are divided into octants electrically as shown in attached figure 7, together with octant numbers. For station 2 and 3, octants are also the unit of mechanical assemblies while quadrants are for station 1. Attached figure 8 shows a photograph of a station-2 octant. An octant is further divided into two half-octants in the middle, in each of which directions of anode wires and cathode strips are fixed.
A cathode plane consists of 5-mm width strips with alternate readout to avoid cross-talks between them. An anode plane is an alternating structure of 20-m gold-plated tungsten sense wires and 75-m gold-plated Cu-Be field wires with a sense wire spacing of 10 mm. Anode wires run in the azimuthal directions while cathode strips run in the radial directions. The direction of cathode strips in one plane of each gap is perpendicular to that of the anode-wires (called a non-stereo angle plane), with a goal of 100 m position resolution. The direction of cathode strips in the other plane of the gap (a stereo angle plane) is tilted by 3.25 to 11.25 degrees depending on gap and station, which are summarized in Table 4 and illustrated in attached figure 9 for station-1 planes. Resolutions of stereo-angle planes are worse (300 m) but they are needed to determine 3-D positions of hits and reject ghost tracks.
| Station | Gap | angle (degree) |
|---|---|---|
| 1 | ||
| 1 | 2 | |
| 3 | ||
| 1 | ||
| 2 | 2 | |
| 3 | ||
| 3 | 1 | |
| 2 |
Specific technologies were used for each station to produce a cathode pattern to an accuracy of better than 25 m; photolithography for station 1, electro-mechanical etching for station 2 and mechanical routing for station 3 [56]. A unique wire laying apparatus was designed and implemented for each station.
In order to reduce the multiple scattering in the spectrometer which degrades momentum resolution, thickness at the station 2 detector was required to be less than 10-3 of a radiation length. To meet this requirement, the station-2 octant cathodes were made of etched 25-m copper coated mylar foils. The thickness of the copper coat is 600 Å. As a result, the total thickness of radiation lengths is achieved which satisfies the requirement.
The chamber gas mixture was 50% Ar + 30% CO2 + 20% CF4 with a gas recirculation system included in normal operation. The nominal high-voltage potential applied to anode wires was 1850 V with a gain of approximately .
To maintain good momentum resolution, an optical alignment system has been installed to calibrate initial placement of the chambers, and to monitor displacement of the chambers during their operation to m. There are seven optical beams surrounding each octant chamber, consisting of an optical-fiber light source at station 1, a convex lens at station 2 and a CCD camera at station 3 which are shown in attached figure 10.
Electronics design
Attached figure 11 shows a schematic diagram for the MuTr F̱ront E̱nd E̱lectronics (FEE). Raw chamber signals are continuously amplified by CPAs (C̱harge P̱re-A̱mps) and stored in AMUs (A̱nalog M̱emory U̱nits) with 64-event buffers with the 10-MHz beam clock. Upon receipt of a level-1 trigger bit from a G̱ranule Ṯiming M̱odule (GTM), stored samples of all channels are digitized by 11-bit ADCs (A̱nalog to Ḏigital C̱onverters) and the results are sent to a Ḏata C̱ollection M̱odule (DCM) through a F̱ront E̱nd M̱odule (FEM). GTMs and DCMs are described in section 2.6.
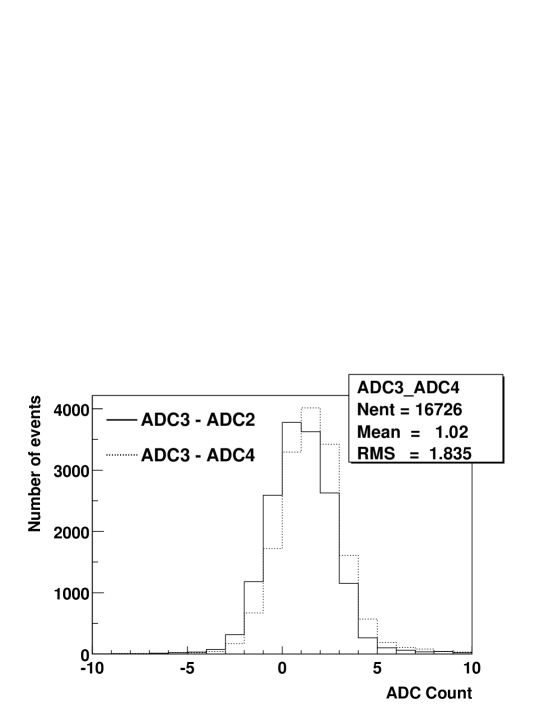
Four ADC samples are used to determine the amount of the charge deposited on a strip to reject noise hits as much as possible. Each sample is measured for the duration of 100 nsec. The second sampling starts 400 nsec after the first sampling ends. Second to fourth samplings are consecutive. Timing has been set so that the third sample comes to the peak of the pulse as shown in Fig. 9. Relative charges (or ADC counts) of these samples have been monitored online to guarantee peak positions not to move around from the third sampling. The amount of the peak charge of a strip is obtained offline as the average of the second to fourth samples with a pedestal subtracted. These four samples are converted within 40 sec per event.

Strip by strip calibration is crucial for good position resolution, since a position of a muon track is determined by fitting charges on typically 2 or 3 consecutive strips induced by the track, which will be described in section 3.2.2. A calibration system has been implemented to inject pulses into all of the chambers. Four wires in each chamber gap, which span the entire width of the cathode planes, are sent a square pulse from a digital to analog converter (DAC), thus inducing a charge on all cathode strips in a given gap simultaneously. Several different pulse amplitudes are sent to the chambers and many events are collected at each amplitude so that relative gains of the cathode strips can be determined over the entire range of the electronics. Pedestals are monitored by collecting calibration data with the DAC amplitude set to zero.
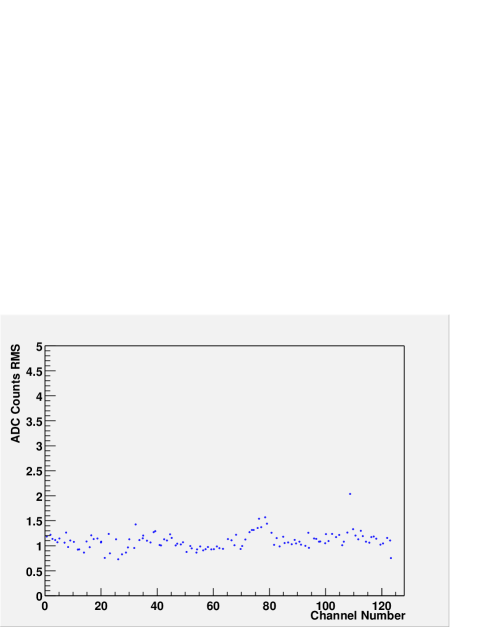
To meet the design requirement of 100-m resolution, rms noise at the input to the preamps is required to be 0.5 fC for a typical pulse of 80 fC, which is achieved in a test bench measurement described next.
Integrated performance
Integrated performance of chambers and electronics has been studied in a cosmic-ray test in a test stand with one station-2 chamber and its full complement of electronics, and in readout of the entire South MuTr system prior to Run-2. The cosmic-ray test data showed that the system was capable of meeting the noise specifications and that 100-m resolution could be achieved. The noise specifications have been met on the full South MuTr system and the system has been shown to be robust over several months of data taking.
The cosmic-ray test was performed with one station-2 chamber, 960 channels of production front-end electronics, the same high-voltage and low-voltage distribution system that is used in the final system, and with a copy of the PHENIX data acquisition system. The noise specifications of 0.5 fC (1 ADC count) were met, as can be seen in Fig. 10, where the rms values of the pedestals on all readout channels are shown. Noise environment in situ has turned out to be similar to this test except for chambers in station 2, which has caused degradation of the mass resolution for in Run-2.
Two scintillators, one on either side of the station-2 chamber, were used to provide a trigger for cosmic rays going through the chamber. The data collected from this trigger were searched for clusters in each cathode readout plane, the clusters were fit to extract the centroid strip positions, and 5 out of 6 readout planes were fit to a straight line and projected to the sixth, central non-stereo readout plane. A cut was placed on the straight line fit to only the select tracks which were approximately perpendicular to the face of the chamber and the difference between the projected straight-line fit and the measured position on the sixth plane was plotted. The result is shown in Attached figure 12, where a resolution of approximately 100 m was achieved when the projection error, position resolution for a track obtained with the other five planes, is removed from the residual.
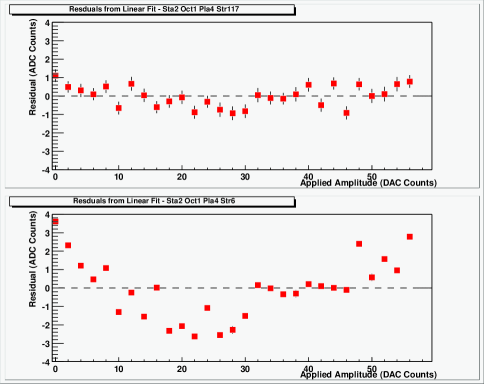
Each individual channel’s gain, pedestal and variation (or noise) in the pedestal were measured. The dynamic range in the charge measurement of the system was verified and long runs demonstrated the stability of the optical links from FEMs to a DCM. Figure 11 shows the residuals from a gain measurement during the commissioning period. The residuals are shown to be consistent with a linear gain to a few ADC counts over the operable ADC range.
2.5.2 The Muon Identifier
The M̱uon I̱Dentifier (MuID) consists of five layers of chambers interleaved with steel absorbers. Each chamber plane is called gap 1 through gap 5 starting from the nearest gap to the interaction point. The MuID is used for separating muons from charged hadrons and other background as well as providing triggers for single muons and dimuons (muon pairs). It gives another hadron rejection factor of about 30 in addition to the Central Magnet and nosecone (about 100), thus reducing the mis-identification rate for the punch-through hadrons to . This is much smaller compared to the irreducible hadron weak-decay background ( and ) in flight before the nosecone for near-threshold momentum (3 GeV/) muons (). Minimum for a muon produced at the interaction vertex to reach the MuID is 1.8 GeV/ and 2.5 GeV/ to penetrate through it.
Segmentation of the absorber into multiple layers improves the measurement of the trajectory in the MuID gaps (chamber layers) for low momentum muons, which is desirable to increase the acceptance for the meson detection. The segmentation chosen is 20 cm, 10 cm, 10 cm, 20 cm and 20 cm starting from the South Magnet backplate as shown in Fig. 7. In each gap between these absorbers, chamber panels are installed.
Mechanical Design
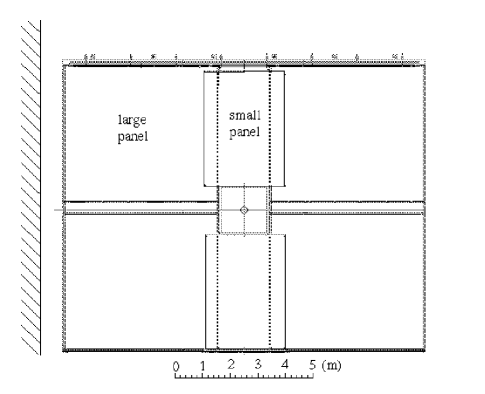
One MuID plane, or a gap, consists of six panel structures (called MuID panels) as shown in Fig. 12, into which chambers are assembled in both horizontal and vertical orientations. The upper figure of Fig. 13 shows the cross section of a MuID panel.
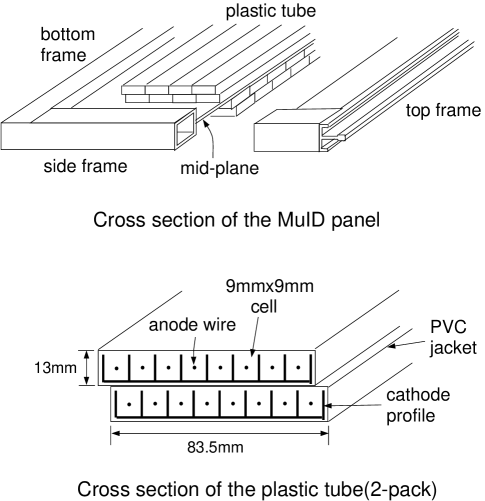
Iarocci-type plastic tubes have been chosen as MuID chambers for longevity, robustness and low cost to cover a large area (13 10 m2 for each Arm). One tube has eight cells with a 9 9-mm2 cross section each of which has a gold-coated CuBe anode-wire with a 100-m diameter at its center. The lower figure of Fig. 13 shows the cross section of an Iarocci tube (in this figure, two tubes, or a two-pack is shown which will be explained later). The cathode wall is made of polyvinyl chloride (PVC) coated with carbon. Length of a tube varies from 2.5 m to 5.6 m depending on its position to be installed.
Tubes are operated in the proportional mode with 4300 to 4500 V potentials and isobutane-CO2 mixed gas, where a gain of approximately is achieved. As test-bench results, 92 1 % efficiency, which was also measured in the beam test to be described later, and 80 nsec (nano-seconds) drift time width were obtained. To achieve a better efficiency and faster drift time, two tubes with a half cell (5-mm) shift consist one channel (called a 2-pack) as shown in Fig. 13. For a 2-pack, 97 1 % efficiency and 60 nsec (nano-seconds) drift time have been obtained [57]. Drift time is faster enough than the bunch-crossing interval (106 nsec), so that a level-1 trigger can uniquely determine the bunch crossing in which an event has occurred. Gas mixture ratio is adjustable between 0 to 25% for isobutane. In Run-2 it has been set to 7% to meet the non-flammable requirement of PHENIX.
Iarocci tubes are assembled in a panel structure called a MuID panel which consists of Al frames, cover plates and a mid-plate (shown in the upper figure of Fig. 13). Iarocci tubes are glued to both sides of a 3-mm width Al mid-plate with double-sided tapes at 8.4-cm intervals for both horizontal and vertical orientations. Each orientation has two chamber layers shifted by a half cell (5 mm) to make 2-packs. Those layers have independent chains for gas and high-voltage supplies to minimize the number of dead channels.
There are two kinds of the panel size which are 5.6 5.2 m2 (large panel) and 4.4 (or 4.2) 2.9 m2 (small panel). In one gap, four large panels and two small panels are installed as shown in Fig. 12. Adjacent panels overlap with each other so that there is no inactive area between them.
Electronics Design
A passive OR of signals of 16 wires in a 2-pack is read out and amplified by a factor of 150 with an in-panel amplifier on a high-voltage distribution board which also provides high voltage to each tube. Signals are then sent to the MuID Front-End Electronics (FEE) where they are again amplified by a factor of 3, discriminated and stored in the data buffer. Discriminator threshold values have been set to 90 mV to minimize the number of noise hits while keeping good efficiency (typical pulse height of signals is 500 mV to 1 V). Upon receipt of a level-1 trigger, all digitized bits are sent to a DCM. There is additional output of the MuID FEE called “pseudo-trigger output” which is grand logical OR of a certain fraction of channels. They are used for the NIM-logic level-1 trigger which is described in section 2.5.3.
Integrated performance
To confirm hadron-rejection performance and muon detection efficiency of the entire MuID system experimentally, a beam test was performed at KEK-PS 222 Proton Synchrotron at High Energy Accelerator Research Organization, Japan using the same type of Iarocci tubes and steel absorbers in the same configuration as in PHENIX.
Attached figure 13 shows the experimental setup for the beam test. Pion and muon beams were produced by bombering an inner target with 12-GeV proton beams, then 1-4 GeV/ momentum was selected with the magnet system and delivered to the experimental area. Four scintillation counters (ST1 to ST4) defined the beam. Three gaseous erenkov counters (GC1 to GC3) identified pions and muons. GC1 and GC2 were pressured to distinguish between pions and muons and GC3 to distinguish between muons and electrons. Beam qualities obtained were better than 99% for muons and better than 99.9 % for pions excluding their weak decays () after GC2. Five iron slabs were used with a width of 10 cm, 10 cm, 10 cm, 20 cm and 20-cm respectively staring from the upper stream. An additional 10-cm (20-cm) plate was added in front of the first layer to simulate the backplate of the South (North) Muon Magnet. The numbers of Iarocci tubes used were 3, 3, 5, 7 and 9 starting from the first gap for each orientation. They were optimized to 3 dispersion of 2-GeV/ momentum muons due to multiple scattering.
As a result, muon detection efficiency of 86 2 % has been obtained for 1.8-2.5 GeV/ muons with a small momentum dependence. This is slightly lower than the test bench result described before (92 1 %), which is explained by additional inactive volumes between tubes. Attached figure 14 shows the results of pion mis-identification rate as a function of pion momentum, which is consistent with a GEANT [58] simulation including weak decays into muons. For the South Arm, mis-identification rate for 4-GeV/ momentum pions (about 5 GeV/ at the interaction region) has been determined to be 0.04 excluding decays. Multiplying the rejection factor of the nosecone and Central Magnet (), the net mis-identification rate of 3 is obtained, which satisfies the design value.
2.5.3 The MuID NIM-logic trigger for LVL-1
A coarse-segmented trigger system called the MuID NIM-logic trigger333 So named because the trigger circuit is constructed using NIM- and CAMAC-standard electronics. was used to trigger muons in the South Muon Arm during the Run-2 p+p period. Attached figure 15 shows a schematic view of the system.
As shown in the figure, all the MuID planes are divided into four regions (called quadrants) by horizontal and vertical lines through the middle. A trigger decision for a quadrant, that is, whether a muon has passed or not, is made by taking the coincidence of fired planes of the quadrant. Since the number of input channels of the trigger circuit is limited, only four gaps out of five were used. Deeper gaps (gap 3,4 and 5) were included since they are more important for muon identification than shallower gaps. Gap 1 was also included since (1) better tracking performance due to longer tracking length and (2) better rejection of cosmic rays and very low angle ( 9 degrees) particles. The chance for a muon to cross more than one quadrant is small. Each quadrant is further divided into two sectors for both horizontal and vertical tube orientations. Figure 14 shows the segmentation for each gap. An output of each sector, grand OR of all channels inside, corresponds to a pseudo-trigger output of a ROC. in total, 16 pseudo-trigger output signals are sent to the trigger algorithm.
Trigger decisions are made by LeCroy 2372 Memory Lookup Units (MLUs) for each quadrant. Two MLUs are prepared for each quadrant for both “deep” and “shallow” triggers. A deep trigger requires hits in all four gaps used and a shallow trigger requires hits up to gap 3. Hit patterns are required to point to the event vertex. Hit patterns such as A-A-B-B and A-C-D-D are accepted but B-B-A-A and D-A-A-C are not, for example, where four letters represent hit segments in a quadrant shown in Fig. 14 for each gap starting from the first gap. An example of an accepted-pattern is shown in attached figure 16. To minimize the loss of trigger efficiency due to finite chamber efficiencies, the algorithm allows some gaps to miss hits. For a deep trigger, 6 out of 8 gaps (including both orientations) are required to have a hit and 3 out of 4 gaps for a shallow trigger. Extra hits are allowed, thus no efficiency loss is expected due to background hits.
Total 8 quadrant trigger signals are sent to another MLU, called the “Decision MLU”, which counts the number of triggered quadrants and issues five trigger signals:
| (1) single shallow (1S) | – | one shallow quadrant is fired, |
| (2) double shallow (2S) | – | two or more shallow quadrants, |
| (3) single deep (1D) | – | one deep quadrant, |
| (4) deep-shallow (1D1S) | – | one deep quadrant and one or more shallow quadrants, and |
| (5) double deep (2D) | – | two or more deep quadrants, |
which are sent to the Global Level-1. A shallow quadrant-trigger is fired always when the deep quadrant-trigger is fired for that quadrant. Therefore, the following relations hold true: 2D 1D1S 1D 1S where A B denotes that the trigger B is always fired when the trigger A is fired. The reasons to have both shallow and deep triggers for each quadrant are (i) to achieve higher efficiency obtained with the 1D1S trigger than the 2D trigger by 30% and (ii) to study hadron punch-through background with the 1S and 2S triggers (not described in this paper).
2.6 The PHENIX DAQ system
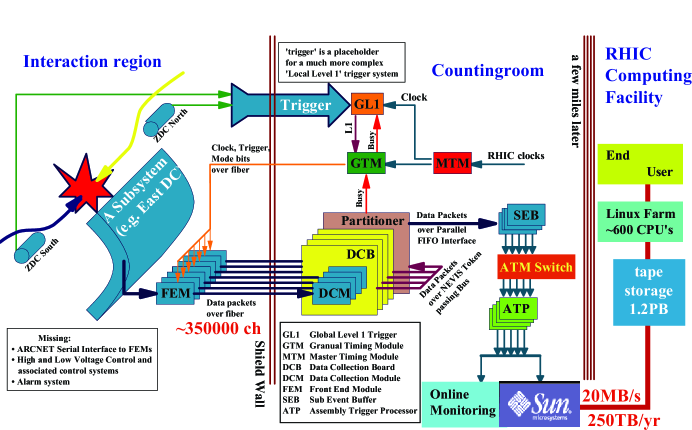
Figure 15 shows a schematic view of the PHENIX Data Acquisition (DAQ) System. All the subsystems are equipped with the timing modules called Granule Timing Modules (GTMs). The M̱aster Ṯiming ¯Module (MTM) delivers the 9.4-MHz RHIC clock to GTMs. When a trigger is issued by the Global Level-1, the clock and trigger bit are transported over optical fibers to the electronics of each detector, the Front End Module (FEM). The detector records the data in raw digitized format and transports the data packets over optical fibers to the Data Collection Module (DCM). The data are recorded in a buffer disk in the PHENIX control room where data quality is monitored online. At the maximum 60 mega-bytes per second has been achieved as a rate of recording data in the disk which corresponds to about 1200 events per second for p+p data whose size is about 50 kilo-bytes per event. The data are then transferred and stored in a huge storage tape with 1.2 bytes capacity (sharing with other RHIC experiments) for offline computing such as calibration and track reconstruction. In Run-2 PHENIX has recorded about 2 bytes for the p+p data.
2.7 Global Level-1 triggers
The level-1 triggers of PHENIX are issued by the G̱lobal Ḻevel-1̱ (GL1) module, for which local level-1 and NIM-logic triggers from various subsystems are input. The maximum DAQ rate (about 1 kHz) and the number of triggers (10 or more) limit the rates for each GL1 trigger to about 100 Hz or less. Level-2 triggers were not used during the p+p Run.
2.7.1 Minimum bias trigger
Logical OR of the BBC (BBLL1) and NTC triggers, called the “M̱inimum Ḇias (MB)” trigger was used to trigger p+p inelastic events with about 70% efficiency. MB-triggered events are useful for studying detector efficiency and background as well as extracting physics. At the highest luminosity of RHIC achieved in Run-2 (1030 cm-2 sec-1), MB trigger rate was typically 1030 cm-2 sec-1 42 mb 0.7 = 30 kHz. We have applied a prescale factor to this trigger depending on its rate to keep the DAQ rate below an affordable level. Here a prescaled factor is an integer number and defined as
During the run, = 19 to 79 were applied to the MB trigger.
2.7.2 Muon triggers
Two kinds of muon-related triggers were prepared for physics triggers:
(A) MB 1D for the single muon trigger and
(B) MB 1D1S for the dimuon trigger,
where stands for logical AND, “1D1S” and “1D” have been already explained in section 2.5.3.
The rate of the single muon trigger was usually less than 100 Hz and consistent with that of the irreducible hadron-decay background before the nosecone (1/1500 of the minimum bias rate) within a factor of two. However, we sometimes observed abnormally high (1 kHz) rates. This was found to be due to blown-up beams which hit the beam pipe and produced high-energy secondary particles (including muons) sailing through the MuID. (This background can be rejected with a vertex cut for offline analyses.) We used this trigger with = 4 when the trigger rate was too high. Rates of the dimuon trigger were typically about 1/10 that of the single muon trigger and never beyond 100 Hz. Therefore no prescale factor was applied to the dimuon trigger that has been used for the analysis described in the next section.
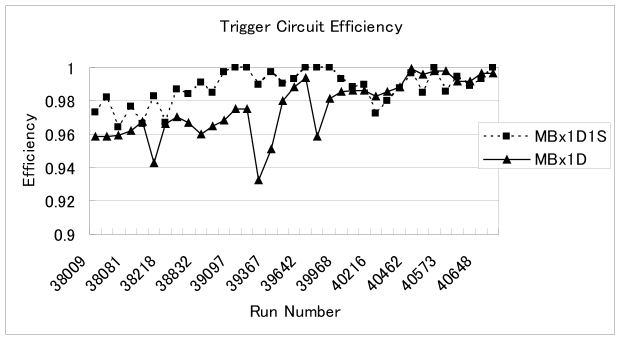
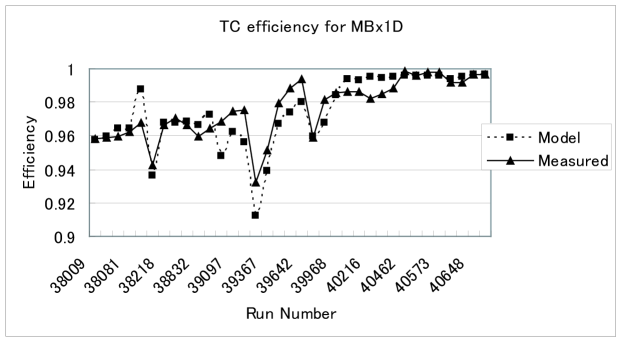
Figure 16 shows Trigger Circuit (TC) efficiencies () for 34 runs randomly selected from the runs used for the analysis. The efficiencies reflect the inefficiency of the hardware trigger circuit. It is defined as
using MB-triggered events, where a hardware trigger equals the NIM-logic trigger output (GL1 input) and a software trigger is a result of the software which emulates the trigger algorithm. On average, an efficiency of 96.8 % has been obtained for the single muon trigger and 98.7 % for the dimuon trigger with small satistical errors ( 0.1%). The inefficiency for the dimuon trigger, 1.3%, is much smaller than other errors on the cross sections for production, which will be described in the next section. Inefficiencies are ascribed to hardware dead time which depends on the trigger rate. A simple model calculation, in which all efficiency loss is assumed to be due to the dead time, reproduces for the single muon trigger well, as shown in Fig. 17. This consistency ensures that both hardware and software triggers worked as expected.
2.8 Online Monitoring
Conditions of the detectors in PHENIX have been continuously monitored online throughout the run to keep the quality of data. Monitoring of high-voltage (HV) status and data qualities are described in the following. In addition, status of such as low-voltage, electronics, and gas flows was monitored, which was rather stable.
High Voltage
Status of all HV chains was monitored attentively, which were the most delicate component of a detector. Both the MuTr and MuID suffered from trip HV chains. They were sometimes due to high current caused by unstable beam condition, but usually due to spark current caused by humidity or other reasons. Flowing gas (air or nitrogen) into the secondary volumes of the detectors (just outside of the ionization gas volume) significantly reduced the number of trip chains for both the detectors. Trip chains were automatically recovered by a script monitoring and recording the status of all chains in every 10 (MuTr) or 60 (MuID) seconds. Because of shorter recovery time (1 minute) compared to the typical run scale (1 hour) and small trip frequency ( 1 trip per channel per run) for most of the channels, its effect on the variation of detection efficiency is minimal, which is confirmed in the next section.
Data quality
For both the MuTr and MuID, hit occupancies in each chamber plane were inspected for dead electronics, dead HV chains, and hot channels. For the MuTr, distributions of relative ADC counts of samples were monitored as shown in Fig. 18, to ensure the proper timing of the read-out (peaks in the third sample). For the MuID, TC efficiency, described in section 2.7, was checked to make sure the NIM-logic trigger was working properly. No significant deviation of these quantities from criteria was observed throughout the p+p run.
2.9 Run and data summary
Attached figure 17 shows the integrated luminosity RHIC has delivered to PHENIX in the Run-2 p+p period as a function of day starting from December 21, 2001 to January 23, 2002. It has continuously grown since the beginning of January and finally reached 700 nb-1. Due to finite live-time of the PHENIX DAQ system and the vertex cut of the BBLL1 algorithm (75 cm), about a 150-nb-1 luminosity has been recorded with PHENIX. Table 5 summarizes the numbers of events with the triggers related to muon analyses.
| Trigger type | Number of events |
|---|---|
| Minimum bias | 196 |
| Single muon | 34 |
| Dimuon | 4.8 |
For the analysis, the following run and event selections have been applied: (i) runs after RHIC has achieved stable beam condition and luminosity (January 8, or the 19th day in Fig. LABEL:fig:int_lumi), (ii) runs useful for physics analysis, excluding dedicated runs for beam and detector response studies as well as runs with HV or LV off, and (iii) events with a useful -vertex, which is 38 cm.
Finally, a 81-nb-1 luminosity has been used for the analysis. The detail procedure to obtain it as well as cross sections will be described in the next section.
3 Data analysis
In this section, the branching fraction for the decay () times rapidity-differential cross section for inclusive production in the South Muon Arm acceptance is obtained, which is decomposed into
| (1) |
particles are identified in an invariant mass spectrum of pairs, where the number of ’s, , is counted with a reasonable background subtraction. The detection efficiency for the events, , is determined with a simulation, where detector response is well tuned to the real data. An integrated luminosity, , is estimated also with a simulation, where consistency with the real data is confirmed. The rapidity width is 1.0 for this case. Details of analysis procedures to obtain , and are described in the following.
The rapidity range is further divided into two in each of which differential cross section is obtained ( and ) since distribution is expected to change significantly in this region. Similarly double-differential cross section in the invariant form, , and the average value of the transverse momenta of ’s, , are obtained.
3.1 Data sample
The number of events with the triggers related to muon analyses have been shown in Table 5 in section 2.9. Dimuon triggered events, which contain most of the yield ( 90%), have been used to obtain . Minimum-bias triggered events and single-muon triggered events have been used to evaluate detector performance such as chamber efficiencies.
3.2 Muon track reconstruction
Muon tracks are reconstructed using offline software from raw data which contain information on MuID channel hits, MuTr cathode-strip charges and BBC -vertices. This section is devoted to describe the muon reconstruction algorithm, which starts from finding a track seed (a road) in the MuID then grows by attaching clusters (consecutive cathode strips) at each MuTr station.
3.2.1 MuID road finding
First, one-dimensional roads are searched using either horizontal or vertical tubes. A road seed is constructed from a hit tube in the seed gap (or the first gap in the “search order”) and event vertex position measured with the BBC or other interaction trigger counters. It is then extrapolated to the next gap in the search order, where additional hits are searched which are consistent with the road trajectory. The hit closest to the projection of the road to the gap within the search window is generally accepted and attached to the road. The road is fitted including the new hit and extrapolated to the next gap. The size of the search window is set to 15 cm (about two-tube widths) to allow a deviation from a straight-line trajectory due to multiple scattering in the steel absorbers. Two search orders, 21345 and 32145 where each number stands for the -th gap of the MuID, are used to enable roads to be reconstructed even the seed gap has inefficient tubes. Generally shallower gaps come earlier because of smaller multiple scattering, except for the first gap because of its higher hit occupancy from hadron and soft-electron background than the second or third gap. The algorithm is allowed to skip gaps without hits, in order to keep higher efficiency despite low-efficiency tubes in one or two gaps. Finally both horizontal and vertical roads are combined and final two-dimensional roads are reconstructed. Typical road-multiplicity is small ( 0.01) for minimum-bias events.
Road finding efficiency is expected to be over 99% for muons with a momentum 3 GeV/ with good chamber efficiencies (97%) and low hit occupancies as in p+p collisions. However, it was actually lower than this since chamber efficiencies measured during Run-2 were lower (90%), which will be described in the later section.
3.2.2 MuTr cluster finding / fitting
When a charged particle passes through a MuTr gap which is composed of two cathode planes and one anode-wire plane, charges are usually induced in two or three consecutive cathode-strips in each cathode plane. The hit position of the particle in each cathode plane is reconstructed with the following method.
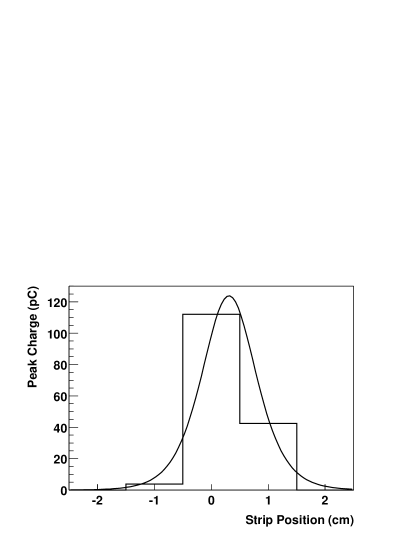
The amount of the peak charge in each cathode strip is determined by four ADC samples as described in section 2.5. A sequence of consecutive hit strips, called a cluster, is searched and fitted with an empirical formula (Mathieson function [59]) to find the one-dimensional position at which a particle would have passed in each cathode plane. Figure 19 shows an example of peak charge distribution for a cluster. The cluster position is obtained as the peak position of the fit function.
If relative gain fluctuation and noise level are 1% of a typical signal pulse or less, position resolution of 100 m is obtained, which is confirmed with the cosmic ray test described in section 2.5. With this resolution, about 110 MeV/ is expected as the mass resolution for a . However the actual noise level has turned out to be worse during the run at station 2, which was typically 3%. Degradation in mass resolution due to higher noise level is expected to be about 30% (140 MeV/), which is compared with the real data in section 3.4.
3.2.3 Muon track finding / fitting
Starting from a road found in the MuID, a track grows by attaching clusters in the MuTr stations from backward to forward, that is, station 3 to station 1.
Each road is extended to each cathode plane in station 3, where clusters are found consistent with the road inside its search window. Table 6 shows widths of the search windows for both the and directions at each station in the South MuTr. The search window in station 3 is large enough compared to position resolution of roads (10 to 20 cm depending on quality cuts on them). It gets smaller from station 3 to station 1 because track information such as position and momentum is getting more accurate in the process of track finding. By fitting clusters, a local vector called a stub is found. A stub requires at least two cathode planes with a cluster in each station. A crudely estimated momentum is assigned to the track from the last penetration gap of the MuID road.
| station | direction (cm) | direction (cm) |
|---|---|---|
| 1 | 20 | 10 |
| 2 | 30 | 25 |
| 3 | 50 | 40 |
The track is then extrapolated to station 2, using an effective bend-plane and a momentum kick, which are determined by the approximate momentum and the magnetic field inside the Muon Magnet. Clusters are searched again in station 2 within the search window. If a stub is found in station 2, the stubs in station 2 and 3 are fitted altogether to assign more accurate momentum to the track. It is again extrapolated to station 1 using better momentum information, where clusters are searched and attached to the track once more. The minimum number of hit planes required for a track is 12 out of all 16 planes.
Finally all the cluster positions and the event vertex position are fitted with the Kalman-Filter algorithm [60], which is a recursive technique to obtain the solution to a least-squares fit, to determine the momentum vector of the track at the event vertex taking energy loss in the absorber (the Central Magnet and copper nosecone) into account.
Position resolution of the BBC, expected to be about 2 cm with a simulation, is confirmed with the real data. Figure 20 shows distribution of the differences between -vertices found with the BBC and the Pad Chambers (PC) in the Central Arms [49]. The distribution is fitted with a double Gaussian function. The larger Gaussian has a 2.7 cm width, while the smaller one has a 9.8 cm width which is supposedly due to background contribution. Resolution of the PC is expected to be also about 2 cm with a simulation, which is consistent with the real data with background subtracted.

3.3 Single muons
In this section, some properties of reconstructed muons are shown to demonstrate their qualities and South Muon Arm performance.
3.3.1 Event vertex distribution
Low-momentum ( 5 GeV/) single muons, the majority of the inclusive muon yield, are expected to be dominated by charged hadrons decaying weakly into muons ( and ) in flight before the nosecone. Contribution of punch-through hadrons is small, which has been confirmed by the beam test described in section 2.5. The decay probability for charged pions is given by
where is the distance between the vertex point and nosecone including one hadronic interaction length of the nosecone (15 cm), is the branching fraction for the decay , is the ratio of the particle energy to mass and is the decay length of the particle. Typical value of is 3 for GeV/ muons. The same kind of formula holds also for charged kaons. The net contribution of charged kaons to single muon spectra is expected to be about the same as that of charged pions.
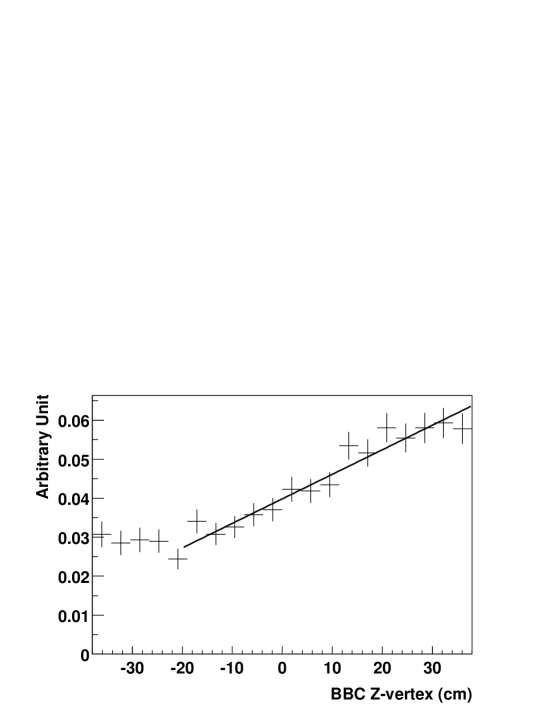
Figure 21 shows BBC -vertex () distribution for single-muon events divided by that for minimum-bias events in the range cm which is a cut used for the analysis. Error bars indicate statistical errors of the particular run. The solid line shows a straight line fit to the data assuming flat distribution for non-decay components, which reproduces the data very well in the range 38 cm. The deviation from the fit in the range cm is due to the increase in background induced by very low angle particles. From the fit, the fraction of non-decay components is determined to be about 20%, which supposedly includes background such as punch-through hadrons and ghost tracks as well as physics signals such as charm and bottom mesons decaying semi-leptonically.
The dominance of decay muons to the measured single-muon yield is consistent with an expectation, which confirms that the South Muon Arm has been worked as expected and there is no significant contribution of ghost tracks nor punch-through hadron background to reconstructed muons.
3.3.2 Track-road matching
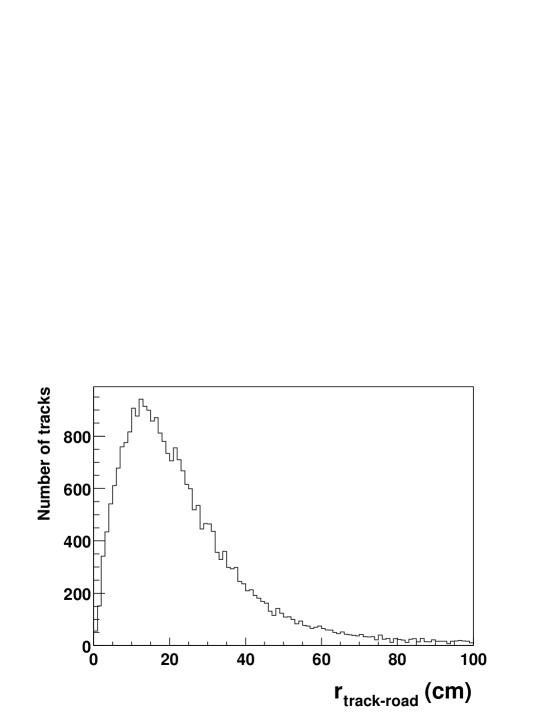
Figure 22 shows distribution of the distance between intersections to a station-3 plane of a track and a corresponding road, . The peak is around 10 cm which is consistent with the expectation from the position resolution of a road (8.4 cm) and multiple scattering in the absorbers, thus demonstrating that the two detectors match well as expected.
3.4 Dimuon mass and
Figure 23 shows invariant mass spectra for both unlike-sign and like-sign muon pairs with the following cuts:
-
•
BBC -vertex position 38 cm, which is between the north and south copper nosecones ( 40 cm) minus resolution of the BBC (2 cm), and
-
•
track -vertex consistency 30 cm where and represent the -vertex position of each track obtained as the closest approach to the -axis. This cut corresponds to about 2 of the position smearing of a track due to multiple scattering in the Central Magnet steel (about 10 cm for each track).
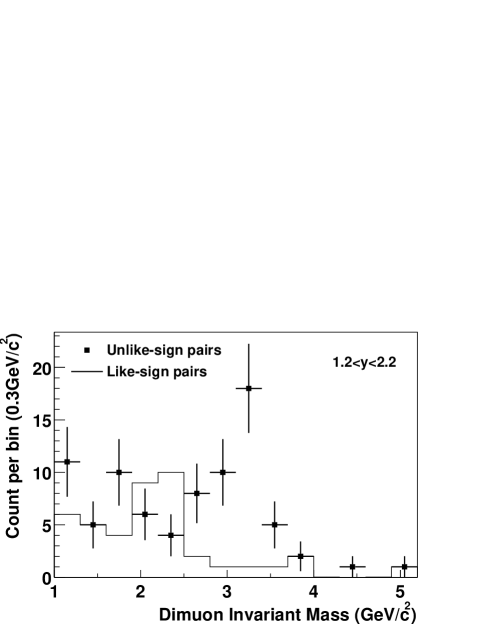
A significant enhancement is found in the mass region for unlike-sign pairs while no such a peak is found for like-sign pairs.
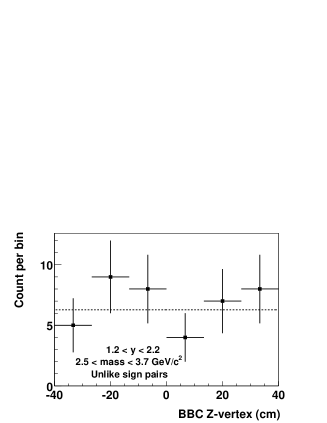
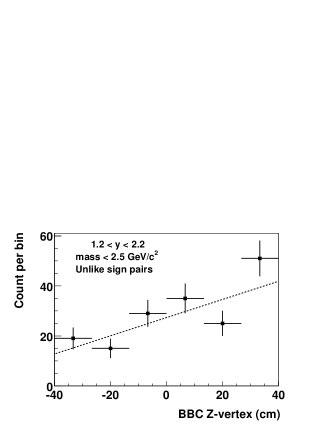
Figure 25 and 25 show BBC -vertex distributions for unlike-sign muon pairs in the mass region (2.5 GeV/ 3.7 GeV/) and the background region ( 2.5 GeV/) respectively. Larger contribution from the far-side of the South Arm (positive ) in the background region confirms that the dominant fraction of background comes from hadron decays as shown also for inclusive single muons (Fig. 21). On the other hand, the flat distribution for the candidates is consistent with the much shorter decay-length of a ( m).
From a simulation study using the PYTHIA event generator [61] and GEANT [58], it is found that the combinatoric hadron-decay background does not produce a large (30%) difference between the numbers of unlike-sign and like-sign muon pairs in the mass region including dead electronics and chamber efficiencies during the run. The consistency of PYTHIA simulation with experimental data will be examined in section 3.6.3. The number of pairs from the Drell-Yan process is estimated to be small (0.03 events) according to a PYTHIA simulation. Thus we have simply assumed that the number of background for unlike-sign pairs is the same as the number of like-sign pairs then obtain
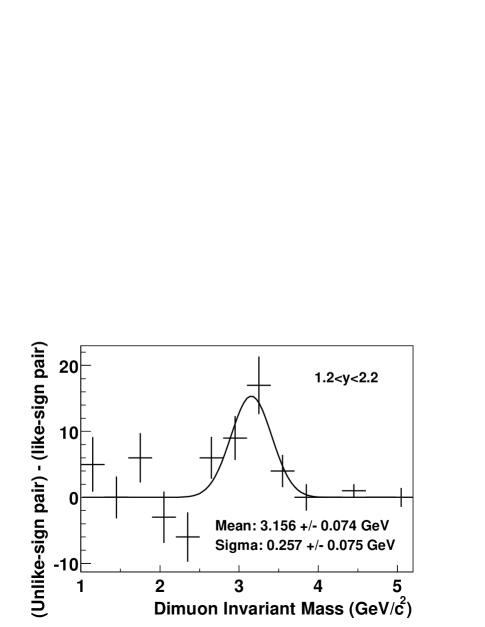
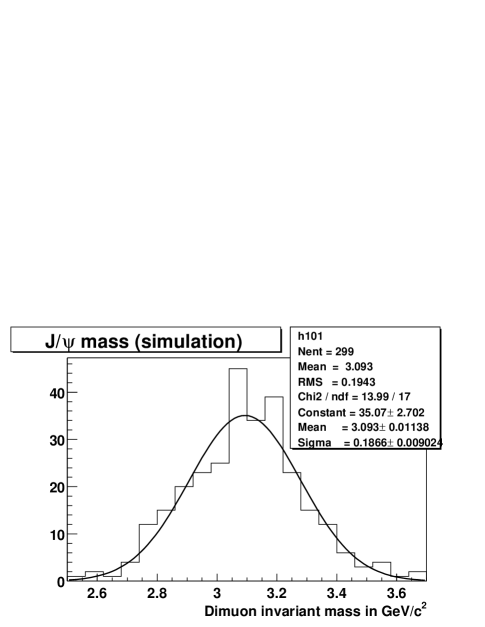
Figure 26 shows the difference between the invariant mass spectrum of unlike-sign muon pairs and that of like-sign pairs, which is fit to a Gaussian distribution. The center position, 3156 74 MeV/, is consistent with the mass (3097 MeV/ [62]). The width, 257 75 MeV/, is slightly worse than the expectation with the realistic chamber noise (3% at station 2), which is roughly 140 MeV/. This discrepancy is supposedly due to the alignment of MuTr chamber positions done only to 300 m due to the limited number of straight tracks with the magnetic field off used for the alignment. Mis-alignment effectively worsens the chamber resolution since it can differ octant by octant and has different effects on each charge. The net effect on the mass resolution is studied with a simulation and about 190 MeV/ is obtained as shown in Fig. 27, which is consistent with the real data.
We estimate a systematic error of 10% on the background-subtracted yield adjusting the mass window by 300 MeV/ that is roughly the resolution for a . The Gaussian fit gives = 33.0 which is consistent with the simple counting method within the systematic error.
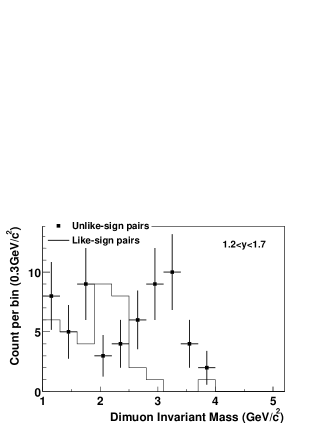
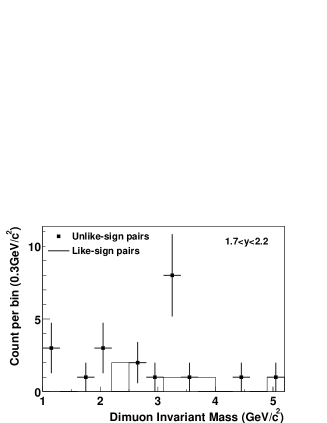
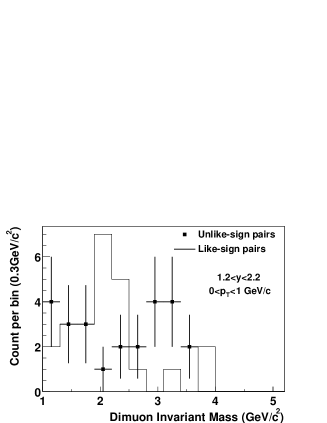
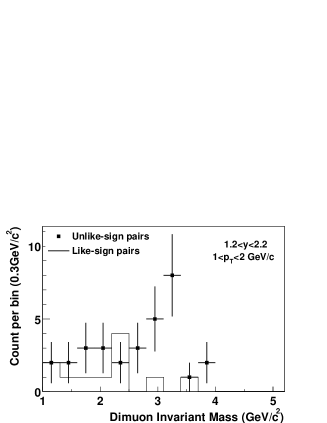
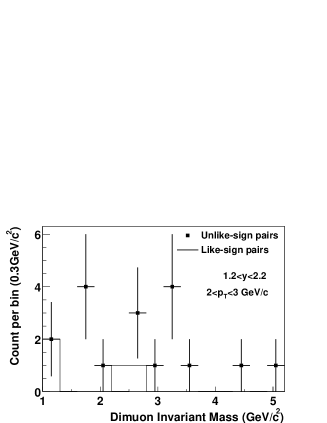
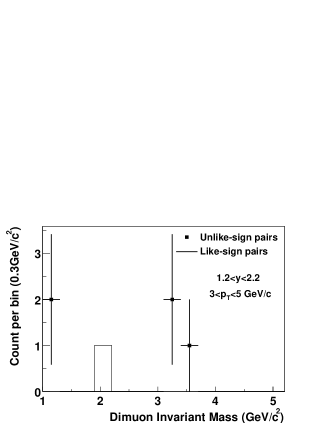
To obtain and rapidity differential cross sections, invariant mass distributions for two rapidity bins (1.2 1.7 and 1.7 2.2) and four bins (0 1, 1 2, 2 3 and 3 5 in unit of GeV/) are shown in Figs. 29 through 29 and Figs. 31 through 33 respectively. The numbers of ’s in each bin are obtained in the same method described above and summarized in Tables 9 and 10 in section 4.1. Fluctuations of the background yields in each range seem to be of statistical nature and no effect is expected on . For the highest bin ( GeV/) with = 3, background contamination due to such as mis-alignment of MuTr cathode strips is estimated to be small (1 count) from the counts in the higher mass and higher regions as summarized in Table 7.
| 2.53.7 GeV/ | 3.7 GeV/ | |
|---|---|---|
| 3 5 GeV/ | 3̱/0 | 0/1 |
| 5 GeV/ | 0/0 | 2/2 |
3.5 detection efficiency
Total detection efficiency for events in p+p collisions, , is decomposed into four factors:
| (2) |
where
| : | South Muon Arm acceptance times reconstruction efficiency for muon pairs from ’s produced in 1.2 2.2 with 100% chamber efficiencies, |
|---|---|
| : | Efficiency correction due to real chamber efficiencies of the MuID, |
| : | Efficiency correction due to real chamber efficiencies of the MuTr, and |
| : | Efficiency of BBC for p+p (1.2 2.2) events. |
Analysis procedures and results of each factor will be described in the following.
3.5.1 Detector acceptance
The geometrical acceptance of the South Muon Arm is represented as including reconstruction efficiency for muon pairs from ’s produced in 1.2 2.2 with 100% chamber efficiencies. In p+p events, multiplicity is sufficiently small to achieve high (90%) reconstruction efficiency when hits are found in chambers. Therefore, is close to the geometrical acceptance itself. Using simulation, is calculated as
where PYTHIA has been used to produce events, based on the color-singlet model. Rapidity and distributions (at lower ) of do not depend on the production model unlike a total cross section, and are consistent with the real data as discussed in section 4.1. The same reconstruction software, parameters and cuts are used as the real data. The result of the average value of is 0.11 requiring a dimuon trigger. Rapidity and dependence will be described in section 3.5.5 including finite chamber and BBC efficiencies ().
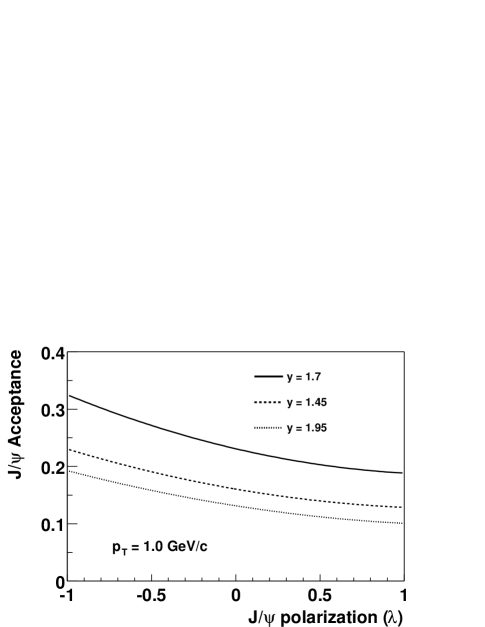
Polarization of or spin-alignment (denoted as ), which is sensitive to its production mechanism, is unknown at = 200 GeV and not possible to be determined with the limited number of ’s obtained in Run-2. The South Muon Arm acceptance has significant dependence as shown in Fig. 34, giving a systematic uncertainty of . This dependence is primarily a result of the GeV/ lower-momentum cutoff which cuts off the backward-going daughter muons in the rest-frame with respect to the momentum direction of the in the laboratory frame. Results of both lower-energy experiments and Tevatron indicate that is no larger than 0.3 especially for low- ( 1 GeV/) and low- ( 0.1) ’s [47, 43] which dominate our yield. On the assumption of 0.3, we have assigned a 10% systematic error of .
3.5.2 MuID efficiencies
MuID efficiencies for single-muons and dimuons are estimated using MuID-panel efficiencies obtained from a sample of 37 runs randomly picked up to cover the entire run-period.
Efficiency of the specific MuID plane for a muon, , is given by
for each orientation. Only minimum-bias triggered events have been used for this efficiency study since MuID-triggered (single-muon and dimuon trigger) events are possibly biased by the trigger algorithms. Since we allow “skipped gaps” in the road finding algorithm described in section 3.2.1, the plane is not necessarily excluded from the search order. This is confirmed by comparing results with two search orders with and without the plane . Since efficiencies for planes in the seed gaps444The first and second search-order gaps in this case. are not possible to be extracted, two sets of search orders are used to obtain panel efficiencies for all the gaps:
-
•
search order set : 21345 and 12345 for gap 3,4,5 and
-
•
search order set : 45321 and 54321 for gap 1,2,3
where two search orders in each set are tried in the algorithm. Panel efficiencies in gap 3 obtained with and are compared and found to be consistent within their statistical uncertainties (2%), which indicates panel efficiencies are not sensitive to the search order.
Tighter cuts in the road finding algorithm, such as the (the distance between the origin and the intersection of a road to the = 0 plane) cut, are used than those for the usual muon reconstruction to reject ghost roads as much as possible and select only good quality roads. Furthermore, additional cuts are applied to sample roads: (i) each road should penetrate through all the five gaps, (ii) only one road is found in each event, (iii) each has a hit in the other orientation in the panel of interest and (iv) each has a hit of either orientation in both adjacent planes. Cut dependence on panel efficiencies is studied for example, change (iv) (iv)’: has a hit of both orientations in both adjacent planes. The result is consistent with the original one to the statistical accuracy of the result (2%).
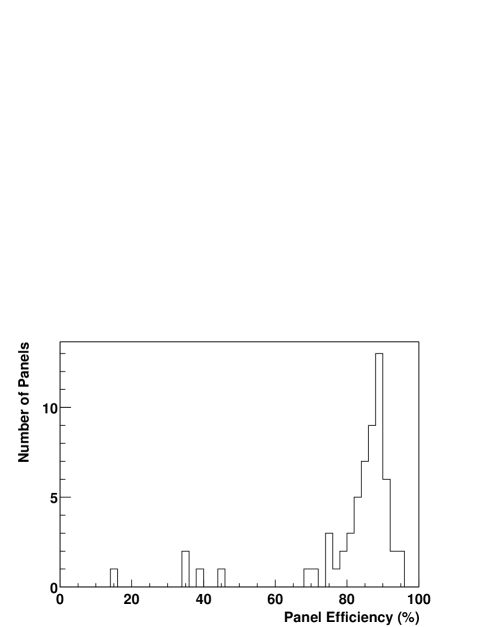
Figure 35 shows distribution of panel efficiencies for all the 60 panels in the South MuID including both orientations. Most of them gather around 90% but some are smaller because HV (high-voltage) potentials applied to both layers of each panel-orientation (see Fig. 13 in section 2.5) were not high enough ( 4300 V) in order to avoid sparks or some problems. In addition, about one third of all HV chains had one dead or lower-potential layer, for which about 90% efficiency is expected. However, other two thirds had good potentials on both layers, where about 98% efficiency is expected [57]. The panel efficiencies obtained from the real data are somewhat smaller than the naive expectation. A possible explanation is we have applied potentials of 4350 V nominally during the run which may not be high enough since it is about the edge of the plateau of the excitation curve (typically, 4300 V). For example, an effective potential may drop by 100 V with a 100 nA current flow on an anode wire, where a typical measured-current on one HV chain (about 20 tubes) was 10 to 100 nA.
Trigger and road-finding efficiencies have been estimated with simulation including the trigger emulator and the MuID chamber efficiencies obtained above for both single muon and dimuon () events. Definition of MuID efficiency for single muons is given by
where represents the number of reconstructed muon tracks through a full simulation. The similar definition is applicable for ’s, which is equivalent to requiring a dimuon trigger in both the numerator and denominator. For a single muon with = 5 GeV/, 80% efficiency is obtained and 62% for a requiring a single or dimuon trigger respectively. These are consistent with a very crude prediction that since the average momentum from ’s ( = 5 GeV/) is used for the single muon simulation.
Without trigger requirements higher efficiency is expected, since the offline road-finder is more flexible than the online trigger algorithm, that is, less susceptible to chamber efficiencies. For single muons, 86% efficiency is obtained using minimum-bias triggered events. The ratio ( requiring a trigger) to ( not requiring a trigger) is obtained, which is 0.93 and consistent with that of the real data (0.92) with about 2% statistical errors for each. This consistency verifies the chamber efficiencies obtained with the method described above.
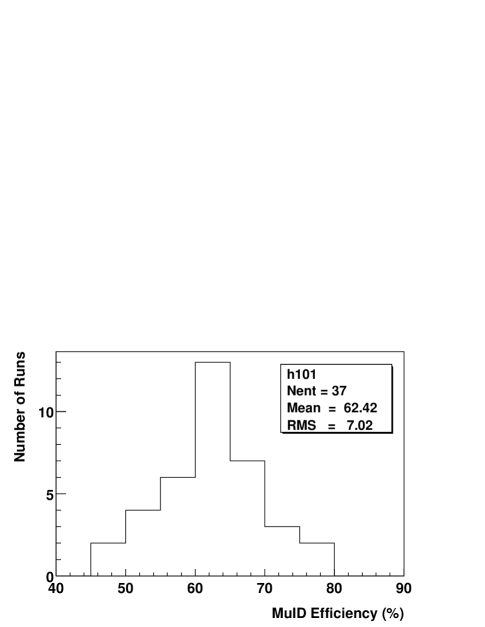
Run dependence of is also studied with a simulation and found that its variation is 11% which is shown in Fig. 36. This fluctuation is roughly consistent with statistical uncertainties of panel efficiencies which are typically 3% for each panel and the minimum requirement for the number of hit planes which is 9 for a dimuon trigger (3% = 9%).
MuID Hit Occupancy
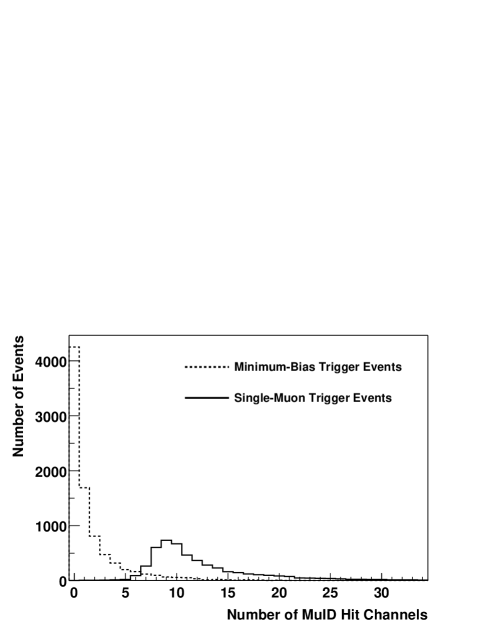
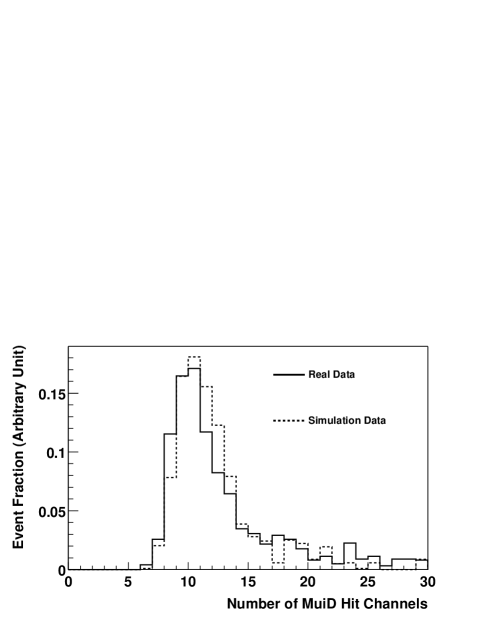
In high particle-multiplicity environment such as in Au+Au collisions, road finding efficiency may drop because of difficulty in hit-road associations. However in p+p collisions, much smaller hit occupancy ensures high road-finding efficiency. Figure 37 shows distribution of the number of MuID hit channels per event. Most of the minimum-bias triggered events have zero or small hit multiplicities. On the contrary, the hit multiplicity distribution for the single-muon triggered events has a peak around 9 or 10 which is the expected number of hits when a single muon penetrates through the entire MuID (5 gaps 2 orientations). This indicates that most of MuID hits are induced by signal muons and not by background hits such as from soft electrons.
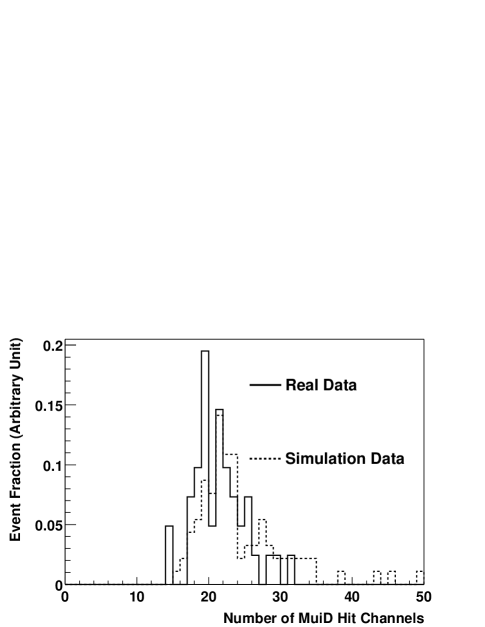
Figures 38 and 39 also show MuID hit multiplicities in single-road events and candidate events (unlike-sign dimuons in the mass region) respectively, both of which are compared with simulations. For both cases, hit multiplicities agree with simulations and again confirm hit occupancies in the real data are small as expected. Provided valid particle multiplicity of the event generator (PYTHIA) which is confirmed in the next section, this consistency assures response and performance of the detectors are as expected; thus, no efficiency degradation is suspected.
3.5.3 MuTr efficiencies
Efficiencies of each MuTr plane for a muon are known to be high (99%) inside active detector volumes according to a cosmic ray test. Inactive volumes between octants, which are their frames, are included in the detector acceptance (about 70% for a single track). Some dead Front-End Modules (FEMs) and high-voltage supply chains during the run caused inefficiencies primarily.
A sample run was selected to model MuTr dead FEMs, dead electronics channels and dead high-voltage chains. To examine consistency of the model with the real data, MuTr efficiencies for a single muon defined as
are obtained using both the real data and simulation to be compared. Tighter cuts are applied to the sample roads to reject as many ghosts as possible. Figure 40 shows as a function of , which is the distance between the origin and the intersection of a road to the plane. The decrease in efficiency at large is due to contamination of background roads presumably from beam scraping that has caused high trigger rates as described in section 2.7.2. The cut cm is applied to eliminate them. Other road quality parameters are checked in the same way and confirmed to be valid. About 80% of the road sample is dominated by hadron-decays as demonstrated by the BBC -vertex distribution as already shown in Fig. 21. A fraction of ghost roads is further constrained by -vertex dependence of , because efficiency is sensitive to the fraction of non-ghost roads with -vertex dependence, which is dominanted by decay muons. Actually, there is no significant dependence on BBC -vertex as shown in Fig. 41. The fraction of the ghost roads to the road sample is constrained by fitting it assuming a flat -vertex distribution for them and estimated to be less than 5%.
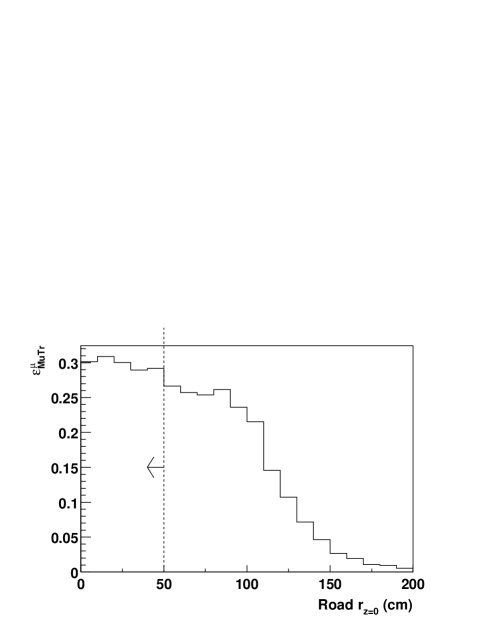
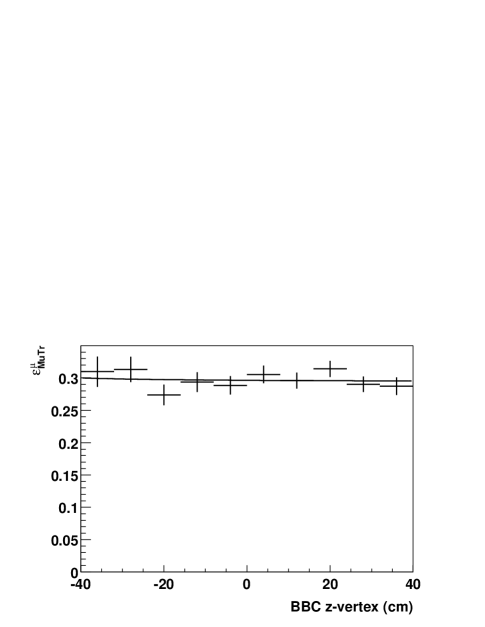
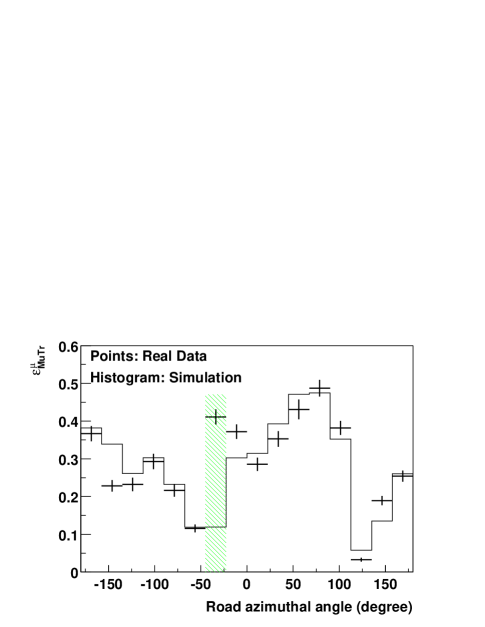
Figure 42 shows MuTr efficiencies for both the real and simulation data as a function of the azimuthal angle of the qualified roads. There is a reasonably good agreement of the real data and simulation with exception of the region in to (octant 8, half-octant 1 or 8-1). This discrepancy is turned out to be due to the improper treatment of the simulation data in 8-1, which has reduced its acceptance significantly (25%). Since an opening angle between two muons from a decay is large (30 60 degrees), the probability for either muon to fall into the half-octant 8-1 is roughly (1/16) 2 = 1/8 where 16 is the number of all half-octants. In that case, efficiency is 25% of the ordinary case. Therefore, the overall efficiency for a , is estimated to be
compared to the normal case. Therefore we assign a systematic error of 10% to of this particular run based on the disagreement between the simulation and real data. The -averaged values of obtained are (29.6 0.3) % for the real data and (28.2 0.3) % for simulation with statistical errors, whose difference is consistent with the systematic error of obtained above assuming a crude relation .
To minimize an uncertainty due to run dependence of MuTr efficiency, only runs with a high duty fraction are selected and used for the analysis. Here we define the duty fraction for each run as
each integrated over all measurements in every 10 seconds during the run. We have selected runs with 0.89. To estimate run dependence of MuTr efficiencies, 26 sample runs with 0.89 and relatively longer run time are selected to see their variations. Figure 43 shows distribution of for those runs and variation is found to be 4%. It should be noted that is slightly higher than since the average momentum of muons from decays (about 5 GeV/) is higher than that of muons used for the calculation of (about 3 GeV/) with lower efficiency.
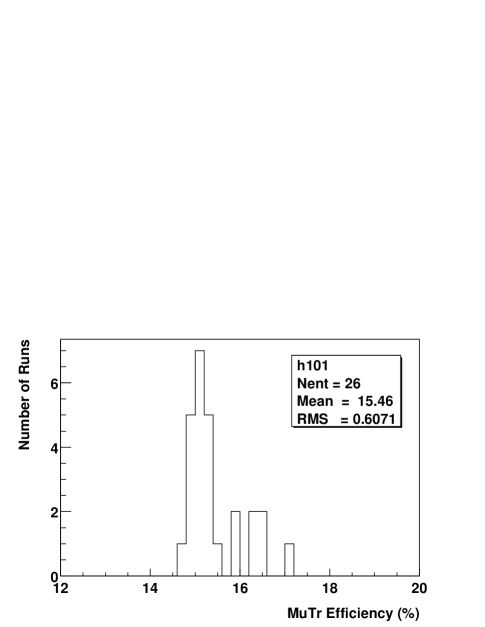
Cluster hit occupancies in the real data have been examined. Figure 44 shows distribution of the average number of clusters in each half-octant for minimum bias events. They are typically 0.02 or 0.03 and sufficiently small not to worsen reconstruction efficiency for muon tracks.

3.5.4 BBC efficiency for p+p events
Efficiency of the BBC for p+p events (), where a decays into a muon pair detected in the South Muon Arm, is estimated to be 0.74 0.01 (stat.) from simulation studies using PYTHIA and GEANT. No significant nor rapidity dependence has been found. This factor is closely related to which is BBC efficiency for p+p inelastic events and will be described in section 3.6.3. The systematic error of will also be discussed there.
3.5.5 Total detection efficiency
Total detection efficiency is given by
with a simulation including the MuID, MuTr and BBC efficiencies obtained in the previous subsections. Run-averaged values are used for the MuID part. For the MuTr part, dead FEMs, high-voltage chains and real ADC gains with the particular run resulting 15.3% efficiency (see Fig. 43) are used. About 88 000 PYTHIA events with unpolarized ’s are simulated and is obtained which is (1.19 0.03)%. where the error stands for the statistical error of the simulation. PYTHIA’s and rapidity distributions are consistent with the real data as shown in the next section.
Transverse momentum () and rapidity () dependence are shown in Figs. 45 and 46 respectively. Error bars represent statistical errors of the simulation. Relatively small dependence of is found in the range GeV/ which is the statistical limit of our measurement. For the calculation of differential cross sections for production, averaged values are used in each rapidity or bin shown in Tables 9 and 10 in section 4.1. A slight decrease in at higher is due to the bias of the dimuon trigger which requires two different quadrants to be fired, thus losing some ’s with a smaller opening angle between two muons. A systematic error of due to the uncertainty of ’s distribution is estimated to be small ( 2%) by changing efficiency values in each bin within their statistical uncertainties. Rapidity distribution is sensitive to gluon density in the proton. A systematic error of due to the uncertainty of the rapidity distribution is studied using PYTHIA with various parton distribution functions. As a result the variation of is found to be negligible ( 2%).
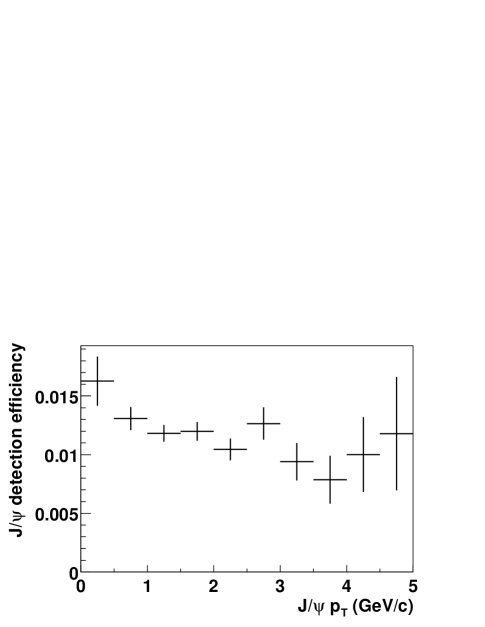
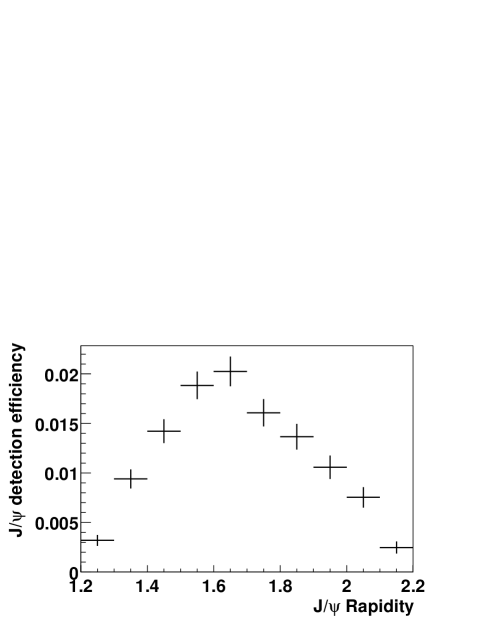
3.6 Integrated luminosity
The integrated luminosity used for this analysis is given by
| (3) |
where
| : | the number of minimum bias triggers with an offline BBC -vertex cut, |
|---|---|
| : | efficiency of the BBC for p+p inelastic events with the same vertex cut, and |
| : | p+p inelastic cross section. |
Analysis procedures to obtain these factors will be described in the following.
3.6.1 Number of minimum bias triggers
The number of minimum-bias triggered events integrated over all the selected runs is represented as , with an offline BBC -vertex cut cm. Since most of minimum bias triggers have been prescaled (see section 2.7.1), it is not possible to obtain un-prescaled values of . Instead it is calculated as
| (4) |
for each run where un-prescaled (live) counts of all minimum-bias triggers are obtained from the run control log and the ratios of minimum bias events with a BBC -vertex cut () to all minimum bias events () for each run are obtained from the prescaled data. Intergated over all the runs used for the analysis, 1.72 has been obtained with a very small statistical error.
The fraction of the number of triggers from beam-related background is found to be less than 0.1% with the beam test, where the rate of the BBLL1 trigger was reduced from 10 kHz to 23 Hz when beams were mis-steered. Crossing-by-crossing variation for minimum-bias triggered events, shown in Fig. 47, also give us an estimation of the magnitude of the background. Since beam-related background events happen randomly, its fraction is estimated by the ratio of the number of events in non-collision crossings (even numbers in the figure) to the number of events in collision crossings (odd numbers in the figure). If a BBC -vertex ( 75 cm) is required (the upper figure), the ratio is less than 0.1%. On the other hand, it goes up to 10% if no BBC -vertex required (the lower figure), which means NTC-exclusive triggered events suffer from beam-related background by 10%.
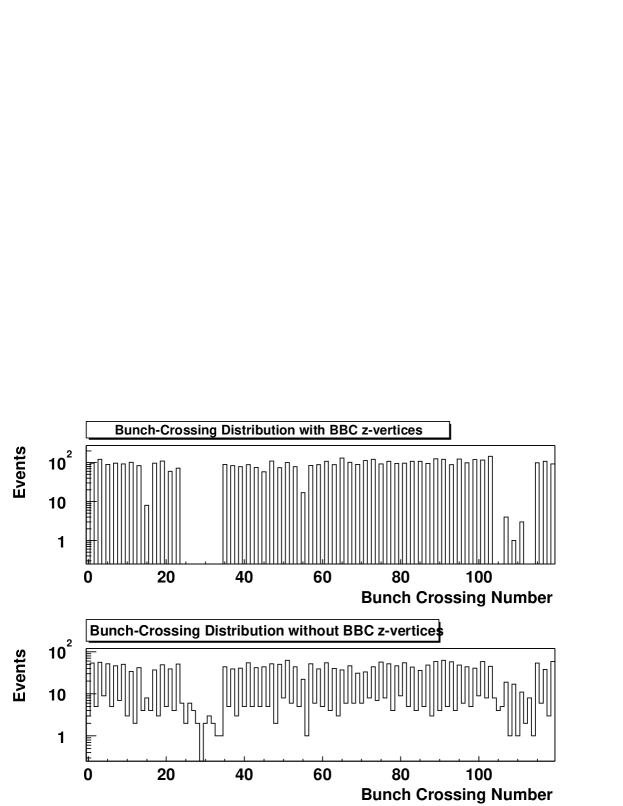
3.6.2 p+p inelastic cross section
The total p+p cross section at GeV has not been measured yet. Following parametrization for as a function of is given in [62] as well as fit parameters, which reproduce experimental data well.
| (5) |
where , , are in mb and and are in GeV2. The first and second terms, which represent the pomeron contribution, dominates at high . The exponents and represent lower-lying -even and -odd exchanges, respectively. From the fitted parameters given there, is determined to be 51.5 1.1 mb at = 200 GeV. Elastic cross section is also obtained (10.2 0.3 mb), yielding the inelastic cross section of mb.
Pseudo-rapidity range of protons from elastic p+p scattering is 5 9 which is out of BBC acceptance, thus being excluded from the luminosity calculation.
3.6.3 BBC efficiencies
Efficiencies of the BBC for inclusive p+p inelastic events, , and for p+p events, , are sensitive to charged particle multiplicity which has not been measured at = 200 GeV before. We have used the event generator PYTHIA to estimate them, whose consistency with the real data is fully examined.
PYTHIA and the PHENIX detector simulation using GEANT give = 0.74 0.01 and = 0.51 0.01 respectively with a 38 cm cut, where errors are statistical errors of the simulation. Because of higher multiplicities in p+p events than in inelastic events on average, is larger than . No significant nor rapidity dependence has been found for .
To cross-check these results for their validities, relative efficiency is compared with the real data, where is efficiency of the MB (minimum bias) trigger, logical OR of BBC and NTC triggers, for p+p inelastic events. From simulation, = 0.51/0.70 = 0.73 is obtained with a 1% statistical error. However, NTC trigger rate has suffered from beam-related background which is not included in the simulation. Its fraction is about 10% at maximum as described in section 3.6.1. Therefore is expected to vary from 0.67 to 0.73. Figure 50 shows run statistics for the relative rate of the BBC trigger to the minimum-bias trigger which is identical to . The distribution is consistent with the expectation from the simulation and background rate. The lower tail is due to runs with higher background (or NTC trigger) rate. Even at the highest rate, contamination of the beam scraping background to physics events is expected to be small ().
BBC efficiencies are sensitive to particle multiplicities especially in and near the BBC acceptance (3.0 3.9) given by the event generator. Figure 48 shows comparison of PYTHIA with the UA1 data [63] for the spectrum for inclusive charged hadrons at central rapidity () in p+ collisions at = 200 GeV. They are in good agreement to 20% precision. Since gluon-gluon scattering dominates the inclusive charged-particle yield for both p+p and p+ collisions, the consistency in p+ collisions indicate the consistency in p+p collisions. In Run-2 at RHIC, differential cross sections for the neutral pion production have been actually measured in the PHENIX Central Arms () in p+p collisions at = 200 GeV which agree with the UA1 results in the range 4 GeV/ to about 10% precision [64]. Figure 49 shows comparison of PYTHIA with the UA5 data [65] for the charged-particle pseudo-rapidity distributions in p+ collisions at = 200 GeV. PYTHIA distribution is again consistent with the real data to 20% precision. A systematic error of from uncertainty of particle distribution is estimated by changing charged particle multiplicity in PYTHIA by 20% tuning parameters on the fragmentation function 555for example, change PARJ(41) from 0.3 to 1.3 and PARJ(42) from 0.58 to 1.58, which represent the parameters and respectively in the Lund fragmentation function and changes of are found to be 15% or less. PDF (parton distribution function) dependence is also studied and is found to be smaller (3%). Therefore a 15% systematic error is assigned to from the uncertainty of the initial particle distribution. The relative trigger rate is 0.80 when particle multiplicity is increased by 20% and 0.66 when decreased, both of which are deviated from the measurement and indicating the particle multiplicity with the original PYTHIA parameters reproduces the real data well.
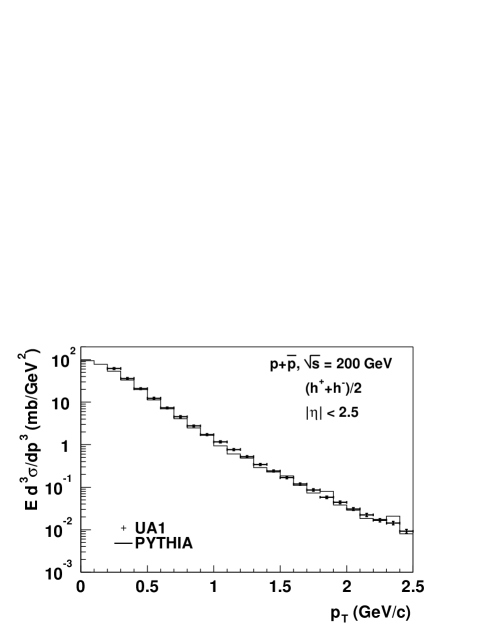
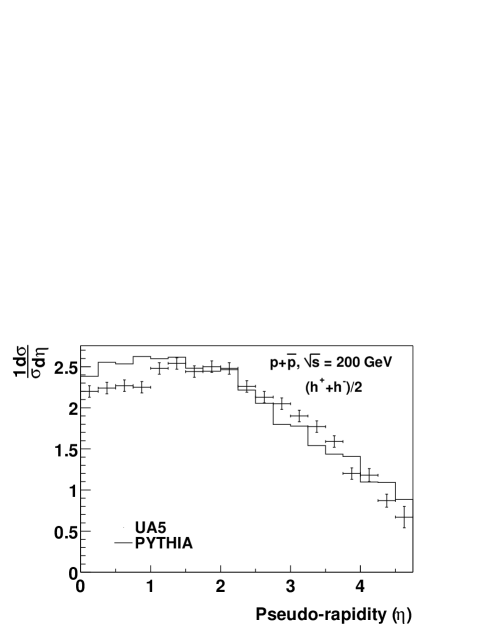
In the p+p run, event vertex distribution varied from 40 cm to 70 cm in rms. If had a significant dependence on the -vertex position, it would be affected by the change in the vertex distribution. However, no -vertex dependence within 38 cm is actually found over the statistical uncertainty of the simulation study ( 3%); hence, no fluctuation in is expected during the run.
High-voltage potentials applied to each PMT (photomultiplier tube) of the BBC were stable during the run. However there is PMT by PMT fluctuation in discriminator-threshold values possibly by 10 to 20% which is not reflected in the simulation. It gives rise to an uncertainty of . However it is found to be small ( 5%) with a simulation by conservatively doubling and halving all the PMT threshold values.
As the ver der Meer scan 666 a technique to measure the cross section of a beam by steering result, has also been determined to be 18.5 1.9 mb. This is consistent with obtained with the simulation times obtained in the previous subsection within their errors.
The same magnitude of uncertainty is expected on . However, some systematic uncertainties of and will be canceled out since the total cross section is proportional to their ratio. For example, if particle multiplicity is higher in inelastic events, it tends to have higher multiplicity also in events. Therefore a smaller systematic error of is assigned which is 10%.
BBC efficiency for another hard scattering events in p+p collisions, production events, has been measured in the Central Arms ( 0.35) in Run-2 [64]. It is relatively independent and consistent with a PYTHIA simulation within a few percent of errors, as shown in attached figure 18. It confirms that PYTHIA reproduces particle multiplicities in p+p hard scattering events for which BBC efficiency is scale and (supposedly) process independent.
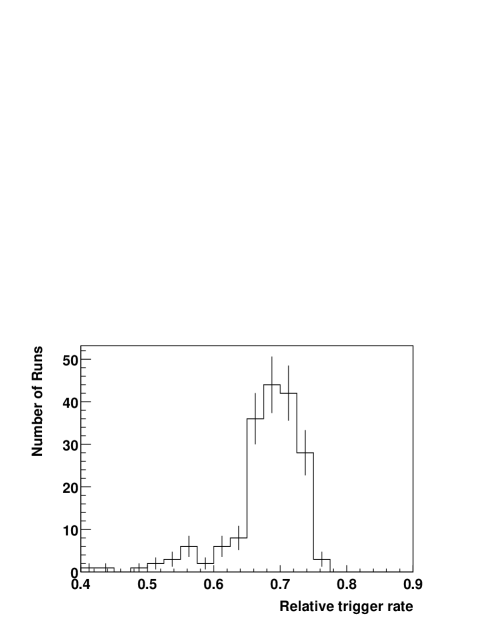
3.7 Average
The average value of the transverse momentum () of ’s, is calculated as
where is an uncorrected value of , is a correction factor due to dependence of efficiency and is another correction factor due to the shift and resolution of momentum. Following descriptions are for procedures to obtain each factor.
3.7.1 Uncorrected
All data points are 5 GeV/, which is reasonable with the number of events obtained. A statistical error of , is calculated as , where is the number of events. Table 8 shows and for both unlike-sign and like-sign muon pairs with the identification cuts described in section 3.4.
| count | |||
|---|---|---|---|
| unlike-sign pairs | 41 | 1.59 GeV/ | 0.15 GeV/ |
| like-sign pairs | 5 | 1.51 GeV/ | 0.31 GeV/ |
Assuming the same distribution for unlike-sign and like-sign muon pairs from background,
is obtained where a suffix () represents unlike (like)-sign pairs.
3.7.2 Efficiency corrections
The dependence of the detection efficiency has been obtained which is relatively small (shown in Fig. 45). The correction factor = 1.06 is obtained with a 3% statistical error because of slightly higher efficiency for low ’s.
A systematic error of has been estimated to be 4%, by increasing efficiency for lower ( 2 GeV/c) ’s while decreasing for higher ( 4 GeV/c) by statistical errors of the simulation and vice versa.
It is confirmed that a correction of due to rapidity dependence of efficiency is small (1%) since the correlation between and rapidity is small.
3.7.3 Momentum offset and resolution correction
The change in from finite momentum resolution and momentum shift has been estimated using a simulation, based on the observed center position of the mass, 3156 74 MeV/, and its resolution, 257 75 MeV/, which are shown in Fig. 23.
Assuming the shift of momentum is a constant (momentum-independent) and the effect of momentum resolution on is small, momentum shift is naively expected to be (3156+74-3097)/3097 +4% at the worst case (using = 3097 MeV/ [62]). To estimate the entangled effect of both the momentum shift and resolution on , following two models are assumed for the shift and resolution : (I) , and (II) , , where , , and are parameters which have been determined to reproduce the real data. For example, mis-calibrated magnetic field can cause (I), whereas mis-alignment of the MuTr chambers causes (II). The shifts of are estimated using PYTHIA events whose shape is consistent with the real data as shown in the next section. The correction factor is calculated as where is the average of unpolarized ’s generated by PYTHIA and is the average of ’s reconstructed from the smeared-momentum muons with the formula (I) or (II) above. In the worst case, where parameters are fixed to reproduce the 3230-MeV/ center position and 250-MeV/ resolution of , = 0.95 is obtained for (I) and 0.94 for (II) with 2% statistical errors of the simulation both of which are consistent with the naive expectation. Without mass shift, where parameters are tuned to the 3097-MeV/ center position and 250-MeV/ resolution, does not alter over the statistical errors of the simulation (2%) for both (I) and (II) cases. Consequently, the correction factor = 0.97 0.05 is obtained.
4 Results and Discussions
4.1 Differential and total cross sections
Results of rapidity-differential and double-differential cross sections for production measured in the South Muon Arm are summarized in Table 9 and 10 respectively with each factor for them shown in the equation (1). Systematic errors of each factor are summarized in Table 11.
| , , , | (nb) | |||
|---|---|---|---|---|
| = | (%) | (nb-1) | ||
| 1.70, 1.0, all, – | 1.21 | 81 | 37.4 7.1 (stat.) 10.1 (syst.) | |
| 1.45, 0.5, all, – | 1.31 | 81 | 49.1 10.8 13.3 | |
| 1.95, 0.5, all, – | 1.08 | 81 | 22.9 8.5 6.2 |
| , , , | ||||
|---|---|---|---|---|
| = | (%) | (nb-1) | [nb/(GeV/)2] | |
| 1.70, 1.0, 0.5, 1.0 | 1.40 | 81 | 2.81 1.04 (stat.) 0.76 (syst.) | |
| 1.70, 1.0, 1.5, 1.0 | 1.21 | 81 | 1.63 0.47 0.44 | |
| 1.70, 1.0, 2.5, 1.0 | 1.14 | 81 | 0.55 0.22 0.15 | |
| 1.70, 1.0, 4.0, 2.0 | 0.92 | 81 | 0.08 0.05 0.02 |
| Variables | Syst. errors (%) | |
| 10 | ||
| ( pol.) | 10 | |
| 11 | ||
| 10 | ||
| 10 | ||
| negligible | ||
| 3 | ||
| 15 | ||
| Total | 27 | |
4.1.1 Transverse momentum distribution
Transverse momentum () distribution for production cross-sections at low (), which dominates the sample obtained, is sensitive to the intrinsic parton transverse-momentum () as well as to initial momentum distribution of partons (mainly gluons), but not to the production mechanism much. With an increased yield especially at higher (), we can discuss discrimination between the production models based upon a shape. Here our data is compared with a phenomenological function which has been used to fit lower-energy results as well as a PYTHIA prediction based on the color-singlet model.
Figure 51 shows invariant (double-differential) cross sections for production as a function of . Error bars include statistical errors only. Lines show the function form
| (6) |
with different values of a parameter , which is related to the average () with by a numerical integration. All the lines are normalized to the data. This function form is consistent with our data with in the range 1.5 2.2 GeV/. It also fits the FNAL-E672/E706 data [39], shown in Fig. 52, and the FNAL-E789 data [37] at = 38.8 GeV well. The histograms in those figures show the PYTHIA distributions which are consistent with both the real data and the fits with appropriate parameters.777 The low- cut off for partonic subprocesses is deactivated (default = 1 GeV/). Contribution of -quark decays is neglected, since it is estimated to be small (1%) at = 200 GeV from other experiments and simulation, which will be described in Appendix A. The transverse momentum of a is sensitive to the rms of , , which is set to 1.5 GeV/ at = 200 GeV and 0.82 GeV/ at = 38.8 GeV to reproduce the real data as shown in Figs. 51 and 52. The result of will be discussed in the next section.
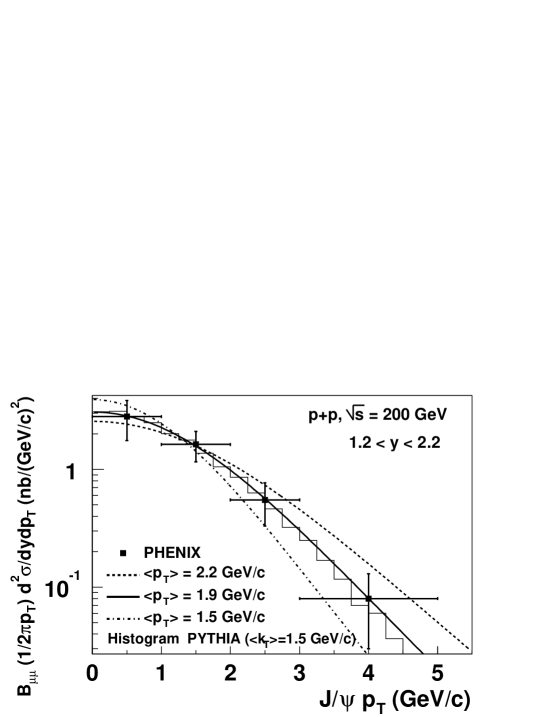
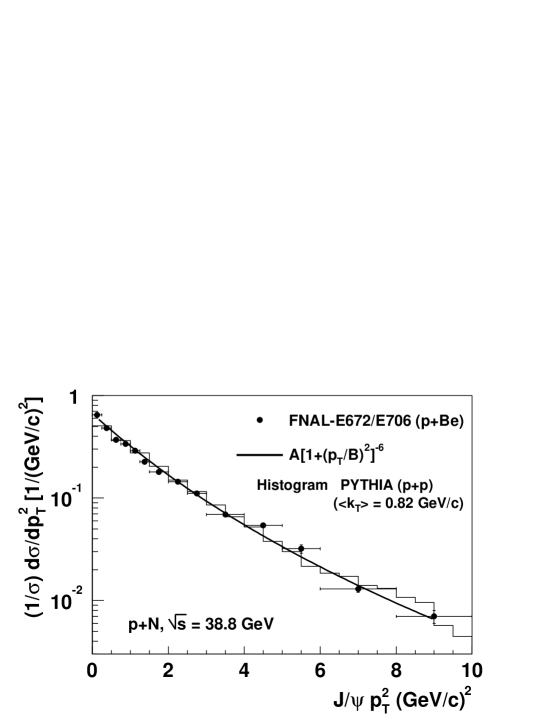
4.1.2 Rapidity distribution and gluon distribution
Since the gluon-fusion subprocess dominates at high energies, rapidity distribution for production cross-sections, , is sensitive to gluon distribution in the proton, where is a momentum fraction of a gluon (Bjorken-) and is a scale for the partonic interaction, which is in the order of (charm quark mass) for the case of production. Sensitive -region probed by our measurements is discussed, followed by the comparison of our data with some typical gluon distributions currently available.
For low- production (), is roughly proportional to the product of gluon distribution function where is Bjorken- of each gluon. They are related with (rapidity) of a by
where . The relation of and for production events,
| (7) |
is shown in Fig. 53 using PYTHIA and the GRV94LO PDFs with a scale = 1.45 GeV. The clear correlation is seen with a band which represents finite of ’s. The sensitive regions of are for ’s measured in the Central Arms and and measured in the Muon Arms, which are also shown in Fig. 54 together with some gluon distributions of some typical PDF sets with a scale = 1.45 GeV. Distributions of Feynman- () of lower-energy experiments, obtained as where is the -component of the momentum of a , are well reproduced by these gluon distributions. For example, the distribution of the FNAL-E705 experiment at = 23.8 GeV [32] is well reproduced by the GRV94LO PDFs as shown in Fig. 55. This agreement confirms that production is dominated by the fusion of gluons, whose distribution is reasonable in the corresponding -range, which is around covered also by the PHENIX Muon Arms as shown in Fig. 54. Another event generator, the RV generator [66], gives consistent distribution with PYTHIA, which confirms that distribution (or rapidity distribution at low ) depends on gluon density but not on the event generator with a specific production mechanism.
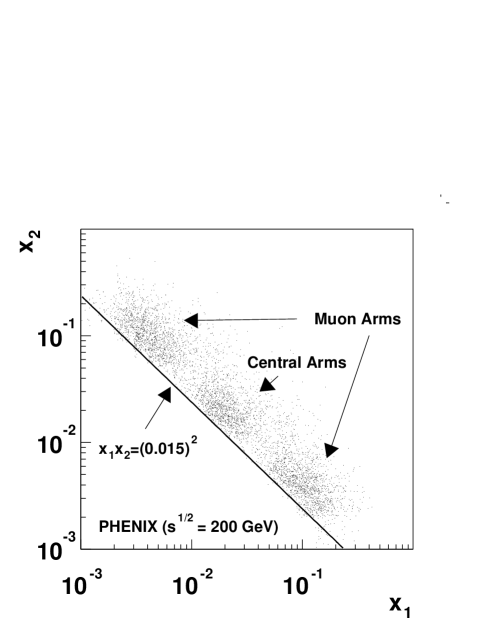
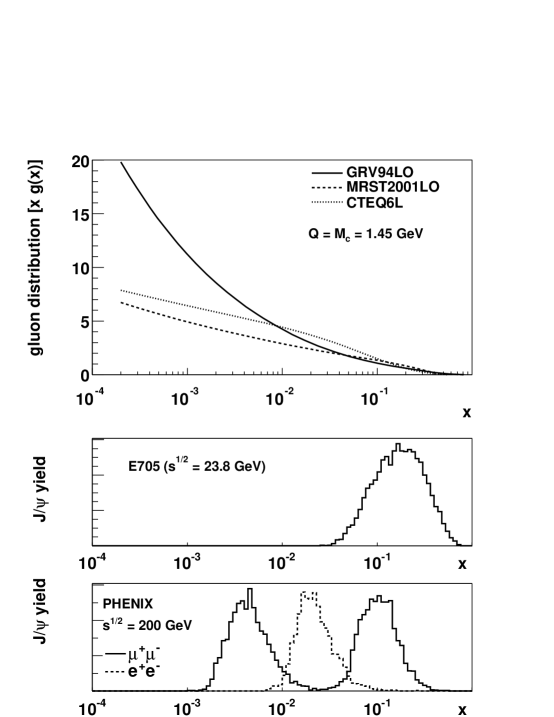
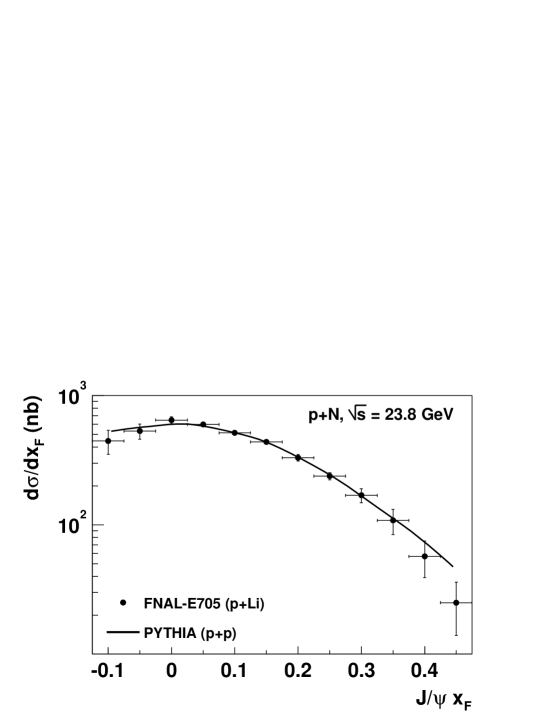
Using these PDFs, our rapidity distribution is well reproduced as shown in Fig. 56 including the result of the channel measured in the Central Arms ( nb) [52]. Two curves in the figure show PYTHIA predictions with the GRV94LO and CTEQ4M PDF sets fitted to the data, both of which are consistent with the results. Their difference is small compared to the errors of our measurement. Other PDF sets are also tried and fluctuation is found to be small (3%) in the determination of described next. This consistency confirms reasonable gluon density in the -region 0.2.
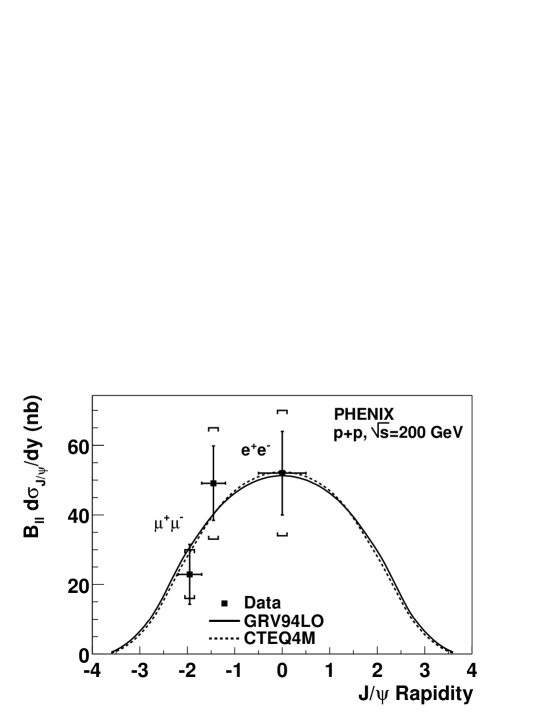
4.1.3 Total cross section and its comparison with lower-energy results
Assuming a PYTHIA rapidity distribution which reproduces our results well and the common branching fraction for the electron decay channel () and the muon decay channel (),
is obtained. Systematic error is obtained as the maximum plausible systematic spreads including both the electron and muon measurements. Using the average value of and 888 = 0.0593 0.0010 and = 0.0588 0.0010 [62] for , total production cross-section
is extracted.
Figure 57 shows dependence of together with predictions using gluon densities of three different PDF sets with a scale of . Lower-energy experimental results are summarized in Table 12. Our result of the total cross section is at the highest energy since higher energy ( 630 GeV) experimental data on ’s suffer from a cut ( 4 or 5 GeV/) as described in section 1. The increase in at higher can be explained by the increase in gluon density in lower -region according to the relation (7). For the absolute normalization for , color-octet matrix elements are used, whose uncertainties will be described later. Charm quark mass is adjusted to = 1.45 GeV/ or = 1.50 GeV/ depending on PDF sets to reproduce the normalization best. Parton distributions are sensitive to a scale . Figure 58 shows dependence of with different values of using the GRV94LO PDFs and = 1.45 GeV/. For higher , distribution is steeper since gluon density increases more in lower- than in higher- as increases. The experimental data prefer for this case. In spite of uncertainty from the choice of a PDF set and a scale, dependence of including our new result is consistent with gluon distribution in the proton.
| Target | (GeV) | (nb) | (GeV/) | Reference |
|---|---|---|---|---|
| p | 6.7 | — | [26] | |
| Be | 7.3 | — | [1] | |
| p | 8.6 | — | [27] | |
| Be | 11.5 | 22 6 | — | [28] |
| Be | 16.8 | 138 46 | 0.96 0.12 | [29] |
| p | 16.8 | 94 20 | — | [30] |
| p | 19.4 | 122 22 | 0.95 0.02 | [30] |
| C | 20.5 | 190 26 | 0.98 0.04 | [31] |
| Li | 23.8 | 162 22 | — | [32] |
| p | 24.3 | 144 19 | 1.1 0.2 | [34] |
| Be | 27.4 | 220 54 | — | [35] |
| p | 30 | — | 1.14 0.12 | [42] |
| Be | 31.5 | 322 70 | 1.08 0.05 | [36] |
| Be | 31.5 | — | 1.15 0.02 | [39] |
| Be | 38.8 | — | 1.22 0.01 | [39] |
| p | 52 | 700 320 | 1.0 0.2 | [40] |
| p | 53 | — | 1.39 0.05 | [42] |
| p | 63 | — | 1.29 0.05 | [42] |
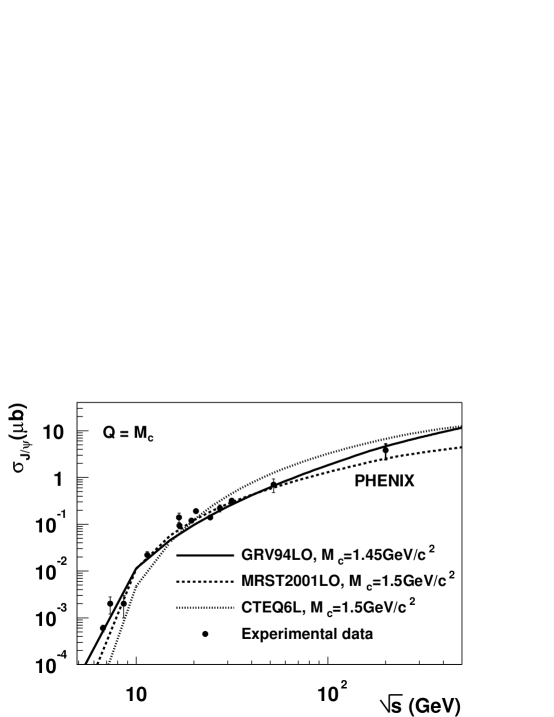
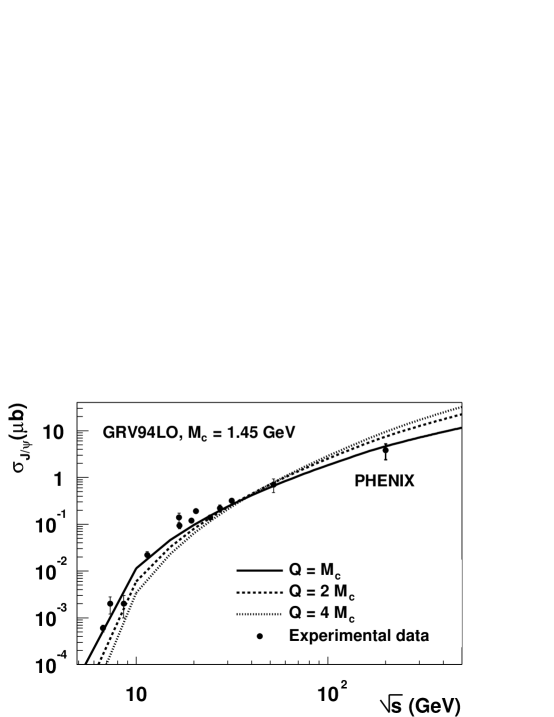
The absolute normalization for depends on the production models.
A consequence of the CEM is the constant ratio, that is and process independent, of to where is the total production cross section for mesons. It is determined from the photo-production data to be about 0.06 [14]. To normalize in hadro-production, the phenomenological -factors are used to account for higher order corrections. As a result, of hadro-production data are well reproduced including our measurement.
The CSM (color-singlet model) has been known to fail to describe the total cross sections at lower energies by a factor of about 20 [22]. Despite large theoretical uncertainties from the choice of scale parameters and charm quark mass, this large discrepancy can be hardly explained.
Color-octet contributions have been considered [22, 23, 24] in 2 1 subprocesses (dominantly ) which is the largest contribution to the low (or -integrated) yield. Cross section for the direct production with gluon-gluon fusion can be written as
where is the strong coupling as a function of a renormalization scale (). The color-octet matrix elements , each of which represents probability for a color-octet pair in a state to form a meson, have been extracted from experimental data [23]. There are also decays from the color-octet production of , but their contribution is neglected, since it is estimated to be small compared to the color-singlet production of [23]. Including this color-octet contribution to the direct production, total cross section agrees with the data as shown in Figs. 57 and 58 using reasonable charm quark mass and a renormalization scale . The uncertainty of from , which is not constrained well yet [62], has been studied by changing it by about 10% and variation of is found to be about a factor of two. The effect of the uncertainty of is also studied by making it double or half and changes by a factor of two to three. The normalization for with the COM is consistent with the experimental data within large theoretical uncertainties inherent in perturbative QCD.
4.2 Average
The average value of of ’s, is sensitive to the intrinsic parton transverse-momentum () as well as initial momentum distribution of partons (mainly gluons), but not to the production mechanism much. It is calculated as where each factor has been obtained in section 3.7. Table 13 summarizes their statistical and systematic errors. As a result,
is obtained with cuts GeV/ and . Correction factors on to extrapolate it to the entire kinematical region are estimated in the next, followed by the comparison of with lower-energy results.
| Statistical | 11% |
|---|---|
| Efficiency corrections | 5% |
| Momentum offset | 5% |
| Syst. total | 7% |
High- correction
Since the statistical limit of the data is 5 GeV/, the effect on from missing high- events is estimated assuming the function form (6) which fits the FNAL-E672/E706 data [39] (Fig. 52) the FNAL-E789 data [37] well. As a result, = 1.82 GeV/ and = 1.88 GeV/ are obtained. Therefore a correction factor from high- events is expected to be small (3%).
Other two empirical functions forms which have been used for other experiments,
| (8) |
and
| (9) |
are tried where and are fit parameters. Their fits to our data is shown in Fig. 59. For (8), slope is slightly harder than other functions but still consistent with our results. The correction factor of 11% is obtained. For (9), much smaller a correction factor, 0.04% is obtained. The reduced chi-squares for the fit of (8) to the FNAL-E789 data (/NDF = 6.6) is much worse than others (/NDF = 0.5 for (6) and 1.3 for (9)).
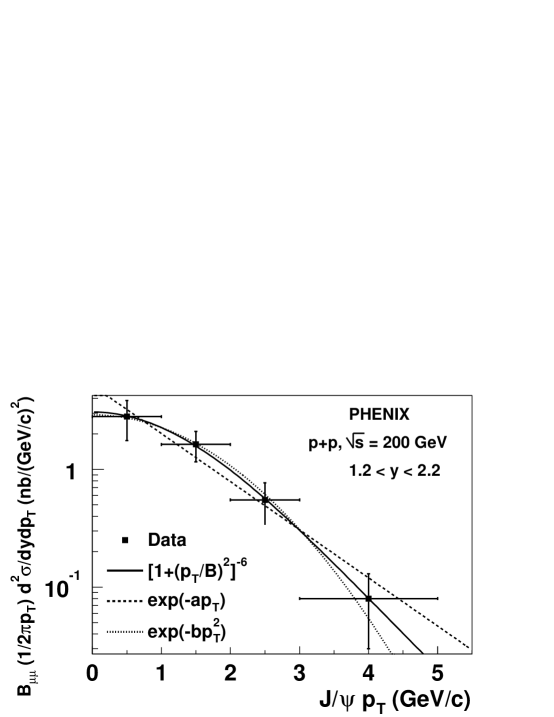
Consequently, high- correction ( 5 GeV/c) is expected to be small ( 3%) assuming the function form for the spectrum which fits our results as well as the FNAL-E789 and FNAL-E672/706 results at = 38.8 GeV with good chi-squares.
Rapidity correction
Figure 60 shows rapidity dependence of using PYTHIA with the GRV94LO PDFs and other parameters which reproduce and rapidity distributions of both lower energy experiments and our result as already shown. Using this dependence is found to be 0.99 which is close to unity.
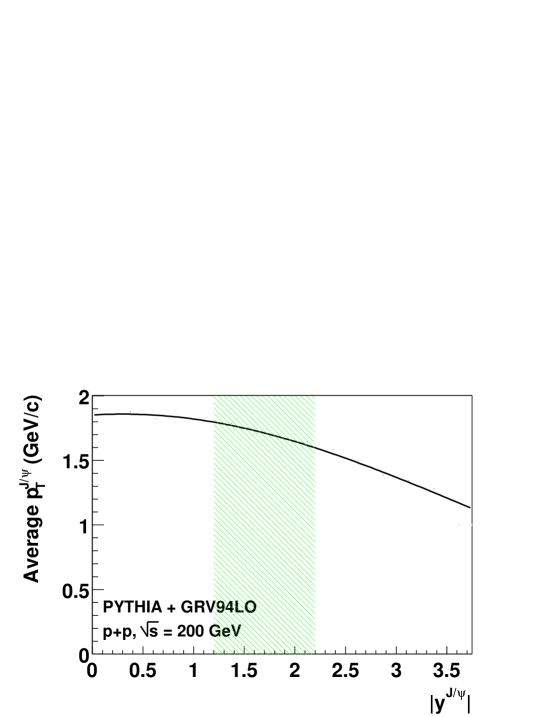
Comparison with lower energy results
At higher energies, more energetic partons participate in interactions, thus causing a slight increase in of ’s. Figure 61 shows dependence of including the results of PHENIX and the lower energy experiments summarized in Table 12. Neither high- correction nor rapidity correction is applied to the PHENIX data, which are estimated to be small, as well as the other experiments. Our result, at the highest energy, is slightly higher than the lower-energy results, which is consistent with the expectation. The experimental data are well fitted with a function with a good reduced chi-square (/NDF 1.1) as shown in the same figure, where and are fit parameters. On the other hand, another empirical form which fits the lower energy results well [36], does not fit including the PHENIX result, indicating it is applicable only in the limited range. Another curve in the figure shows the PYTHIA prediction with a fixed = 0.82 GeV/, which reproduces the spectrum of the FNAL-E672/E706 data at = 38.8 GeV as shown in Fig. 52. The PYTHIA prediction is consistent with our data, but slightly higher than the experimental results at lower energy ( 20 GeV), indicating increasing with [67, 68].
Such dependence has also been observed in of muon pairs from the Drell-Yan process, which suffers less theoretical uncertainties such as next-to-leading-order corrections thus has direct relation to [68]. Its magnitude is also consistent with that of at lower energies [37, 39, 69, 70]. This similarity supports that of can be understood by a perturbative-QCD based model (PYTHIA) with reasonable values.
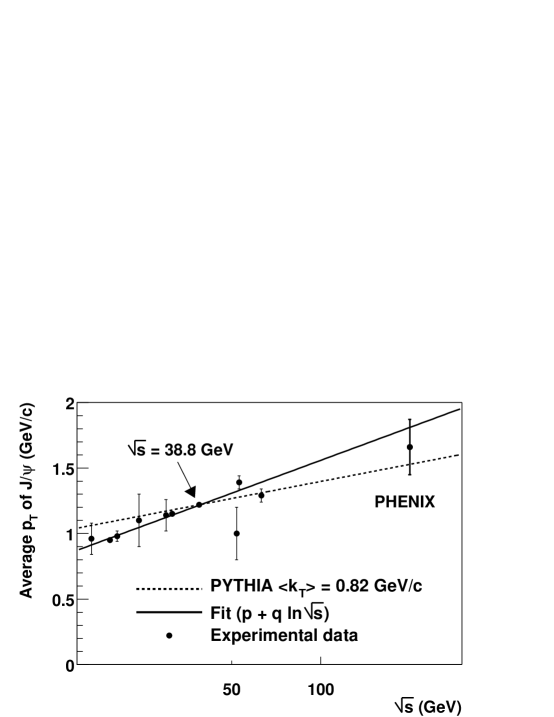
4.3 Future measurements
Our result on the total cross section for the production in = 200 GeV p+p collisions is consistent with both the color-evaporation model and color-octet model predictions. In this section, we will discuss future measurements expected at RHIC which will provide further critical tests for these models.
Polarization (Spin Alignment) of
One critical test for these models is measurement of polarization (or spin-alignment) of the . The CEM predicts zero-polarization due to multiple gluon emissions while the CSM and COM predict sizable polarization. All the lower energy experiments show zero-polarization () [43] which is consistent with the CEM prediction except at large ( with ). The CDF experiment measures polarization of ’s with 4 GeV/ [47]. Medium- ’s (4 12 GeV/) are transversely polarized ( 0) and consistent with the COM prediction. However, at high ( 12 GeV/), polarization decreases with unlike the COM prediction, causing a sizable discrepancy at the highest bin (15 20 GeV/).
Our measurement of at = 200 GeV will serve as another vital input for the production models. Since is obtained by fitting distribution to the form
sensitivity to higher is important for the measurement of , where represents the decay angle of a muon in the rest frame with respect to the momentum direction of the in the laboratory frame (Gottfried-Jackson frame).
Figure 62 shows the acceptance of the Muon Arms for ’s with 2 GeV/, as a function of . Our acceptance is sensitive up to 0.8. Acceptance for larger increases with of ’s, because the backward-going muon in the rest frame is boosted toward the detector in the laboratory frame.
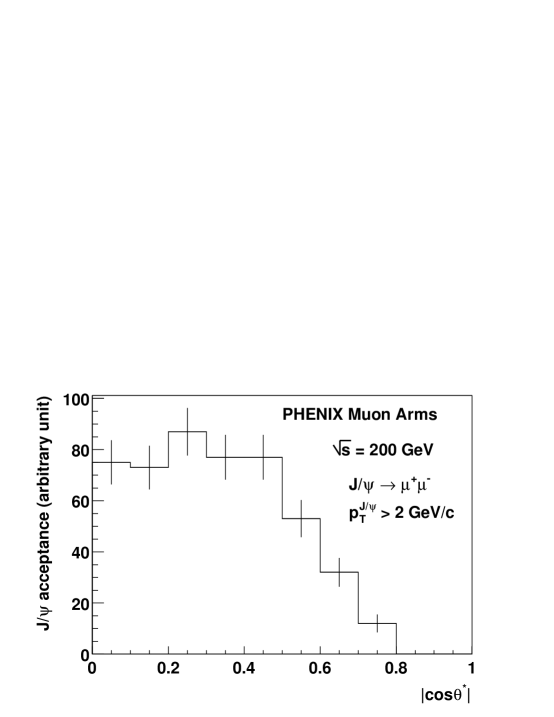
Polarized cross section for the production
In Run-2, RHIC has successfully accelerated transversely polarized protons up to 100 GeV/ momentum with about 20% polarization and collided them at = 200 GeV. Details of spin physics at RHIC will be found in [8].
In Run-3 longitudinally polarized p+p collisions with about 50% polarization are expected at RHIC. We plan to measure double-longitudinal spin asymmetries for production defined as
where stands for production cross-section when incident protons have the same (opposite) signs of helicities.
It is sensitive to polarized gluon density () in the proton where denotes density of gluons which are polarized in the same (opposite) direction as the proton helicity and can be written as
where and are momentum fractions of each gluon. The partonic asymmetry for the subprocess is calculated by each model in [71]:
| where | ||||
Calculation with the COM is for the subprocesses, which dominate the low- yield. The mere determination of the sign of can choose either the CSM or CEM. For the COM, is currently unknown and expected to be extracted from of photo-production data to be measured in polarized proton and electron collisions at the Electron Ion Collider (EIC) [72]. Using obtained from the unpolarized photo-production data [73], branching fractions [62] and the color-singlet matrix elements from the data of hadronic decays of states [74], with the color-octet model is expected to vary from 0.3 to 0.7 assuming two extreme cases, = 0 and = 0. For the color-octet subprocess, has also been calculated in [75] assuming a function form of found in [76], which is shown in Fig. 63 as a function of of ’s together with statistical sensitivities of PHENIX expected with one RHIC-year luminosity.999 In the enhanced mode. Also in this paper, 100% detection efficiency for ’s are assumed. Measurement of is motivated not only by the direct determination of polarized gluon distribution but also by another test for the production models for charmonia.
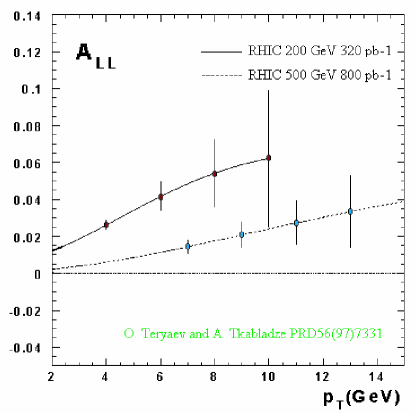
Table 14 shows the summary of model sensitivities of each observable measured at RHIC. Our measurement of prefers the CEM and COM rather than the CSM. Measurements of rapidity and low- distributions () do not have sensitivities to the models. Future measurements of the polarization of and will provide discrimination of the CEM from the COM.
| CSM | CEM | COM | comments | |
| done | ||||
| rapidity distribution | no sensitivity | done | ||
| no sensitivity | done | |||
| Polarization | 0 | needs high- events | ||
| vary | needs | |||
5 Conclusion
Measurements of mesons in p+p collisions at RHIC provide useful information on both the perturbative and non-perturbative aspects of QCD. They also play crucial roles in both QGP physics and spin physics expected at RHIC.
With the South Muon Arm in the PHENIX detector covering , particles have been successfully triggered by the simple trigger system and clearly identified with a small background via decays in the first p+p collisions at = 200 GeV. Total and differential cross sections for inclusive production have been obtained.
Transverse momentum distribution is consistent with the various function forms and PYTHIA which fit the other experimental data. Average transverse momentum = 1.66 0.18 (stat.) 0.12 (syst.) GeV/ is slightly higher than the lower energy results and consistent with the PYTHIA’s expectation with a reasonable value of .
Rapidity-differential cross section for inclusive production times the branching fraction to a pair = 37 7 (stat.) 11 (syst.) nb has been obtained. Including the measurement at mid rapidity ( 0.35) using the electron decay channel, rapidity distribution is found to be consistent with the gluon distribution function of some typical PDF sets in the Bjorken- range .
The total cross section = 3.8 0.6 (stat.) 1.3 (syst.) b has been extracted from the fit of the rapidity distribution, which is related with the lower energy results by a gluon distribution function with a reasonable scale. Proper normalization for is reproduced well by both the color-evaporation model and the color-octet model using reasonable gluon densities, scales and charm-quark mass.
Our results confirm the validity of the production mechanism of based on perturbative QCD. The further studies of the production mechanism, via measurements of such as the spin alignment of and , are clearly needed especially to understand the non-perturbative aspects involved in the production of . The results have also established the baseline necessary for the QGP search in Au+Au collisions as well as gluon polarization measurements in polarized p+p collisions at RHIC.
Appendix A Estimation of various contributions to the inclusive yield
mesons can be produced either directly or via decays from higher state charmonia ( and ) as well as from -quarks. Our measurement is inclusive and it is not possible to separate each contribution from others. We will estimate fractions of each contribution taking into account results of both higher and lower energy experiments.
-quarks
Contribution from -quark decays is energy-dependent. Production cross section for a pair times the branching fraction for a (or )-quark decaying into a meson in p (or )+N collisions has been measured in p+Au collisions at = 38.8 GeV by the FNAL-E789 experiment [38] and the result is 148 34 (stat.) 28 (syst.) pb/nucleon. It has been also measured in p+ collisions at = 630 GeV by the CERN-UA1 experiment [44] and 32.7 2.6 (stat.) 13.4 (syst.) nb has been obtained with 5 GeV/ and 2.0 cuts. The ratio of those results is consistent with a perturbative QCD prediction using PYTHIA. It is extrapolated to = 200 GeV and = 40 nb is obtained which is about 1% of our inclusive result.
Production cross sections for , or (2S) mesons, have been also measured by the FNAL-E789 [38] experiment. The relative production cross section times the branching fraction to a muon pair for a to that for a , = 0.018 0.001 (stat.) 0.002 (syst.) has been obtained. This ’ fraction can contribute to our measurement because of the poor mass-resolution (200 to 300 MeV/) currently observed. Using the branching fractions and % [62], is determined to be 0.15 0.03. Contribution of to inclusive yield is therefore expected to 15% 0.55 () 8%. The color evaporation model expects energy and process independence of the fractions of and to the inclusive yield. Slightly higher or consistent values have been obtained by the UA1 ( = 0.029 0.010 (stat.) 0.007 (syst.) with 5 GeV/ and 2.0 cuts) [44] and CDF ( = 0.033 0.002 (stat.) (syst.) nb with 5 GeV/ and 0.6 cuts) [45] experiments.
The fraction of the inclusive yield from radiative decays has been determined to be (30 4) % by the FNAL-E705 experiment in p+Li collisions at = 23.8 GeV [33]. A consistent value, (29.7 1.7 (stat.) 5.7 (syst.))% was obtained in p+ collisions at = 1.8 TeV by the CDF experiment at Fermilab [46].
In summary, the fractions of -quark, ’ and contributions to inclusive yield at RHIC energy are expected to be 1%, 10-15% and 30% respectively. The remains are ascribed to the direct production. The fractions of and contributions do not agree with the color-singlet model prediction. Including color-octet contributions, they are successfully explained [23]. The color-evaporation model can not predict their fractions. However, small dependence of them in nucleon-nucleon collisions is consistent with its assumption that they are process-independent.
Acknowledgment
First of all, I would like to thank Prof. K. Imai for being my supervisor. Prof. N. Saito initiated my interest in spin physics and provided me a lot of scientific advice throughout my research at RHIC.
I wish to thank staff of the Collider-Accelerator Department (C-AD) at Brookhaven National Laboratory (BNL) for making the experiment possible. In particular, help of Dr. A. Drees was crucial to understand the beam-related background for the muon trigger.
The measurement of would not have been carried out without coherent work of each collaborator of the PHENIX experiment. I would like to give special thanks to members of the Muon detector group, BBC detector group, and online and offline groups. For the analysis, discussions with Dr. V. Cianciolo and J. Nagle were helpful. I am grateful to Dr. Y. Akiba for providing details of the electron channel measurement. I wish thank Dr. E. M. Gregores for affording me the prediction of the color-evaporation model.
I am indebted to RIKEN and RIKEN BNL Research Center (RBRC) staff for supporting my life at BNL, especially to the former and current chiefs of the RIKEN Radiation Laboratory, Prof. M. Ishihara and Dr. H. En’yo. The latter was also my supervisor and gave me a great deal of advice and encouragement. A large number of discussions with scientific staff of RIKEN and RBRC were useful for this work and spin physics including Dr. G. Bunce, M. G. Perdekamp, B. Fox, Y. Goto and A. Taketani.
My research was partially supported by the RIKEN Junior Research Associate program (FY 1998-2000) and JSPS Research Fellowship for Young Scientists (FY 2001-2002).
Appendix B Attached figures’ captions
-
•
figure 1: The RHIC accelerator complex.
figure 2: The PHENIX experiment overview.
figure 3: Magnetic field lines inside the Central and Muon Magnets.
figure 4: A photograph of a Beam-Beam Counter (BBC). Dimensions are 29 cm in outer-diameter and 25 cm in length.
figure 5: A schematic view of a Muon Arm. It consists of a conical magnet (Muon Magnet) with tracking chambers inside at three stations (Muon Tracker, or MuTr) and an array of chamber planes interleaved with absorbers (Muon Identifier, or MuID).
figure 6: Cross section of a MuTr station. One MuTr station consists of two or three gaps, each of which has one anode-wire and two cathode-strip planes.
figure 7: Octant and half-octant structures of a MuTr gap. The beam line passes at the center of this figure. The bold lines show the boundaries for octants and this lines for half-octants. Octant and half-octant numbers are also shown. For the South Arm, the left-hand side in the figure (octant-5 side) corresponds to the east direction.
figure 8: A photograph of a MuTr station-2 octant. A cathode plane is made of etched 25-m copper coated mylar foils.
figure 9: Directions of cathode strips and anode wires in station-1, octant-2, half-octant-0 planes. Bold lines show cathode strips in non-stereo-angle planes. Dotted lines show cathode strips in stereo-angle planes with angles shown in Table 4. Angles in the figure are not exact.
figure 10: The optical alignment system in which light from an optical fiber is projected from station 1 through station 2 to a CCD mounted on station 3. The relative chamber positions are monitored to 25 m.
figure 11: A schematic diagram for the MuTr Front-End Electronics (FEE). Raw chamber signals are continuously amplified with CPAs (Charge Pre-Amps) and stored in AMUs (Analog Memory Units). Upon receipt of a level-1 trigger bit from a GTM (Granule Timing Module), stored samples from all channels are digitized by ADCs (Analog to Digital Converters) and the results are sent to a DCM (Data Collection Module.
figure 12: Measurement of position resolution obtained in cosmic-ray tests of a station-2 octant. The composite chamber plus projection error (position resolution for a track obtained with the other five planes) was about 131 m, consistent with the 100 m specification for the chambers and readout alone.
Figure 13: Setup for the MuID beam test carried out at KEK-PS. Four scintillation counters (ST1 to ST4) define the beam. Three gaseous erenkov counters (GC1 to GC3) identify pions and muons.
Figure 14: Pion mis-identification rate as a function of pion momentum for both the South and North Muon Arms obtained with the beam test at KEK. The solid (dotted) lines show simulation results including (excluding) decays.
Figure 15: Schematic diagram of the MuID NIM-logic trigger. Each “Quadrant” MLU takes 16 (4 for each gap) output signals from the MuID FEE (Front-End Electronics). The “Decision” MLU takes output signals of all the “shallow” and “deep” quadrant MLUs and generates final trigger bits, which are 1S (single shallow), 2S (double shallow), 1D (single deep), 1D1S (deep-shallow) and 2D (double deep), as PHENIX Global-Level-1 input.
figure 16: An accepted-pattern example of the MuID NIM-logic trigger. Capital letters represent positions of each segment. Gap 2 was not used because of the limitation of input channels of the trigger logic.
Figure 17: The integrated luminosity RHIC has delivered to the PHENIX and STAR experiments as a function of day starting from December 21, 2001.
Figure 18; BBC efficiency for p+p events as a function of of measured in the Central Arms ( 0.35) [64].
References
- [1] J. J. Aubert et al., Phys. Rev. Lett. 33, 1404 (1974).
- [2] J. E. Augustin et al., Phys. Rev. Lett. 33, 1406 (1974).
- [3] R. Vogt, Phys. Rept. 310, 197 (1999).
- [4] T. Matsui and H. Satz, Phys. Lett. B178, 416 (1986).
- [5] R.L. Thews et al., Phys. Rev. C63, 054905 (2001).
- [6] M. J. Alguard et al., Phys. Rev. Lett. 37, 1258 (1976), M. J. Alguard et al., Phys. Lett. B206, 364 (1988), B. Adeva et al., Phys. Lett. B320, 400 (1994), D. Adams et al., Phys. Lett. B329, 399 (1994), Phys. Lett. B336, 125 (1994) and Phys. Lett. B357, 248 (1995), P. L. Anthony et al., Phys. Rev. Lett. 71, 959 (1993).
- [7] Ya. S. Derbenev and A. M. Kondratenko, Part. Accel. 8, 115 (1978).
- [8] For example, N. Saito et al., Nucl. Phys. Proc. Suppl. 105, 47 (2002).
- [9] FNAL-E704 experiment. For example, D. L. Adams et al., Phys. Lett. B261, 197 (1991).
- [10] For example, Y. Goto et al., Nucl. Phys. Proc. Suppl 79, 588 (1999).
- [11] J.C. Collins and D.E. Soper, Ann. Rev. Nucl. Part. Sci. 37, 383 (1987).
- [12] F. Halzen, Phys. Lett. B69, 105 (1977).
- [13] H. Fritzsch, Phys. Lett. B67, 217 (1977).
- [14] J. F. Amundson et al., Phys. Lett. B390, 323 (1997).
- [15] R. Baier and R. Ruc̈kl, Z. Phys. C19, 251 (1983).
- [16] G. A. Shuler, CERN-TH-7170-94, unpublished.
- [17] G. Bodwin, E. Braaten, and G. Lepage, Phys. Rev. D51, 1125 (1995).
- [18] G. T. Bodwin, E. Braaten and G. P. Lepage, Phys. Rev. D51, 1125 (1995).
- [19] P. Cho and A. K. Leivovich, Phys. Rev. D53, 6203 (1996).
- [20] H. Cano-Coloma and M. A. Sanchis-Lazano, Nucl. Phys. B508, 753 (1997).
- [21] T. Sakuma, Master Thesis (in Japanese), Tokyo Institute of Technology, January, 1999.
- [22] S. Gupta and K. Sridhar, Phys. Rev. D54, 5545 (1996).
- [23] M. Beneke and I. Z. Rothstein, Phys. Rev. D54, 2005 (1996).
- [24] W.-K. Tang and M. Vänttinen, Phys. Rev. D54, 4349 (1996).
- [25] S. C. C. Ting, Proc. Int. Symp. on Lepton and Photon Int. at High Energies, Stanford University, Stanford, USA (1975) p.155.
- [26] A. Bamberger et al., Nucl. Phys. B134, 1 (1978).
- [27] M.J. Corden et al., Phys. Lett. B98, 220 (1981).
- [28] Yu. M. Antipov et al., Phys. Lett. B60, 309 (1976).
- [29] K. J. Anderson et al., Phys. Rev. Lett. 37, 799 (1976).
- [30] J. Badier et al., Z. Phys. C20, 101 (1983).
- [31] K.J. Anderson et al., Phys. Rev. Lett. 42, 944 (1979).
- [32] L. Antoniazzi et al., Phys. Rev. D46, 4828 (1992).
- [33] L. Antoniazzi et al., Phys. Rev. Lett. 70, 383 (1993).
- [34] C. Morel et al., Phys. Lett. B252, 505 (1990).
- [35] H. D. Snyder et al., Phys. Rev. Lett. 36, 1415 (1976).
- [36] V. Abramov et al. FERMILAB-PUB-91/62-E (Unpublished).
- [37] M. H. Schub et al., Phys. Rev. D52, 1307 (1995), D53, 570 (1996).
- [38] D. M. Jansen et al., Phys. Rev. Lett. 74, 3118 (1995).
- [39] A. Gribushin et al., Phys. Rev. D62, 012001 (2000).
- [40] E. Nagy et al., Phys. Lett. B60, 96 (1975).
- [41] J. H. Cobb et al., Phys. Lett. B68, 101 (1977).
- [42] C. Kourkoumelis et al., Phys. Lett. B91,481 (1980).
- [43] T.-H. Chang, Ph.D Thesis, New Mexico State University, July 1999, C. Akerlof et al., Phys. Rev. D48, 5067 (1993), A. Gribushin et al., Phys. Rev. D53, 4723 (1996), T. Alexopoulos et al., Phys. Rev. D55, 3927 (1997), C. Biino et al., Phys. Rev. Lett. 58, 2523 (1987).
- [44] C. Albajar et al., Phys. Lett. B256, 112 (1991).
- [45] F. Abe et al., Phys. Rev. Lett. 69, 3704 (1992), Phys. Rev. Lett. 79, 572 (1997).
- [46] F. Abe et al., Phys. Rev. Lett. 79, 578 (1997).
- [47] T. Affolder et al., Phys. Rev. Lett. 85, 2886 (2000).
- [48] S. Abachi et al., Phys. Lett. B370, 239 (1996), B. Abbott et al., Phys. Rev. Lett. 82, 35 (1999).
- [49] J. T. Mitchell et al., Nucl. Instr. Meth. A482, 498 (2002).
- [50] T. C. Awes et al., Submitted to Nucl. Instr. Meth. February 2002.
- [51] J. Burward-Hoy, Ph.D Thesis, SUNY Stony Brook, December 2001.
- [52] J. Nagle et al., The XVI International Conference on Ultrarelativistic Nucleus-Nucleus Collisions (Quark Matter 2002), to be published in Nucl. Phys. A, NUCL-EX/0209016.
- [53] C. Adler, A. Denisov, E. Garcia, M. Murray, H. Strobele and S. White, Nucl. Instr. Meth. A461, 337 (2001).
- [54] K. Ikematsu et al., Nucl. Instr. Meth. A411, 238 (1998).
- [55] B. Fox, private communication.
- [56] H. Akikawa et al., to be submitted to Nucl. Instr. Meth. A.
- [57] H. Sato (H. D. Sato), Master Thesis (in Japanese), Kyoto University, February, 1998.
- [58] GEANT User’s Guide, 3.15, CERN Program Library.
- [59] E. Mathieson, Nucl. Instr. Meth. A270, 602 (1988).
- [60] R. Kalman, Trans. ASME D82, 35 (1960), P. Billoir, Nucl. Instr. Meth. 225, 352 (1984), P. Billoir, R. Fruhwirth and M. Regler, Nucl. Instr. Meth A241, 115 (1985), P. Billoir and S. Qian, Nucl. Instr. Meth. A294, 219 (1990), P. Billoir and S. Qian, Nucl. Instr. Meth. A295, 492 (1990), D. Stampfer, M. Regler and R. Fruhwirth, Comput. Phys. Commun. 79, 157 (1994), M. Regler, R. Fruhwirth and W. Mitaroff, J. Phys. G G22, 521 (1996).
- [61] T. Sjöstrand, Comp. Phys. Comm. 82, 74 (1994).
- [62] K. Hagiwara et al., Phys. Rev. D66, 010001 (2002).
- [63] C. Albajar et al., Nucl. Phys. B335, 261 (1990).
- [64] H. Torii et al. (PHENIX Collaboration), NUCL-EX/0210005, to be published in Nucl. Phys. A.
- [65] G. J. Alner et al., Z. Phys. C33, 1 (1986).
- [66] R. V. Gavai et al., Int. J. Mod. Phys. A10, 2999 (1995).
- [67] H.-L. Lai and H.-n. Li, Phys. Rev. D58, 114020 (1998).
- [68] B. Cox and P.K.Malhotra, Phys. Rev. D29, 63 (1984).
- [69] W.J. Metcalf et al., Phys. Lett. B91, 275 (1980).
- [70] A. S. Ito et al., Phys. Rev. Lett. 47, 12 (1981).
- [71] S. Gupta and P. Mathews, Phys. Rev. D55, 7144 (1997).
- [72] A. L. Deshpande, Nucl. Phys. Proc. Suppl. 105, 178 (2002).
- [73] M. Cacciari and M. Krämer, Phys. Rev. Lett. 76, 4128 (1996).
- [74] M. Mangano and A. Petrelli, Phys. Lett. B352, 445 (1996).
- [75] O. Teryaev and A. Tkabladze, Phys. Rev. D56, 7331 (1997).
- [76] T. Gehrmann and W.J. Stirling, Phys. Rev. D53, 6100 (1996).