hep-ph/0305185
The synergy of the golden and silver channels at the
Neutrino Factory
D. Autieroa, G. De Lellisb, A. Doninic, M. Komatsud, D. Melonie, P. Migliozzif, R. Pettig, L. Scotto Lavinab and F. Terranovah
a IPN Lyon, F-69622, Villeurbanne (Lyon), France
b Dip. Fisica, Università di Napoli“Federico II” and I.N.F.N., I-80126, Napoli, Italy
c I.F.T. and Dep. Física Teórica, U.A.M., E-28049, Madrid, Spain
d Nagoya University, Nagoya 464-8602, Japan
e Dep. Física Teórica y del Cosmos, Univ. Granada, E-18002, Granada, Spain
f I.N.F.N., Sezione di Napoli, I-80126, Napoli, Italy
g C.E.R.N., CH-1211, Geneva, Switzerland
h I.N.F.N., Laboratori Nazionali Frascati, I-00044, Frascati (Rome), Italy
Abstract
We deepen the study of the so-called “silver channel” [1] and of its relevance to solve some of the ambiguities that can arise in the simultaneous measurement of at the Neutrino Factory by presenting in full detail the characteristics of the considered OPERA-like detector and the experimental treatment of the different backgrounds and signals. Furthermore, we perform a detailed study of the systematic errors associated both with the OPERA-like and the magnetized-iron detectors and their effects on the sensitivity. Finally, we also apply a refined statistical analysis of the simulated events based on the frequentist approach.
1 Introduction
The hypothesis of neutrino oscillations [2] is at present strongly supported by atmospheric, solar, accelerator [3] and reactor [4] neutrino data. If we do not consider the claimed evidence for oscillations at the LSND experiment [5], that must be confirmed or excluded by the ongoing MiniBooNE experiment [6], oscillations in the leptonic sector can be easily accommodated in the three family Pontecorvo-Maki-Nakagawa-Sakata (PMNS) mixing matrix :
| (10) |
with the short-form notation . Further Majorana phases have not been introduced, since oscillation experiments are only sensitive to the two neutrino mass differences and to the four parameters in the mixing matrix of eq. (10): three angles and the Dirac CP-violating phase, .
In particular, data from atmospheric neutrinos and from K2K are interpreted as oscillations of into with a mass gap that we denote by . The corresponding mixing angle is close to maximal, , and is in the range to eV2 [7]. On the other hand, the longstanding solar neutrino problem has finally been solved by the combination of the SNO data [8] and recent KamLand results [4], isolating the LMA-MSW region [9] as the only viable solution of the solar neutrino deficit with oscillations into active () neutrino states. Two allowed regions are identified inside the LMA-MSW solution [10], corresponding to eV2 (LMA-I) and eV2 (LMA-II). For both solutions the corresponding mixing angle () is large (albeit maximal mixing is excluded at ). Finally, a comprehensive three-family analysis (including the negative CHOOZ results [11]) put a bound on , .
The planned long baseline experiments [12]-[15] will improve the measurement of () and of and measure or increase the bound on [16, 17] (see also [18]). This new generation of experiments, however, is only the first step toward the ambitious goal of precision measurements of the whole three-neutrino mixing parameter space, including the leptonic CP-violating phase . This long-lasting experimental program consists of the development of some “superbeam” facilities (whose combination can strongly improve our knowledge on , see [19]) and, eventually, of a “Neutrino Factory” (high-energy muons decaying in the straight section of a storage ring, thus producing a very pure and intense two-flavor neutrino beam [20, 21]). One of the main goals of the Neutrino Factory program (see for example [22, 23] and refs. therein) would be the discovery of leptonic CP violation and, possibly, its study [24]-[27].
The most sensitive method to study this topic is the measure of the transition probability . This is what is called the “golden measurement at the Neutrino Factory” [27]. At the Neutrino Factory an energetic electron neutrino beam is produced with no contamination from muon neutrinos with the same helicity (only muon neutrinos of opposite helicity are present in the beam, contrary to the case of conventional beams from pion decay). Therefore, the transition of interest can be easily measured by searching for wrong-sign muons, i.e. muons with charge opposite to that of the parent muons in the storage ring, provided the considered detector has a good muon charge identification capability. However, the determination of () at the Neutrino Factory is not at all free of ambiguities, much as it was the case for the different solutions to the solar neutrino problem before KamLand. In [28] it was shown that, for a given physical input parameter pair (), measuring the oscillation probability for and will generally result in two allowed regions of the parameter space. The first one contains the physical input parameter pair and the second, the “intrinsic ambiguity”, is located elsewhere. Worse than that, new degeneracies have later been noticed [29, 30], resulting from our ignorance of the sign of the squared mass difference and from the approximate symmetry for the atmospheric angle. In general, for each physical input pair the measure of and will result in eight allowed regions of the parameter space (if the sign of and the - octant will still be unknown by the time the Neutrino Factory will be operational) [30].
Different proposals have been suggested to deal with the three ambiguities. The sign of could for example be determined by combining two of the planned superbeam facilities, one of them with sufficiently long baseline while the second one with good sensitivity [31]. The -octant could be determined by combining one of these superbeam facilities (e.g. JHF-I) with a reactor-driven detector [32] (although in this case systematics could represent a serious issue). Finally, the intrinsic ambiguity can be solved by fitting at two different baselines at the same time [28]; or by increasing the energy resolution of the detector [33]-[36]. In [37] a detailed study of the combination of a superbeam and of a (single-baseline) Neutrino Factory was presented, showing that this combination is extremely helpful in solving ambiguities whenever a 1 Mton superbeam-driven water Cerenkov detector is added to the Neutrino Factory-driven 40 Kton magnetized iron detector (MID) that was considered in previous studies [38].
In all of these proposals only the “golden channel” (, or in the case of superbeams), with different detectors and neutrino sources, was considered. However, in [1] it was noticed that muons proceeding from decay when ’s are produced via a transition show a different correlation from those coming from . By using a lead-emulsion detector based on the Emulsion Cloud Chamber (ECC) technique, capable of the -decay vertex recognition, it is therefore possible to use the complementarity of the information from and from to solve the intrinsic () ambiguity. The lesser statistical significance of the former111Due to the mass of the ECC detector, to the CC cross-section, to the factor and to the need for the vertex identification, which results in a smaller total efficiency. with respect to the latter (the “golden” muons), inspired the nickname of “silver channel” and consequently of “silver” muons. Silver muons, in combination with golden muons, could also be extremely helpful in dealing with the ambiguity, since the leading term in is proportional to , whereas the analogous term in is proportional to . However, the sensitivity of the silver/golden channel combination to the -octant strongly depends on the value of . A detailed study of this combination to solve the -octant ambiguity is currently underway (see [39]). In this paper, as in [1], we restrict ourselves to the () ambiguity, by fixing and by choosing a given sign for (in the hypothesis that more information on the three neutrino spectrum will be available by the time the Neutrino Factory will be operational). Clearly, solving the three ambiguities at the same time will need the combination of different measurements.
In [1], a preliminary analysis of the foreseeable backgrounds in the measurement of transitions was used to substantiate the proposal with a realistic simulation of the detector based on [13, 40]. The aim of this paper is to present a dedicated analysis to measure the “silver” muon signal at an OPERA-like lead-emulsion detector. Furthermore, a detailed study of the systematic errors associated to both ECC and MID is also presented. In particular, it is shown that, by including a realistic systematic error in the analysis of the golden channel, its performance in determining the () value is considerably worsened if compared to the ones reported in [38]. A refined statistical analysis of “silver” and “golden” muons is also included, in order to optimally deal with very low statistics signals but with a very high signal-to-noise ratio. We consider in this analysis two possible combinations of detectors and baselines:
-
•
An ECC at km and a MID at km
(same combination considered in [1]); -
•
An ECC at km and a MID at km .
Our conclusion is that the combination of “golden” and “silver” channel at the Neutrino Factory can indeed solve the intrinsic ambiguity problem for , thus confirming the results of [1]. For we are on the edge of the experimental sensitivity of the silver channel with both configurations. However, given the lower expected background, we find that the second configuration (both detectors at 3000 km) allows a reduction in the size of the confidence interval for .
The paper is organized as follows: in Sect. 2 we introduce the “golden” and “silver channels” at the Neutrino Factory and we show how a combination of these two signals could solve the intrinsic ambiguity ; in Sect. 3 we recall the neutrino fluxes, the cross-sections and finally report the expected number of events for each channel; in Sect. 4 the characteristics of a lead-emulsion OPERA-like detector are depicted; in Sect. 5 we discuss in full detail the “silver muons” signal and the different sources of background at an ECC detector; in Sect. 6 we give an estimate of the required scanning load; in Sect. 7 we perform a refined analysis of low statistics signals with a very good S/N within the Feldman-Cousins [41] approach; in Sect. 8 we eventually draw our conclusions.
2 The Golden and the Silver Channel
Following eq. (1) of [28], we get for the transition probability () and () at second order in perturbation theory in , , and (see also [42]-[44]),
| (11) |
and
| (12) |
where refers to neutrinos and anti neutrinos, respectively. The coefficients of the two equations are:
| (13) |
with (expressed in eV2/GeV) and (with referring to neutrinos and anti-neutrinos, respectively). Finally, and .
The parameters and are the physical parameters that must be reconstructed by fitting the experimental data with the theoretical formula for oscillations in matter. In what follows, the other parameters have been considered as fixed quantities, supposed to be known with good precision by the time when the Neutrino Factory will be operational. In particular,
-
1.
in the solar sector we fixed and eV2 (same as in [1]). Although these values do not correspond to the present best-fit value from the combined analysis of the solar and KamLand data [10], they have been chosen to make direct comparison with our previous results. Furthermore, notice that the squared mass difference lies in between the two allowed solutions LMA-I with eV2 and LMA-II with eV2 [4].
- 2.
Finally, we also considered a fixed value for the matter parameter, eV2/GeV (this value, obtained by using the average matter density alongside the path for the chosen distance computed with the Preliminary Earth Model [45], is a good approximation for the case under consideration of km). For simplicity, we have not included errors on these parameters222 It has been shown in [28] that the inclusion of the foreseeable uncertainties on these parameters does not modify the results on the and measurements in a significant way..
Eqs. (11) and (12) lead to two equiprobability curves in the () plane for neutrinos and anti-neutrinos of a given energy:
| (14) | |||
| (15) |
Notice that and differ from the corresponding coefficients for the transition for the exchange, only (and thus for we have ). The term is identical for the two channels, but it appears with an opposite sign. This sign difference in the -term is crucial, as it determines a different shape in the plane for the two sets of equiprobability curves.
In Fig. 1, we superimposed the equiprobability curves for the and oscillations at a fixed distance, km, with input parameters and , for different values of the energy, GeV. The effect of the different sign in front of the -term in eqs. (11) and (12) can be seen in the opposite shape in the () plane of the curves with respect to the ones. Notice that both families of curves meet in the “physical” point, , , and any given couple of curves belonging to the same family intersect in a second point that lies in a restricted area of the () plane, the specific location of this region depending on the input parameters () and on the neutrino energy. Using a single set of experimental data (e.g. the golden muons), a analysis will therefore identify two allowed regions: the “physical” one (around the physical value, ) and a “clone” solution, spanning all the area where a second intersection between any two curves occurs. This is the source of the intrinsic ambiguity pointed out in [28]. When considering at the same time experimental data coming from both the golden and the silver muons, however, we see that the clone regions for each set of data lie well apart. Thus, a comprehensive analysis of the data will in principle result in the low- region around the physical pair, only. Of course, this statement is only true if the statistical significance of both sets of experimental data is sufficiently high.
3 Expected rates at the Neutrino Factory
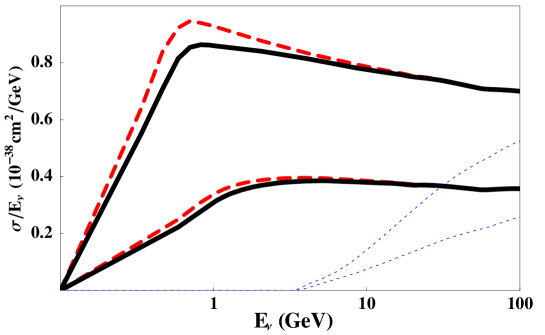
To get the expected number of events per bin, we must now convolute the neutrino fluxes at the Neutrino Factory with the charged-current (CC) cross-section and with the transition probability in eqs. (11) and (12). At low energies the neutrino scattering cross-section is dominated by quasi-elastic scattering and resonance production (see [46, 47] and references therein). However, if is greater than GeV, which is the case for high-energy muons in the storage ring (30-50 GeV), the total cross-section is dominated by deep inelastic scattering (DIS) and can be approximately described with the cross-section on an isoscalar target [48] :
Eq. (LABEL:isoscalar) is not a good description of the DIS cross-section for interactions in the considered range of energies, since the lepton mass cannot be neglected. Taking into account these effects, the total cross-section for the interactions appears as in Fig. 2, where we show its behaviour as a function of the neutrino energy.
The theoretical number of expected charged-current events (with production of final leptons ) in the detector, for a fixed parent muon energy , is:
| (17) |
where is the detector mass in Kton and is the number of nucleons per Kton.
In Tab. 1 we report the neutrino and anti-neutrino charged-currents interaction rates assuming no oscillation for two different baselines (namely = 732 and 3000 km) for an ideal (i.e. with perfect efficiency) detector with a mass of 1 Kton. We consider three different muon polarization values =0, (the ”natural” polarization) and . The neutrino beam results from the decay of ’s and ’s per year in a straight section of an GeV muon accumulator, with five operational years for each polarity. Fluxes have been integrated in the forward direction with an angular divergence (taken to be constant) mr. Beam divergence effects and QED one-loop radiative corrections to the neutrino fluxes have been taken into account in [50]. The overall correction to the neutrino flux has been shown to be very small, .
The situation in the hypothesis of neutrino oscillations at the same baselines is given in Tabs. 2 and 3. The considered PMNS matrix parameters are: , eV2; , eV2; and .
| GeV | |||||
| L (km) | |||||
| 732 | |||||
| 3000 | |||||
| 172 | 75 | 107 | 186 | 80.7 | 89.9 | |
| 150 | 97.5 | 140 | 174 | 105 | 81.7 | |
| 97.5 | 150 | 215 | 147 | 161 | 64.6 | |
| 87.4 | 148 | 244 | 99 | 151 | 45.2 | |
| 76.1 | 192 | 317 | 93.4 | 196 | 41.5 | |
| 49.5 | 295 | 487 | 79.3 | 302 | 32.8 |
| 92.2 | 44.6 | 48.7 | 154 | 51.5 | 83.3 | |
| 79.6 | 58 | 63.2 | 143 | 67 | 76 | |
| 50.2 | 89.2 | 97.3 | 120 | 103 | 59 | |
| 46.8 | 87.5 | 245 | 63.2 | 126 | 42.4 | |
| 40.5 | 114 | 319 | 58.4 | 164 | 38.7 | |
| 25.6 | 175 | 491 | 47 | 252 | 30 |
4 Detector issues
In this Section we discuss the basic performance of an OPERA-like detector at the Neutrino Factory in reconstructing neutrino interactions. In doing so, we profit of the experience and of the test results gathered within the OPERA Collaboration [13, 40].
4.1 The detector layout
The main features of the detector we are going to discuss in this paper are very similar to the ones of the OPERA experiment [13, 40], which is meant for a long baseline search for oscillations at the CNGS beam. The experiment uses nuclear emulsions as high resolution tracking devices for the direct detection of the produced in the CC interactions with the target.
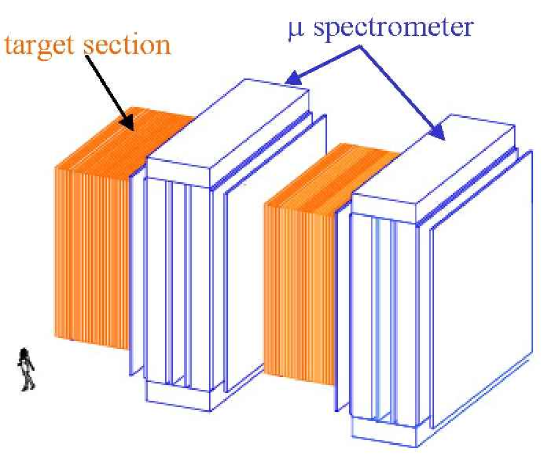
OPERA is designed starting from the Emulsion Cloud Chamber concept (see references quoted in [13]) which combines the high precision tracking capabilities of nuclear emulsions and the large mass achievable by employing metal plates as a target. The basic element of the ECC is the cell which is made of a 1 mm thick lead plate followed by a thin emulsion film. The film is made up of a pair of emulsion layers m thick on either side of a m plastic base. Charged particles give two track segments in each emulsion film. The number of grain hits in about m (-) ensures redundancy in the measurement of particle trajectories. By piling-up a series of cells in a sandwich-like structure bricks can be built, which constitute the detector element for the assembly of massive planar structures (walls). A wall and its related electronic tracker planes constitute a module. A supermodule is made of a target section, which is a sequence of modules, and of a downstream muon spectrometer. The detector consists of a sequence of supermodules (see Fig. 3).
The signal of the occurrence of a CC interaction in the detector target is identified by the detection of the lepton in the final state through the direct observation of its decay topology. A may decay either into the lead plate where the interaction occurred (short decay) or further downstream (long decay). For long decays, the is detected by measuring the angle between the charged decay daughter and the parent direction. The directions of the tracks before and after the kink are reconstructed in space by means of the pair of emulsion films sandwiching the lead plate where the interaction occurred. A fraction of the short decays is detectable by measuring a significant impact parameter (IP) of the daughter track with respect to the tracks originating from the primary vertex.
The detection of the decay and the background reduction benefit from the dense brick structure given by the ECC, which allows the electron identification through its showering, the pion and muon separation by the measurement method, and the determination of the momentum of each charged particle employing techniques based on the Multiple Coulomb Scattering. All these methods are discussed in the following.
Electronic detectors placed downstream of each emulsion brick wall are used to select the brick where the interaction took place (to be removed for the analysis) and to guide the emulsion scanning. The target electronic detectors are also used to sample the energy of hadronic showers and to reconstruct and identify penetrating tracks.
In the following we assume a supermodule structure with 31 brick walls followed by a muon spectrometer. For the present analysis, we consider the same setup as for OPERA at CNGS. The electronic detectors are 1 cm thick, 2.6 cm wide scintillator bars. The active detectors at the spectrometers are Resistive Plate Chambers (RPC) with 3 cm wide readout strips. The bending of the particle trajectory before and after the magnet is measured by high precision drift tubes (DT) [13]. With this configuration the total target mass of a supermodule is 0.9 Kton.
4.2 Kinematical analysis with ECC
4.2.1 Momentum measurement through the multiple scattering
When a particle of momentum and velocity traverses a material of thickness , measured in units of radiation length , the distribution of the scattering angle in a plane is approximately gaussian with a RMS given by
| (18) |
One can determine by measuring the distribution of the angular difference in two consecutive emulsion films. This method is called angular method. A resolution of about 2 to 3 mrad can be routinely obtained as shown in Fig. 4. The angular resolution is affected by both systematical sources (i.e. planarity of the scanning surface) and statistical effects which can be significantly reduced by means of precise and repeated measurements respectively providing a resolution of about 1 mrad.

The RMS of the measured scattering angles, , is the quadratic sum of the scattering signal and of the measurement error : . The error on when independent measurements are performed is
| (19) |
Using emulsion films, points can be used, since each of the two projections provides a set of independent measurements. Therefore, one can easily obtain a with a brick of about 50 emulsion films. In Fig. 5 we report the momentum resolution corresponding to an angular resolution of 3 mrad for 2, 3 and 4 GeV negative pions impinging onto a 3X0 ECC (17 emulsion films) [51]. A resolution of 28% (2 GeV) to 36% (4 GeV) has been achieved.

4.2.2 Electron identification
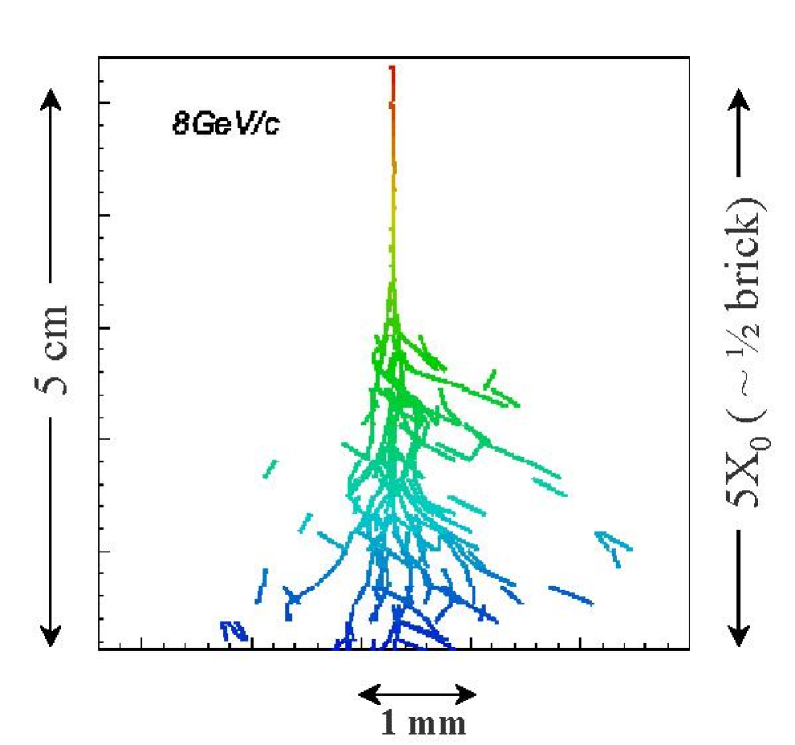
A typical example of an electron identified in an ECC brick is shown in Fig. 6. The identification is done employing the multiple scattering technique discussed above applied to the electron track before showering and counting the number of tracks when the shower develops (calorimetric measurement). In particular the peculiar energy loss rate of electrons is used to discriminate between electrons and hadrons: the energy is practically unchanged for hadrons but it is sizebly decreased by bremsstrahlung for electrons while traversing the brick. A estimator to test the two possible hypotheses (hadrons or electrons) is built and it is used as a separator. The minimization provides also the particle energy estimation. The other way to identify electrons is to count segments associated to its shower. The lateral spread of a shower is of the order of 1 cm which makes the shower itself well confined within a single brick. An energy resolution of about 20% can be obtained with this method, limited by background tracks falling into the analysis region.
Preliminary studies show that combining the two methods it is possible to achieve 97% identification efficiency for electrons with energy above 1 GeV [13].
4.2.3 Low momentum muon identification
Low momentum muons stopping in the ECC can be identified measuring the energy loss rate near the end-point of the range [52]. In this regime, the energy loss rate is given by . A measurement of the energy loss rate and of the distance traveled by the particle before stopping will therefore give the particle mass , with an error that gets contributions from and . The latter is the dominant one when a particle stops in the brick.
The grain measurement amounts to about m; hence, by measuring only one emulsion sheet one can get about 18% resolution on the ionization measurement. Since muons and pions are expected to cross about 10 emulsion films after entering into the non-relativistic regime, a mass resolution is achievable which means MeV for a pion. This mass resolution is used to separate muons from pions.
4.3 Muon reconstruction
The magnetic spectrometers located in the back of the ECC target are aimed to reconstruct the charge and the momentum of penetrating particles. The fraction of “silver” candidates where it is possible to measure the muon sign and the corresponding mis-assignment probability is a key parameter to assess the performance of OPERA as a detector for the Neutrino Factories. In fact the primary muon identification, even without charge reconstruction, plays an important role to veto background events. In particular, charm-production from CC interactions can be significantly suppressed if a prompt muon from the primary vertex is identified. Both at CNGS and in the present analysis muon candidates are selected combining the information of the scintillator trackers and the spectrometer RPC’s through a pattern recognition algorithm. For a detailed description of this procedure and the build-up of the candidate tracks we refer to [13] (Section 5.4) and [40] (Section 5.3). The muon identification algorithm is described in details in [13] (Section. 7.2) and [40] (Section 5.4) and it is briefly recalled here.
4.3.1 Muon identification
Among the reconstructed tracks, the longest one is chosen as a possible muon candidate. If the track is very penetrating and exits from the back of the spectrometer, it is validated as muon and no further cuts are applied. Otherwise cuts are imposed on the number of target walls and spectrometer iron plates belonging to the candidate and on the isolation of the track. Finally, a candidate is validated if the momentum measured by range is consistent (within proper tolerances) to the one measured in the ECC through Multiple Coulomb Scattering. All the ECC tracks matching the muon candidate within 200 mrad are considered. If more than one ECC track exhibits range-momentum correlation, the one with the best angular match is selected. The performance of the algorithm can be expressed in term of muon identification efficiency and matching probability. The former represents the number of true muons passing the -id cuts and matched to a track in the emulsions. The latter quantifies the probability of correct matching to ECC. Fig. 7 shows the muon identification efficiency and the matching probability versus the energy of the muon in interactions. It is worth noting that the muon identification efficiency for short muons stopping before the spectrometer can be improved significantly measuring the of the particles in the emulsions around the range-out area (see Section 4.2.3). This is particularly interesting for charm vetoing and in the OPERA experiment running at the CNGS allows a reduction of the charm background by about a factor 2. However, these results are only based on Monte Carlo simulations and tests are in progress in order to measure experimentally the separation through the technique. Although preliminary results are in a good agreement with Monte Carlo estimates, conservatively for the present analysis this technique is not employed. However, as an example, we will give results by using this technique only for a given () pair, see Section 7.3 .
4.3.2 Charge measurement
OPERA is able to measure the charge of the muons crossing the magnetic spectrometers or stopping in them. For through going muons an iterative minimization procedure is used to fit the measured muon trajectory combining the hits from target scintillators, spectrometer RPC’s and drift tubes. Hence, both the particle momentum and the charge can be reconstructed. For stopping particles the best estimate of the momentum is provided by the range, while the charge reconstruction still relies on the curvature in the magnetic field. The fraction of events where the charge can be measured (through going muons and stopping muons with enough spectrometer hits) and the probability to assign correctly the charge are shown in Fig. 7 as a function of the muon energy. As already discussed in [13] the charge mis-assignment probability in the energy range of interest is approximately constant and it is at the level of 0.1-0.3%.
5 Analysis of silver muons
Silver wrong-sign muons are produced in CC interactions, coming from oscillations with subsequent muonic decay of the . In the following we discuss in detail the signal efficiency and the expected background under the hypothesis that ’s circulate into the muon storage ring (namely, a 50% plus 50% beam hits the detector). Therefore, the signal we are looking for is .
5.1 Expected number of signal events
The search for muonic tau decays is performed by using an approach very similar to the one described in Refs. [13, 40]. Two classes of events are considered: short (the decays into the lead plate where the interaction occurred) and long decays (the decay occurrs outside the vertex plate, therefore the kink angle in space can be reconstructed).
The short decay search exploits the impact parameter technique, searching for a muon with a large IP with respect to a reconstructed vertex of at least two tracks (see Fig. 8). The main background is a subset of charm-production. Charm can be produced in CC and contributes to the signal either when the charge of the primary muon is wrongly measured in case of neutral charmed-hadron production (Fig. 8-b) or when the primary muon is not identified in the case of charged charmed-hadron production (Fig. 8-c). Charm can also be produced in (from ) CC interactions. If the origin of the muon track is unknown or wrongly reconstructed, these events can mimick a decay (as sketched in Fig. 8).
This background is significantly reduced by imposing a lower cut at 2 GeV on the invariant mass of the hadronic system, as computed by the momenta measured in the ECC. Even with a modest momentum resolution of 50% the charm background can be reduced by more than a factor of 1000 retaining 15% of the short decay signal. The results reported in [40] show that the total efficiency for muonic short decays is about 0.7%, including the muonic branching ratio of the . Although this analysis is very preliminary and could be improved, in the following we assume such an efficiency. The expected background was evaluated for the CNGS conditions to be DIS events, which is very small. Moreover, having in mind that at a Neutrino Factory the bulk of the events comes from interactions, while at the CNGS from , we can safely assume that the short decay channel is background free.
For long decays, candidates are searched for by measuring the kink angle in space and taking into account the worse angular resolution for decays in the base. The inefficiency in the kink detection results from the need of rejecting small-angle and very large-angle kinks. The upper cut ( 500 mrad) is motivated by considerations related to the scanning efficiency of the automatic microscopes. The lower cut (20 mrad in space) has been assigned taking into account that experimental data for hadron rescattering are available only down to such an angle. The excellent intrinsic angular resolution of the emulsion films would allow a substantially looser cut. Nevertheless, awaiting background measurements extended to lower angles, we maintain the conservative 20 mrad cut. As in the analysis described in Ref. [13] we only consider decays occurring in two lead plates downstream from the vertex plate. Unlike the CNGS analysis described in the OPERA Proposal, we do not apply neither a cut on the muon momentum nor a cut on the visible energy. On the other hand the charge measurement of the muon track is required. The only kinematical cut we apply is the transverse momentum at the decay vertex to be larger than 250 MeV. This cut allows the rejection of muonic decays of pions and kaons.
Summing up the short and long decay contributions, the overall efficiency (including the muonic tau decay branching ratio) for an average neutrino energy of 35 GeV is about 5%.
The expected number of signal events detected during a 5 year data taking with a 1 Kton detector for different values of is given in Tab. 4.
| L = 732 km | L = 3000 km | |
| 0.64 | 0.72 | |
| 8.73 | 8.90 | |
| 0.0092 | 0.070 | |
| 5.57 | 5.66 | |
| 0.52 | 0.30 | |
| 8.11 | 6.81 |
5.1.1 The golden muons signal at an ECC detector
Although not competitive with large magnetized calorimeters, an OPERA-like detector can also be used to study oscillations. From an experimental point of view this search does not imply additional efforts with respect to the ones needed to study the silver channel. Indeed, as soon as a wrong sign muon is reconstructed in the detector the brick where the interaction occurred is removed and the event carefully analyzed. If a decay candidate is found the event falls in the silver channel sample and the appropriate kinematical analysis applied. Conversely, it is classified as a golden event.
In an OPERA-like detector the background from charmed hadron and (produced by coming from oscillations) decays is highly suppressed because of the detector capability in detecting decay topologies. Since the presence of a kink on the muon track is not required, the background from decays or punch-through in this channel is higher.
Given the fact that, also in the most optimistic case, the mass of the OPERA-like detector is small if compared to a MID detector and it is not fully magnetized, the gain in sensitivity one could have in studying this channel is modest. Therefore, in the following we focus only on the sensitivity and we use it in combination with a MID detector exploiting the golden channel.
5.2 Expected background in the long decay sample
5.2.1 Neutrino induced charm-production
Charm-production from neutrinos can be induced by both unoscillated and coming from oscillated through the reaction
If the primary lepton is not identified and the charge of the muon from the semi-leptonic decay of the charmed hadron is wrongly measured, then the event is classified as a silver candidate.
The charm-production rate has been estimated by using the results of a combined analysis of all available data on neutrino-induced charm-production [53]. By using the predicted spectrum, we expect a charm rate, normalized to CC interactions, of
Given the capability in detecting decay topologies, an ECC detector is only sensitive to semi-muonic decays of the charged charmed mesons, unlike the electronic detectors. As it can be derived from Ref. [54], the fraction of charged among produced charmed particles is, at the Neutrino Factory energies, of about 45% (. Moreover, given the fact that the search is limited to muonic tau decays, we have to consider only the semi-muonic branching ratio of charmed hadrons, which amounts to about 10% [55].
Finally, we can write the expected number of events from this background as
where is the total number of charged-current events induced by , is the efficiency to identify the primary lepton, is the probability to identify the muon produced at the decay vertex and to measure the charge for muons reaching the magnet spectrometer, is the probability to correctly identify the charge of the daughter muon and is the probability to detect the charm decay. The latter efficiency includes the trigger efficiency, a fiducial volume cut (emulsions cannot be scanned up to the edge and there are small cracks between bricks, see Ref. [13] for more details), the probability to correctly identify with electronic detectors the brick where the interaction occurred, the efficiency of the emulsion tracking algorithm in reconstructing the interaction vertex in the ECC.
In our case only prompt unoscillated contribute to the background, although this background is highly suppressed by the fact that the charge of the muon produced at the charm decay vertex is positive. Therefore, it contributes to the background only if the charge of the muon is wrongly measured. By assuming an electron identification efficiency of 97% and the muon identification and charge determination efficiencies coming from the algorithm described in Section 4.3, we expect a background smaller than .
5.2.2 Anti-neutrino induced charm-production
Charm-production from anti-neutrinos can be induced from both unoscillated and from oscillations through the reaction
It is worth noticing that this background does not profit of the charge measurement of the muon from charmed-hadron decay, being the charge of the decay product negative.
The charm-production rate in anti-neutrino induced charm-production has been estimated by using the approach discussed in Appendix A. The expected rate, normalized to CC interactions, are
Finally, we can write the expected number of events from this background as
where gives the product of the probability that the primary lepton is not identified, the decay is classified as long and the secondary muon is reconstructed with the right charge. This probability has been evaluated to be and it is mildly dependent on the neutrino energy.
In our case only prompt unoscillated contribute to the background, which amounts to
5.2.3 Events from decays
A potential source of background comes from , produced by from the leading oscillations and undergoing to a charged-current interaction, decaying into a positive muon with the charge wrongly measured.
From Tables 2 and 3, we see that for and the number of is one order of magnitude larger than . Therefore, under the assumption that the -decay detection efficiency is independent of the lepton charge and that the probability to misidentify the charge of the muon is of the order of , we expect that for this particular value of () the background from this channel is a factor hundred smaller than the observed number of signal events. Nevertheless, the dependence on the oscillation parameters is properly taken into account.
5.2.4 Muons wrongly matched to a hadron track
Occasionally, a identified as in the electronic detector is wrongly matched to a hadron track at the exit of the vertex brick, as it is reconstructed by tracking with the emulsion ECC brick. Because the kinematical analysis in the muonic channel is very loose, without special care in the track matching such a mismatch would result in a non negligible number of background events due to hadron re-interactions.
In order to reduce this background, if there is an emulsion track with an angular difference smaller than 50 mrad with respect to the one matched to the “electronic” muon, the matching is flagged as ambiguous and, in the presence of a kink, the event is not taken as a candidate. This implies a few percent relative loss of efficiency already accounted for in Section 5.1. Further improvements in the background reduction come from the requirement to have the charge of the muon correctly identified, the latter being not present in the OPERA analysis discussed in Ref. [40].
The mismatch probability has been computed to be . On the other hand the probability that a hadron undergoes to a re-interaction mimicking a kink topology which survives the kinematical cuts has been computed with the FLUKA package [56] to be . Therefore, the expected background from this source is
5.2.5 Decay in flight of and punch-through
Neutral-current (NC) events with punch-through hadrons or particles decaying in flight will dominate the scanning load of an OPERA-like detector at the Neutrino Factory (see Section 6). Moreover, if the hadron undergoes to an elastic scattering in lead mimicking a kink topology, it will also contribute to the silver channel background. The probability of a primary hadron to be reconstructed as a muon, reach the spectrometer and have a reconstructed charge consistent with a silver candidate has been computed by Monte Carlo simulation. It corresponds to an efficiency of 0.6%. Folding the events with the probability of undergoing large scattering in the first two lead sheets we obtain an efficiency of . About 83% of these events are decay in flight. The other 17% fraction is made up of punch-through pions surviving the cut on the muon length. Also CC events contribute to this background if the primary electron is unidentified. The background is
where () is the expected NC (CC) rate for neutrinos of type ; is the electron efficiency and is defined as in Section 5.2.1.
5.2.6 Large-angle muon scattering
A muon can undergo to a large-angle scattering mimicking a muonic decay of a short-lived particle. Potential sources of this background are produced in CC interactions of from oscillations and from CC interactions, with a wrongly measured charge.
Extensive studies of this background have been carried out by the OPERA Collaboration. A Monte Carlo simulation including the lead form-factors gave a rate of muon scattering off 2 mm lead mimicking a decay of [13]. Recently, the analysis of a dedicated measurement of large-angle scattering of 9 GeV muons in lead plates became available. The corresponding measured rate is [40]. In the OPERA proposal, a conservative assumption of was made. Even in this case, the background from this source is smaller than
5.2.7 Associated charm-production
Another possible source of background is given by the associated charm-production, in which two charmed hadrons are produced and one of the two escapes the detection. The cross-section of this process has been measured only by the E531 experiment and it turns out to be more than one order of magnitude smaller than that for single charm-production. In the following, we neglect this background.
6 Estimate of the scanning load
We try here to give an estimate of the overall scanning load needed to handle the silver and golden muon signals at the ECC detector and how it scales with the detector mass.
There are several sources of events contributing to the scanning load. Considering a in the storage ring, we can classify them in four categories: signal events from oscillations; background events from , with misidentified muon charge (as discussed in Sections 5.2.3 and 5.2.6); background events from both and with charged charmed meson production and unidentified primary lepton (as in Sections 5.2.1 and 5.2.2); background events from and NC interactions with punch-through mesons misidentified as muons (Section 5.2.5). Whereas the signal events depend on the mixing matrix parameters, the different sources of background are mainly parameter-independent and can be estimated by the knowledge of the and fluxes at a given distance from the source.
Consider a in the storage ring and the mixing matrix parameters of Tab. 2, namely and , a baseline km and the “natural” polarization . Any time a “” (a particle with the characteristics of a muon and with charge identified as negative) is reconstructed by the electronic detector, we will have to scan the emulsions of the brick where interactions occurred. The first category of events are signal events: for a 1 Kton detector, we expect events from oscillations and events from oscillations with subsequent muonic tau decay, for the considered mixing matrix parameters. In the second category we find events from with misidentification of the muon charge (however, after the emulsion scanning only large angle muon scattering events will contribute to the background, Section 5.2.6) and events from . In the third category we find events from with non-observation of the primary right-sign muon and correctly identified secondary wrong-sign muon from the decay. All other kind of events in this category ( and ) give negligible contributions to the scanning load due to the oscillation probability or to the factor for charge misidentification. These events will be scanned and something like 95 % of them will be rejected when the primary lepton is identified during the emulsion analysis. Finally, events in the fourth category give the most relevant contribution to the scanning load: these are NC interactions of both and where a pion or kaon is identified as a muon (punch-through hadrons or their muonic decay). Considering the neutrino fluxes in Tab. 1 for the polarization and km, a factor 0.3 for the NC/CC cross-section ratio and the probability of for this process to occur (see Section 5.2.5) we have about events to be scanned. Given the absence of a physical kink these events will be rejected after emulsion analysis except for hadron re-interactions.
In summary, for a 1 Kton mass detector located at km from the neutrino source, we estimate a total scanning load in 5 years of data taking of less than . Notice that the two dominant sources of scanning load, i.e. non-oscillated CC interactions with misidentified muon charge and NC interactions with punch-through mesons identified as muons, do not depend (to a great extent) on the mixing matrix parameters and therefore do not scale with . For a 5 Kton detector we expect less than bricks to be scanned in 5 years, a scanning load that seems technologically affordable.
Finally, we remind that if the detector were to be located at km from the neutrino source, the scanning load will be reduced by about a factor 15.
7 Sensitivity to ()
The overall sensitivity achievable in the plane () is evaluated by combining golden muon events measured by a 40 Kton iron detector run with both beam polarities and silver muon events observed with a 5 Kton OPERA-like detector. The golden muon sample at the OPERA-like detector is not considered in the present analysis since it has a worse signal/background ratio compared with the iron detector. Eventually, only the polarity is taken into account for the OPERA-like detector. In the following, the magnetized iron detector is located at a fixed baseline km, while both and km are considered as possible baselines for the ECC detector.
7.1 Signal and background uncertainties
The total number of golden muons and background events expected for the iron detector is reported in [38], whereas Section 5 describes our analysis of the silver muons and backgrounds in the OPERA-like detector. In the present section we summarize the corresponding systematic uncertainties for both detectors. Although our estimates are based upon the present experimental knowledge, whenever a definite experimental program allowing an improvement is foreseen we will make use of the expected results.
The main sources of systematic uncertainties for the ”silver” signal events in the OPERA-like detector are the knowledge of the emulsion scanning efficiency and the cross-section ratio . In the following we assume an overall systematic uncertainty of 15% which is consistent with the one used in Ref. [13].
For an OPERA-like detector three main background contributions (see Section 5) are present: the muonic decay of events from oscillations, the anti-neutrino induced charm-production and the decay in flight of and punch-through . The present knowledge on anti-neutrino induced charm-production, as discussed in Appendix A, is limited to about 40% because of lack of data. However, at the Neutrino Factory a specific short-baseline program is foreseen [57], collecting a sample of events induced by neutrinos and anti-neutrinos with a charmed hadron in the final state. Such a statistics will improve considerably the knowledge of the related cross-sections. In the following we assume a conservative 10% systematic uncertainty on the charm background. The uncertainty on the background induced by decays is the same as the one on the ”silver” signal. The last background contribution is dominated by the poor knowledge of the hadronization and of the hadronic re-interaction processes. We conservatively assume a 50% uncertainty on this background source.
A preliminary study of the performance of a magnetized iron detector for the search at a Neutrino Factory was presented in [38]. The main background sources were pion and kaon decays and muonic decay of charmed hadrons. A 20% resolution was assumed on the reconstructed neutrino energy, while no systematic uncertainty was assigned to backgrounds and signal events in the calculations. In order to obtain realistic estimates of the experimental performance we try to include such uncertainties in the present work. The systematic uncertainty on the expected number of signal events is mainly related to the detection efficiency and to the calibration, since the flux and the cross-section are known to a high accuracy. In the following we assume a 10% uncertainty on the signal, taking into account the coarse granularity of the detector and the absence of an in situ calibration beam line (used for instance to calibrate and monitor the NuTeV calorimeter [58]). The dependence of the sensitivity on this uncertainty will be discussed in the following sections. As far as the background is concerned, we assume a 50% systematic uncertainty, consistently with the treatment of the OPERA-like detector, although the overall sensitivity only mildly depends on this parameter.
7.2 Statistical treatment
Since signal and backgrounds have a different energy dependence (see Fig. 9), the number of expected events in both detectors is divided into several energy bins. For the iron detector we use five bins of constant width of 10 GeV [38, 27, 28]. An energy resolution of is used to smear the expected number of events in each bin, resulting in a slightly lower signal/background ratio. The number of signal and background events for 5 years data taking and for both polarities in all bins is shown in Tab. 5.
| Energy | Expected | Expected signal () | |||
|---|---|---|---|---|---|
| & beam | back. | () | () | () | () |
| 010, | 1.31 | 0.25 | 0.45 | 3.36 | 4.24 |
| 1120, | 8.50 | 61.99 | 61.27 | 685.76 | 692.67 |
| 2130, | 2.43 | 109.53 | 80.50 | 1122.08 | 984.82 |
| 3140, | 0.54 | 81.18 | 56.60 | 866.17 | 726.54 |
| 4150, | 0.21 | 42.61 | 26.97 | 422.18 | 366.95 |
| 010, | 2.90 | 0.19 | 0.08 | 0.96 | 0.36 |
| 1120, | 8.79 | 29.15 | 6.84 | 237.04 | 129.12 |
| 2130, | 7.51 | 59.08 | 17.38 | 510.71 | 308.29 |
| 3140, | 4.37 | 44.18 | 15.26 | 414.65 | 261.41 |
| 4150, | 1.44 | 24.20 | 8.43 | 215.90 | 147.24 |
The choice of the binning for the OPERA-like detector is performed according to the overall sensitivity to (). In particular, since the number of expected events at small varies quadratically with , the binning is optimized for which is the critical region where few signal events are expected and assuming for OPERA km. Several configurations for both the total number of bins and their boundaries are considered. For each binning definition, we evaluate the sensitivity as the average 90% CL upper limit obtained by a large ensemble of experiments in the absence of a signal. The calculation is performed for different values of in the range . The final configuration includes four bins and is the one providing the best sensitivity as a function of . Fig. 10-a shows the sensitivity obtained by changing the bin boundaries and Fig. 10-b the results obtained with a different number of bins. Tab. 6 summarizes the expected number of signal and background events in each of the reconstructed energy bins. The energy smearing has a larger impact for the OPERA-like detector due to the strong energy-dependence of the background (dominated by charm-production), thus increasing the expected background at low energy. From Tab. 6 it can be seen that the OPERA-like detector has no sensitivity when both and . This region partially corresponds to the central part of the curves in Fig. 10.

| Energy | Expected | Expected signal () | |||
|---|---|---|---|---|---|
| & distance | back | () | () | () | () |
| 018, 732 | 0.75 | 0.01 | 0.39 | 4.69 | 6.64 |
| 1929, 732 | 3.91 | 0.02 | 0.89 | 9.73 | 13.81 |
| 3042, 732 | 9.37 | 0.01 | 0.93 | 9.37 | 14.10 |
| 4350, 732 | 9.82 | 0.01 | 0.40 | 4.08 | 5.99 |
| 018, 3000 | 0.13 | 0.14 | 0.15 | 5.32 | 5.41 |
| 1929, 3000 | 0.49 | 0.11 | 0.50 | 10.02 | 11.70 |
| 3042, 3000 | 0.92 | 0.07 | 0.59 | 9.13 | 11.92 |
| 4350, 3000 | 0.86 | 0.02 | 0.27 | 3.85 | 5.04 |
In order to evaluate the confidence regions which can be realistically deduced from the experimental apparatus, we simulate several sets of data corresponding to different () points. For each theoretical point and each energy bin, we throw the numbers of (observed) signal and background events from Poisson distributions with mean values corresponding to the expected ones. Furthermore, the mean Poisson values are smeared assuming a gaussian width corresponding to the quoted uncertainties (see Section 7.1). Notice that, in principle, the procedure should be repeted many times to compute the average confidence intervals from a large ensemble of identical experiments. However, given the prohibitive computational time, we only perform two trials for each simulated point.
The individual measurements from each of the 14 energy bins (4 bins in the OPERA-like detector for and 5 bins in the iron detector for each beam polarity) are then combined using the frequentist approach of Ref. [41] to set 68.27% (), 90% and 99% confidence intervals on the reconstructed () parameters. The different bins are treated as independent. A maximum likelihood fit is performed to the simulated data to extract the signal content, through a global scan in the plane (). The internal signal grid used for the fit has a resolution of and .
7.3 Combining an OPERA-like detector at 732 km and an iron detector at 3000 km
The numbers of expected events summarized in Tab. 5 and Tab. 6 show that the sensitivity of the OPERA-like detector degrades considerably at small values of both and . However, its contribution to the overall measurement is very relevant due to the complementary oscillation pattern described in Section 2. Therefore, the effect of combining both ”golden” and ”silver” channels can be already seen for .
| Confidence level | ||
|---|---|---|
| 68.27 % | ||
| 90.00 % | ||
| 99.00 % |

Fig. 11 shows the extracted 68.27%, 90% and 99% confidence regions in the () plane corresponding to four simulated points, if the OPERA-like detector is placed at km from the neutrino source. Tab. 7 summarizes the projection of the confidence level contours onto the axis for . It can be noticed that all the displayed curves are connected.
Since the expected background is small ( events) in all bins, the systematic uncertainties on this component have a minor effect on the overall sensitivity. The same consideration applies to the ”silver” signal in the OPERA-like detector. However, systematic uncertainties greater than 5% on the golden signal can reduce the sensitivity of the iron detector. This is particularly important at small values of . In our calculation we assumed a conservative 10% uncertainty, which could be further reduced by an accurate work on the detector. Tab. 8 shows the effect of this parameter on the 99% confidence regions resulting from the simulated point .
| Signal uncertainty | ||
|---|---|---|
| for iron detector | ||
| 0 % | ||
| 5 % | ||
| 10 % | ||
| 20 % |
From Tab. 6 it can be seen that the sensitivity of the OPERA-like detector at km is limited by backgrounds, mainly from anti-neutrino charm-production where the primary lepton is not identified (Section 5.2.2). The evaluation of this component is based upon the present understanding of the OPERA detector. As discussed in Section 4.3, a detailed analysis close to the end point of the tracks could further improve the primary muon identificatin by about a factor two. The corresponding efficiency loss is limited to few percents. When a sizeable ”silver” signal is expected, such a background reduction would result in narrower confidence intervals, as can be seen from Tab. 9.
| Confidence level | Standard | Bkgnd0.5 | ||
|---|---|---|---|---|
| 68.27 % | ||||
| 90.00 % | ||||
| 99.00 % | ||||
7.4 Combining an OPERA-like detector and an iron detector both at 3000 km

A location of the OPERA-like detector at 3000 km would reduce considerably most background contributions (proportional to ), with the exclusion of the muonic decay of events from oscillations. Tab. 6 shows the corresponding increase in the signal/background ratio for the detection of the ”silver” signal events.
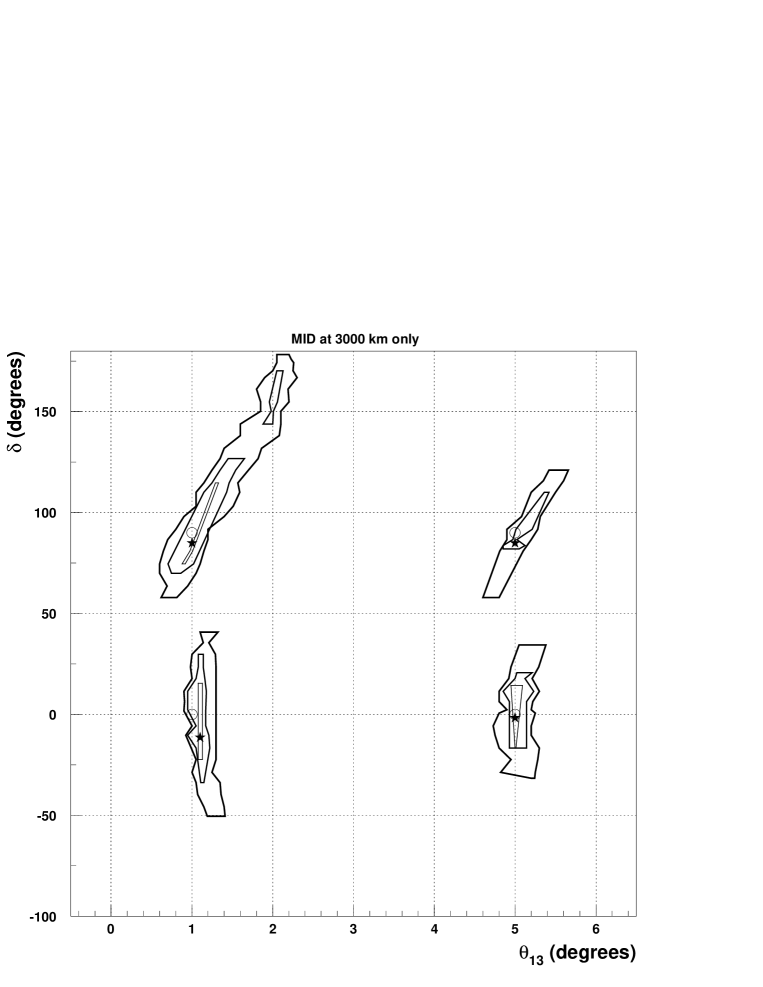
In Fig. 12 we show the extracted 68.27%, 90% and 99% confidence regions in the () plane corresponding to the same four simulated points of Section 7.3. In this case, the curves extracted for the point are not fully connected, mainly due to the tiny signal contribution expected from the ”silver” channel (Tab. 6). However, as explained in the previous section, values of are close to the intrinsic limit of the experimental sensitivity, producing wide fluctuations on the number of observed events. Actually, by increasing the number of simulated experiments for , in few cases we observe the presence of disconnected curves also with the 732 km baseline for the OPERA-like detector, regardeless of the additional background reduction mentioned in Section 7.3. For larger values of the location of the OPERA-like detector at 3000 km can produce some reduction in the size of the confidence intervals. For comparison, in Fig. 13 we give the corresponding results when only the magnetized iron detector at km is used (still considering two beam polarities).
It is worth noting that the scanning load reduces as and we do expect to scan few thousand events in this case. This would allow some potential improvements:
-
•
remove more than one brick per event. This would allow an increase of the signal detection efficiency by about 20% (mainly due to an increase in the brick finding efficiency);
-
•
inclusion of the channel when the beam is run with opposite polarity. The background is larger by about a factor of two with respect to the channel, while the signal is reduced by the same amount due to the cross-section of anti-neutrinos. Since the resulting background will be still small at 3000 km, this channel would slightly increase the sensitivity of the measurement in spite of the worse signal/background ratio.
Alternatively, one could also foresee an increase of the mass of the detector and/or of the exposure.
8 Conclusions
It was previously shown [27] that looking for “golden” wrong-sign muons at the Neutrino Factory is the most sensitive method to measure simultaneously and . One of the main problems concealed in this measurement was, however, pointed out in [28]: due to correlations between and in eq. (11): degenerate regions in the reconstructed () parameter space occur in many cases, thus producing a scenario pretty much similar to that of the solar neutrino puzzle before SNO and KamLand. In particular, the appearance of different allowed regions in the parameter space, often widely separated in the axis, severely reduces the Neutrino Factory sensitivity to the CP-violating phase. In [1] it was proposed the use of oscillation to solve the () “intrinsic ambiguity” problem, taking advantage of the complementarity between the and oscillation probabilities (Section 2).
Whereas the “golden” channel can be studied using a coarsely grained magnetized iron detector [38], to profit of the “silver” channel we must use a detector of a different kind, capable of separating the “silver” muon signal from the “golden” muon one, by means of the different energy distribution of the final muons or by looking for the decay vertex. In [1], it was decided to consider the second possibility looking for the “silver” muon signal with an OPERA-like detector, making use of the available information on the ECC detector [13, 40]. However, since the “silver” channel is strongly suppressed with respect to the “golden” channel by the cross-section and by the branching ratio (we are indeed dealing with tens of events, at most), extreme care must be devoted to the background treatment. This is why we present in this paper a dedicated analysis of backgrounds and efficiencies at an ECC OPERA-like detector when dealing with the “silver” and “golden” channel at a Neutrino Factory. The outcome of this study, presented in full detail in Section 5, is that the three dominant sources of background to the “silver” channel after emulsion scanning, are (in order of importance): wrong-sign muons coming from the decay of charged charmed mesons produced in combination with a non-observed right-sign muon; punch-through mesons that mimick a charged energetic lepton particle identified as a wrong-sign muon; right-sign muons coming from the decay of a produced through the leading oscillation , whose charge is wrongly identified. Notice that the dominant sources of background arise from non-oscillated and that undergo CC interactions (charmed mesons production) or NC interactions (punch-through mesons): both of them, therefore, decreases like the flux as and can thus be made negligible by locating the ECC detector at a larger distance (as it was indeed the case for the golden signal at the MID [27]).
In this paper we show that the intrinsic ambiguity problem is solved for when using a 40 Kton magnetized iron detector, to deal with the “golden” muon signal, and a 5 Kton ECC OPERA-like detector, to measure the “silver” muon signal. We also include systematic effects in the treatment of the “golden” muon sample at the MID, previously not considered. We present (Section 7) a refined statistical analysis of the simulated data for a MID at km and an ECC either at km or at km, taking advantage of the different energy distribution of “silver” signal and backgrounds. Below , the “silver” muon sample at the ECC detector becomes statistically negligible. With both the MID and the ECC located at km we expect a significant decrease in the background of the “silver” channel, as previously mentioned. This translates, for , in a reduction of the confidence intervals with respect to the configuration with the ECC at km.
We have also carried out a rather detailed analysis of the foreseeable scanning load at the 5 Kton ECC detector with the considered Neutrino Factory beam ( useful decay in the storage ring), showing that the total scanning load to deal with the “silver” and “golden” muon samples and the related backgrounds ( bricks to be scanned in five years) is technologically affordable and does not represent a severe problem.
It must be stressed that in this paper we restricted ourselves to the study of the () intrinsic ambiguity, by fixing and by choosing a given sign for (in the hypothesis that more information on the three neutrino spectrum will become available by the time the Neutrino Factory will be operational).
We believe that solving the three ambiguities at the same time will need the combination of different kinds of detectors and baselines: a careful study of the required net of detectors is beyond the scope of this paper and it will be presented elsewhere.
Appendix A Charm-production cross-section
Neutrino and anti-neutrino induced single charm-production is particularly interesting to study the strange-quark parton distribution function and the threshold effect in the cross-section, associated with the heavy quark production. Over the past 30 years, many experiments have carried out these studies with complementary techniques: calorimetry, bubble chambers and nuclear emulsions. These data have been reviewed and combined statistically to extract a world averaged single charm-production cross-section induced by neutrino in Ref. [53]. These results have been compared with predictions of a leading-order calculation with GeV (Fig. 14) and the agreement is quite good. Unfortunately, there are no inclusive measurements of the anti-neutrino induced single charm-production. However, given the good agreement between data and theoretical calculations obtained for neutrinos, we use for our calculations the parametrization shown in Fig. 14 which is based on the LO calculation at GeV of [53].
References
- [1] A. Donini, D. Meloni and P. Migliozzi, Nucl. Phys. B 646 (2002) 321.
-
[2]
B. Pontecorvo,
Sov. Phys. JETP 6 (1957) 429
[Zh. Eksp. Teor. Fiz. 33 (1957) 549];
Z. Maki, M. Nakagawa and S. Sakata, Prog. Theor. Phys. 28 (1962) 870;
B. Pontecorvo, Sov. Phys. JETP 26 (1968) 984;
V. N. Gribov and B. Pontecorvo, Phys. Lett. B 28 (1969) 493. -
[3]
Y. Fukuda et al. [Super-Kamiokande Coll.],
Phys. Rev. Lett. 81, 1562 (1998);
M. Ambrosio et al. [MACRO Coll.], Phys. Lett. B517 (2001) 59;
B.T. Cleveland et al., Astrophys. J. 496, 505 (1998);
J.N. Abdurashitov et al. [SAGE Coll.], Phys. Rev. C60, 055801 (1999);
W. Hampel et al. [GALLEX Coll.], Phys. Lett. B447, 127 (1999);
S. Fukuda et al. [Super-Kamiokande Coll.], Phys. Rev. Lett. 86, 5651 (2001);
Q.R. Ahmad et al. [SNO Coll.], Phys. Rev. Lett. 87, 071301 (2001);
M.H. Ahn et al. [K2K Coll.], Phys. Rev. Lett. 90 (2003) 041801.
- [4] K. Eguchi et al. [KamLAND Coll.], Phys. Rev. Lett. 90 (2003) 021802.
-
[5]
C. Athanassopoulos et al. [LSND Collaboration],
Phys. Rev. Lett. 81 (1998) 1774;
A. Aguilar et al. [LSND Collaboration], Phys. Rev. D 64 (2001) 112007. - [6] E. Zimmerman, talk at NOON 2003, http://www-sk.icrr.u-tokyo.ac.jp/noon2003/.
- [7] C. Yanagisawa, talk at NOON2003, http://www-sk.icrr.u-tokyo.ac.jp/noon2003/.
- [8] Q. R. Ahmad et al. [SNO Collaboration], Phys. Rev. Lett. 89 (2002) 011301; Phys. Rev. Lett. 89 (2002) 011302
-
[9]
L. Wolfenstein,
Phys. Rev. D 17 (1978) 2369;
Phys. Rev. D 20 (1979) 2634;
S.P. Mikheyev and A. Yu. Smirnov, Sov. J. Nucl. Phys. 42 (1986) 913. -
[10]
G. L. Fogli, E. Lisi, A. Marrone, D. Montanino, A. Palazzo and A. M. Rotunno,
Phys. Rev. D 67 (2003) 073002;
A. Bandyopadhyay, S. Choubey, R. Gandhi, S. Goswami and D. P. Roy, Phys. Lett. B 559 (2003) 121;
J. N. Bahcall, M. C. Gonzalez-Garcia and C. Pena-Garay, JHEP 0302 (2003) 009;
M. Maltoni, T. Schwetz and J. W. Valle, arXiv:hep-ph/0212129. - [11] M. Apollonio et al. [CHOOZ Coll.], Eur. Phys. J. C 27 (2003) 331.
- [12] F. Arneodo et al. [ICARUS Coll.], ICARUS-TM/2001-08 LNGS-EXP 13/89 add.2/01.
- [13] M. Guler et al., OPERA Collaboration, CERN/SPSC 2000-028, SPSC/P318, LNGS P25/2000.
-
[14]
E. Ables et al. [MINOS Coll.],
FERMILAB-PROPOSAL-P-875
The MINOS detectors Technical Design Report, NuMI-L-337, October 1998. - [15] Y. Itow et al., KEK-REPORT-2001-4, arXiv:hep-ex/0106019.
- [16] M. Komatsu, P. Migliozzi and F. Terranova, J. Phys. G 29 (2003) 443.
- [17] M. Diwan et al., NuMI-NOTE-SIM-0714.
- [18] P. Migliozzi and F. Terranova, arXiv:hep-ph/0302274.
-
[19]
P. Huber, M. Lindner and W. Winter,
Nucl. Phys. B 645 (2002) 3;
Nucl. Phys. B 654 (2003) 3;
P. Huber and W. Winter, arXiv:hep-ph/0301257. - [20] S. Geer, Phys. Rev. D 57 (1998) 6989 [Erratum-ibid. D 59 (1998) 039903].
- [21] A. De Rujula, M. B. Gavela and P. Hernandez, Nucl. Phys. B 547 (1999) 21.
- [22] A. Blondel et al., Nucl. Instrum. Meth. A 451 (2000) 102.
- [23] M. Apollonio et al., arXiv:hep-ph/0210192.
- [24] K. Dick, M. Freund, M. Lindner and A. Romanino, Nucl. Phys. B 562 (1999) 29.
- [25] V. Barger, S. Geer and K. Whisnant, Phys. Rev. D 61 (2000) 053004.
- [26] A. Bueno, M. Campanelli and A. Rubbia, Nucl. Phys. B 573 (2000) 27.
- [27] A. Cervera et al., Nucl. Phys. B 579 (2000) 17 [Erratum-ibid. B 593 (2001) 731]; Nucl. Instrum. Meth. A 472 (2000) 403.
-
[28]
J. Burguet-Castell, M. B. Gavela,
J. J. Gomez-Cadenas, P. Hernandez and O. Mena,
Nucl. Phys. B 608 (2001) 301;
J. Burguet-Castell and O. Mena, arXiv:hep-ph/0108109. - [29] H. Minakata and H. Nunokawa, JHEP 0110 (2001) 001.
- [30] V. Barger, D. Marfatia and K. Whisnant, Phys. Rev. D 65, 073023 (2002).
- [31] H. Minakata, H. Nunokawa and S. Parke, arXiv:hep-ph/0301210.
-
[32]
H. Minakata, H. Sugiyama, O. Yasuda, K. Inoue and F. Suekane,
arXiv:hep-ph/0211111;
P. Huber, M. Lindner, T. Schwetz and W. Winter, arXiv:hep-ph/0303232. - [33] M. Freund, P. Huber and M. Lindner, Nucl. Phys. B 615 (2001) 331.
- [34] A. Rubbia, arXiv:hep-ph/0106088.
- [35] A. Bueno, M. Campanelli, S. Navas-Concha and A. Rubbia, Nucl. Phys. B 631 (2002) 239.
- [36] T. Kajita, H. Minakata and H. Nunokawa, Phys. Lett. B 528 (2002) 245.
- [37] J. Burguet-Castell, M. B. Gavela, J. J. Gomez-Cadenas, P. Hernandez and O. Mena, Nucl. Phys. B 646 (2002) 301.
- [38] A. Cervera, F. Dydak and J. Gomez Cadenas, Nucl. Instrum. Meth. A 451 (2000) 123.
- [39] A. Donini, talk at NOON2003, http://www-sk.icrr.u-tokyo.ac.jp/noon2003/.
- [40] M. Guler et al. [OPERA Collaboration], CERN-SPSC-2001-025.
- [41] G. J. Feldman and R. D. Cousins, Phys. Rev. D 57 (1998) 3873.
- [42] M. Freund, Phys. Rev. D 64 (2001) 053003.
- [43] K. Kimura, A. Takamura and H. Yokomakura, Phys. Lett. B 537 (2002) 86; Phys. Rev. D 66 (2002) 073005.
- [44] H. Minakata, H. Nunokawa and S. Parke, Phys. Lett. B 537 (2002) 249.
- [45] A. M. Dziewonski and D.L. Anderson, Phys. Earth Planet. Int. 25 (1981) 297.
- [46] P. Lipari, Nucl. Phys. Proc. Suppl. 112 (2002) 274.
- [47] P. Lipari, M. Lusignoli, D. Meloni and D. Zardetto, in preparation.
- [48] J. M. Conrad, M. H. Shaevitz and T. Bolton, Rev. Mod. Phys. 70 (1998) 1341.
- [49] P. Lipari, private communication.
- [50] A. Broncano and O. Mena, arXiv:hep-ph/0203052.
- [51] M. De Serio et al., Momentum measurement by the angular method in the Emulsion Cloud Chamber, Accepted for publication on Nuclear Instruments and Methods.
- [52] C.F. Powell et al., The study of elementary particles by the photographic method, Pergamon Press (1959).
- [53] G. De Lellis, A. Marotta and P. Migliozzi, J. Phys. G 28 (2002) 713 [Erratum-ibid. G28 (2002) 1515].
- [54] G. De Lellis, F. Di Capua and P. Migliozzi, Phys. Lett. B 550 (2002) 16.
- [55] A. Kayis-Topaksu et al. [CHORUS Collaboration], Phys. Lett. B 549 (2002) 48.
- [56] A. Fasso, A. Ferrari, P. R. Sala and J. Ranft, SLAC-REPRINT-2000-117 Prepared for International Conference on Advanced Monte Carlo for Radiation Physics, Particle Transport Simulation and Applications (MC 2000), Lisbon, Portugal, 23-26 Oct 2000. A. Fasso, A. Ferrari and P. Sala, SLAC-REPRINT-2000-116 Prepared for International Conference on Advanced Monte Carlo for Radiation Physics, Particle Transport Simulation and Applications (MC 2000), Lisbon, Portugal, 23-26 Oct 2000.
- [57] M. L. Mangano et al., arXiv:hep-ph/0105155.
- [58] D. A. Harris et al. [NuTeV Collaboration], Nucl. Instrum. Meth. A 447 (2000) 377.