A road map to solar neutrino fluxes, neutrino oscillation parameters, and tests for new physics
Abstract:
We analyze all available solar and related reactor neutrino experiments, as well as simulated future 7Be, , and solar neutrino experiments. We treat all solar neutrino fluxes as free parameters subject to the condition that the total luminosity represented by the neutrinos equals the observed solar luminosity (the ‘luminosity constraint’). Existing experiments plus the luminosity constraint show that the solar neutrino flux is times the flux predicted by the BP00 standard solar model; the 7Be neutrino flux is the predicted flux; and the 8B flux is the predicted flux. The CNO fluxes are very poorly determined. The neutrino oscillation parameters are: and . We evaluate how accurate future experiments must be to determine more precisely neutrino oscillation parameters and solar neutrino fluxes, and to elucidate the transition from vacuum-dominated to matter-dominated oscillations at low energies. A future 7Be scattering experiment accurate to % can reduce the uncertainty in the experimentally determined 7Be neutrino flux by a factor of four and the uncertainty in the neutrino flux by a factor of 2.5 (to %). A future experiment must be accurate to better than % to shrink the uncertainty in by more than 15%. The idea that the Sun shines because of nuclear fusion reactions can be tested accurately by comparing the observed photon luminosity of the Sun with the luminosity inferred from measurements of solar neutrino fluxes. Based upon quantitative analyses of present and simulated future experiments, we answer the question: Why perform low-energy solar neutrino experiments?
1 Introduction
We assess in this paper how well existing and future experiments can determine neutrino parameters and solar neutrino fluxes. The starting point for our calculations is the assumption that the large mixing angle (LMA) MSW solution [1] describes exactly the behavior of solar neutrino oscillations and that the true values for the oscillation parameters lie close to the current best-estimate oscillation parameters [2, 3] 111The data included in the analysis in the present paper include all relevant solar and reactor neutrino data available on or before September 7, 2003, the date on which the SNO collaboration announced the results of their measurements in the salt phase and on which the GNO and SAGE collaborations announced refinements of their measurements. The recent SNO, GNO, and GALLEX data, which are included in the analyses reported in this paper, were all presented at the VIIIth International Conference on Topics in Astroparticle and Underground Physics (TAUP03), Seattle (Sept. 5–9, 2003). Only minor numerical changes resulted from this updating, but we are grateful to the referee and to JHEP for allowing us to include the new data in the final version of this paper. An energetic reader can learn interesting and encouraging details about the robustness of current solar neutrino inferences by comparing the many numerical results presented in hep-ph/0305159,v2. with the numerical results presented in the present version of this paper..
The conclusions derived in this paper are based upon 152 global analyses of all of the available solar neutrino and reactor data. The individual analyses differ, for example, in the input data (including cases before and after the recent announcement of the SNO salt-phase data and the improved GNO and SAGE measurements), the different constraints placed on the neutrino fluxes (e.g., with or without the luminosity constraint), the number of neutrino fluxes that are treated as free variables, and the different assumptions made about future solar neutrino and reactor experiments. The purpose of this introduction is to set the stage for the many detailed results that are presented in the subsequent sections and to provide the reader with a overall map of what is contained where in this paper.
The new experiments discussed in this paper will test whether the LMA neutrino oscillation solution is correct and, if it is correct, will determine accurately the solar neutrino fluxes, the solar neutrino mixing angle, and the difference of the squares of the neutrino masses. We will not be surprised if these experiments reveal physics or astronomy that cannot be explained within the now conventional framework of the LMA oscillation solution and the standard solar model. The fundamental goal of our paper is to determine what is expected in order to make it easier to recognize what is unexpected.
We also show that neutrino experiments alone can be used to measure the current rate of nuclear energy generation in the Sun and to compare this neutrino-measured solar luminosity with the conventional photon-measured solar luminosity. This comparison will provide an accurate test of the fundamental assumption that nuclear fusion among light elements is responsible for the solar luminosity. Moreover, this same comparison will test a basic result of the standard solar model, namely, that the Sun is in a quasi-steady state in which the current energy generation in the interior equals the current luminosity at the solar surface. The heat being radiated today from the solar surface was created in the solar interior about 40,000 years ago [4].
Although most of our effort in this paper is directed toward new experiments, the most surprising result is that the solar neutrino flux is determined to % by the existing solar and reactor experiments if one imposes the constraint that the luminosity of the Sun is produced by fusion reactions among light elements that also produce solar neutrinos (the so-called ‘luminosity constraint’). The best-fit value of the flux inferred from a global fit to existing neutrino experiments and the luminosity constraint is within 2% of the flux predicted by the BP00 standard solar model.
1.1 Historical perspective
The first forty years of solar neutrino research has demonstrated that new physics may appear when we carry out neutrino experiments in a new domain of sensitivity. Most of the new experiments considered in this paper will be sensitive to neutrino energies that are less than or of the order of 1 MeV, a domain in which solar neutrino energies could not previously be measured. More than 98% of the predicted flux of solar neutrinos lies below 1 MeV.
One of the primary reasons for carrying out the new experiments is to test whether new physics shows up at lower energies. As stated earlier, our explorations in this paper are intended as a guide to the expected in order that they can be used to help identify the unexpected.
Moreover, we want to use solar neutrino experiments for their original purpose [5]: to test theoretical models of how a main sequence star gains energy and evolves by burning hydrogen to helium. To do this, we must have sufficient experimental data to measure the total neutrino fluxes that are produced by the principal neutrino-producing nuclear reactions. Until very recently, it was necessary to assume the standard solar model predictions for all the solar neutrino fluxes and their uncertainties in order to determine reasonably constrained values for neutrino oscillation parameters. Only after the results of the Super-Kamiokande and SNO experiments became available was it possible to measure directly the 8B neutrino flux. However, even now, the other solar neutrino fluxes must be taken from standard solar model calculations in order to obtain the well-constrained global solutions for neutrino oscillation parameters that are seen so frequently in the literature [2, 3].
A study similar to what we carry out in this paper was performed in 1996; the earlier investigation provides historical perspective. In 1996, only the chlorine [6], SAGE [7], GALLEX [8] and Kamiokande [9] experimental results were available. In a paper entitled [10] ‘How well do we (and will we) know solar neutrino fluxes and oscillation parameters?’, the authors found seven years ago that the small mixing angle (SMA) solution was slightly preferred over the LMA and vacuum oscillation solutions. All three, SMA, LMA, and vacuum oscillations, were allowed at . The uncertainties in the solar neutrino fluxes were large. At 95% C.L., the uncertainties were a factor of two for the neutrino flux and a factor of five for the 8B neutrino flux. The 7Be solar neutrino flux could be as large as 6.4 times the 1995 standard solar model prediction. In this investigation, there were only enough experiments to permit treating one flux at a time as a free parameter. The other neutrino fluxes and their uncertainties were required to be consistent with the 1995 standard solar model [11]. The principal constraints on the and 7Be neutrino fluxes were established by the luminosity constraint [12], not the then existing solar neutrino experiments. In 2001, Garzelli and Giunti [13] performed a Bayesian analysis independent from the Standard Solar Model (SSM) predictions for the solar fluxes. The luminosity constraint was used to obtain the posterior distributions of , 7Be and 8B neutrino fluxes in agreement with BP00 predictions [14]. At 90% C.L., the allowed ranges were [0.99,1.08], [0.02,1.15], [0.62,1.22] for , 7Be, and 8B neutrino fluxes (in units of BP00), respectively.
With the extensive results of three additional experiments, Super-Kamiokande [15], SNO [16, 17], and KamLAND [18], we now know–or think we know–a great deal more. But, the enormous change in the consensus view about solar neutrinos that has been caused by the data from just three new experiments provides an additional caution that surprises may appear in the future.
1.2 The theme of this paper
The theme of this paper can be stated simply: the astrophysics of the solar interior and the physics of neutrino propagation both deserve to be explored independently, not assumed. We investigate the extent to which existing data and future experiments constrain separately both the stellar astronomy and the neutrino physics.
A key step in our analysis is the imposition of the luminosity constraint [12, 19], which implements in a global way for the Sun the constraint of conservation of energy for nuclear fusion among light elements. Each neutrino flux is associated with a specific amount of energy released to the star and therefore a particular linear combination of the solar neutrino fluxes is equal to the solar luminosity (in appropriate units). One can write the luminosity constraint as
| (1) |
where is the solar luminosity measured at the earth’s surface, 1 is the average earth-sun distance, and the coefficient is the amount of energy provided to the star by nuclear fusion reactions associated with each of the important solar neutrino fluxes, . The coefficients are calculated accurately in ref. [12].
In this paper, we present results that are obtained with and without imposing the luminosity constraint, in order to illustrate the power of the constraint.
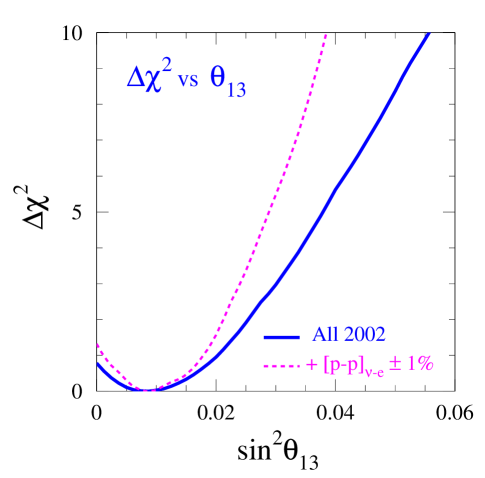
We include in our global analyses reactor [18] and solar neutrino data [6, 7, 8, 20, 15, 16, 17]. We marginalize all the results quoted in this paper over the mixing angle using the calculated dependence of the global as a function of the dominant neutrino oscillation parameters, and , the solar neutrino fluxes, and . For earlier calculations of the dependence of on , see refs. [21, 22, 23], especially figure 7 of ref. [22] and figure 4 of ref. [23]. We use in this paper the dependence shown in figure 2 that is adapted from ref. [24].
We investigate in this paper the extent to which the inferred values of the neutrino oscillation parameters are dependent upon the common assumption that the solar neutrino fluxes have the best-estimate values and uncertainties determined from the standard solar model [14]. Throughout this paper, we present results in which the 8B solar neutrino flux is treated as a free parameter. In the latter sections of the paper, we present results in which also the 7Be solar neutrino flux, and later the and CNO neutrino fluxes, are treated as free parameters.
We begin our investigation by determining how well the existing set of solar and reactor neutrino experiments constrain the solar neutrino fluxes and the solar neutrino oscillation parameters. Most of this paper is, however, devoted to experiments that are currently being planned or developed [25]. We explore how well future solar neutrino experiments can be expected to determine neutrino fluxes and oscillation parameters, all provided there are no major new surprises.
1.3 Organization of this paper
1.3.1 Advice for generalists and specialists
A quick glance at the table of contents will be useful for both generalists and specialists. We have written the titles of the sections and the subsections so that one can easily see what subjects are covered and in what context.
General readers will find everything they want to learn from this paper in our discussion section, section 9. We answer in section 9.1 the question: Why do low energy solar neutrino experiments? And in section 9.2, we summarize the principal results and ideas that are discussed in the main text. We give our view of what does it all mean in section 9.3.
There are many detailed results and explanations that could not be included in section 9. For the reader who is a specialist in a particular area related to solar neutrino research, we nevertheless recommend reading first the discussion section 9 and only afterwards selecting a particular topic from the list of section topics described below or from the table of contents.
1.3.2 Topics discussed in each section
We present in section 2 the approximate analytic behavior of the electron-neutrino survival probability, , for the LMA oscillation solution. A number of the results in this paper can be understood qualitatively by referring to figure 1 of section 2.
Section 3 describes some of the technical details that we use later in the paper, including the input experimental data, the ingredients of the global , the relationship between the two-neutrino and three neutrino survival probabilities, and the simulations we make of future KamLAND and SNO data. The details of section 3 are primarily of interest to experts on neutrino oscillations and can be skipped by the general reader who just wants to know the scientific implications of our investigations.
We use in section 4 all of the available solar and reactor neutrino data to determine the current constraints on neutrino oscillation parameters and solar neutrino fluxes (see especially table 4 and figure 3). The global analyses in this section evolve in steps from treating only the 8B neutrino flux as free, to letting both the 7Be and 8B fluxes be free parameters, to the most powerful method: treating all of the neutrino fluxes as free parameters subject to the luminosity constraint. We also analyze in this section simulated data for three years of operation of KamLAND and show how these additional data are expected to improve our knowledge of oscillations parameters and fluxes.
We explain in section 5 the reason why the luminosity constraint helps provide a powerful bound on the solar neutrino flux, but imposes only a relatively weak constraint on the 7Be solar neutrino flux.
Section 6 and section 7 provide our best answers to the questions that experimentalists planning future solar neutrino measurements most often ask us. These sections address the parallel questions: What will we learn from a 7Be solar neutrino experiment? What will we learn from a solar neutrino experiment? In order to answer these questions, we analyze simulated data for 7Be and solar neutrino experiments.
We show in section 6 that the current predictions for a 7Be solar neutrino experiment depend sensitively on whether or not one assumes the correctness of the best-estimate neutrino fluxes, and their uncertainties, that are predicted by the standard solar model. Table 6 shows that we will be stuck with a large experimental uncertainty in the flux of 7Be solar neutrinos unless a 7Be solar neutrino experiment accurate to % is performed. Fortunately, a 7Be solar neutrino experiment will also provide a powerful constrain on the solar solar flux via the luminosity constraint.
We show in section 7 that a measurement of the neutrino-electron scattering rate must be very accurate, %, in order to significantly improve our knowledge of the or the solar neutrino fluxes (see especially table 8). If this accuracy is achieved, then the allowed range for will be reduced by a factor of two. We demonstrate also in this section that a measurement of the neutrino flux would be about as informative as a measurement of the neutrino flux.
We answer in section 8 two important questions: At what level is maximal mixing excluded by current data? How will the SNO salt-phase data affect the exclusion of maximal mixing?
2 MSW at high energies, Vacuum at low energies
The effective Hamiltonian for two-neutrino propagation in matter can be written conveniently in the familiar form [1, 26, 27, 28, 29, 30]
| (2) |
Here and are, respectively, the difference in the squares of the masses of the two neutrinos and the vacuum mixing angle, is the energy of the neutrino, is the Fermi coupling constant, and is the electron number density at the position at which the propagating neutrino was produced. The best-fit values for and obtained from a global solution to all currently available solar neutrino and reactor anti-neutrino experimental data are (see table 4, the third row) and .
The relative importance of the MSW matter term and the kinematic vacuum oscillation term in the Hamiltonian can be parameterized by the quantity, , which represents the ratio of matter to vacuum effects. From equation 2 we see that the appropriate ratio is
| (3) |
The quantity is the ratio between the oscillation length in matter and the oscillation length in vacuum. In convenient units, can be written as
| (4) |
where is the electron mean molecular weight (, where X is the mass fraction of hydrogen) and is the total density, both evaluated at the location where the neutrino is produced. For the electron density at the center of the standard solar model, for MeV and .
For the LMA region, the daytime survival probability can be written to a good approximation in the following simple form [1, 26, 27, 28, 29, 31]
| (5) |
where the mixing angle in matter is
| (6) |
Figure 1 illustrates the energy dependence of the LMA survival probability, . If (for solar neutrino oscillations), the survival probability corresponds to vacuum averaged oscillations,
| (7) |
If , the survival probability corresponds to matter dominated oscillations,
| (8) |
The survival probability is approximately constant in either of the two limiting regimes, and . The LMA solution exhibits strong energy dependence only in the transition region between the limiting regimes.
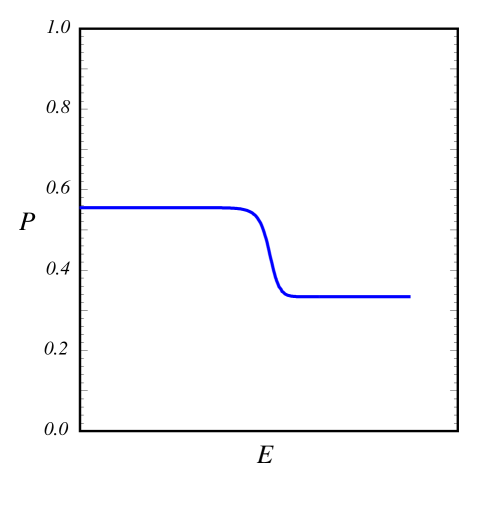
At what neutrino energy does the transition take place between vacuum oscillations and matter oscillations? The answer to this question depends upon which neutrino source one discusses, since the fraction of the neutrino flux that is produced at a given radius (i.e., density and ) differs from one neutrino source to another. The 8B neutrinos are produced at much smaller radii (higher densities) than the neutrinos; the 7Be production profile is intermediate between the 8Be and neutrinos. According to the BP00 solar model, the critical energy at which is, for ,
| (9) |
The actual energies for and 7Be neutrinos are below the critical energy where they are produced. To a very good approximation, 8B neutrinos are always in the MSW regime, while and 7Be neutrinos are in the vacuum regime. The energies are so low for and 7Be neutrinos, that the energy dependence of the vacuum oscillations, , averages very close to one-half in any measurable energy interval. To a good approximation, the survival probability is given by equation 7 for both 7Be and neutrinos.
The fact that the survival probability in equation 7 is independent of explains why the 7Be and experiments discussed in section 6 and section 7 are insensitive to . We shall show in section 7 that a precise experiment can be sensitive to .
The rather low critical energy for 8B neutrinos explains why spectral distortions are difficult to measure in Super-Kamiokande and SNO with present thresholds . However, a distortion should be measurable if the threshold can be lowered by 1-2 MeV.
3 Some technical remarks
In this section, we describe some technical aspects of our analysis and introduce some of the notation. This section can be skipped by readers who do not suffer from acute addiction to the details of neutrino oscillation analyses. Where necessary in the remainder of the text, we refer back to this section for definitions or for specific procedures.
We summarize in section 3.1 (see especially table 1) the existing experimental data used in latter sections to carry out global analyses of solar and reactor neutrino experiments. In section 3.2, we describe the global we have used and define the free parameters in . In particular, we define in section 3.2 the reduced neutrino fluxes, (8B neutrinos), (7Be neutrinos), and ( neutrinos). We define in section 3.3 the effective survival probability after marginalizing over . In section 3.5, we describe how we simulate KamLAND data for three years of operation. Finally, in section 3.6 we describe how we simulate the SNO data that will result from the salt-phase measurements.
3.1 Experimental data
Table 1 summarizes the solar (S) [6, 7, 8, 16, 17, 20] and KamLAND (K) data [18] used in our global analyses that are presented latter in this paper. The total number of data used in the analyses is 96; the number of data derived from each experiment are listed (in parentheses) in the second column of the table. In the third column, labeled Measured/SM, we list for each experiment the quantity Measured/SM, the measured total rate divided by the rate that is expected based upon the standard solar model and the standard model of electroweak interactions.
| Experiment | Observable ( Data) | Measured/SM | Reference |
|---|---|---|---|
| Chlorine | Average Rate (1) | [CC]= | [6] |
| SAGE+GALLEX/GNO† | Average Rate (1) | [CC]= | [7, 8, 20] |
| Super-Kamiokande | Zenith Spectrum (44) | [ES]= | [15] |
| SNO (pure D2O phase) | Day-night Spectrum (34) | [CC]= | [16, 17] |
| [ES]= | [16, 17] | ||
| [NC]= | [16, 17] | ||
| SNO (salt phase) | Average Rates (3) | [CC]= | [33] |
| [ES]= | [33] | ||
| [NC]= | [33] | ||
| KamLAND | Spectrum (13) | [CC]= | [18] |
3.2 Global , free parameters, and reduced solar neutrino fluxes
We calculate the global by fitting to all the available data, solar (83 measurements) plus reactor (13 measurements). Formally, the global can be written in the form [34, 35]
| (10) | |||||
Depending upon the case we consider, there can be as many as nine free parameters in , including, , , , , and (3 CNO fluxes, see below). The neutrino oscillation parameters have their usual meaning. The reduced fluxes , , , and are defined below. The parameter describes departures from two-neutrino oscillations. In general, is a vector defined by several parameters. If we consider the standard scenario of three flavors, the higher mass squared averages out and .
The function depends only on , and . We discuss in section 2.2 of ref. [2] our procedure for analyzing the data from the KamLAND experiment.
For most of the calculations described in this paper, we marginalize making use of the function that was obtained in the updated analysis [24] of atmospheric [36], K2K accelerator [37], and CHOOZ reactor [38, 39] data (see also, refs. [22, 21, 23]). Figure 2 (which is the same as Fig. 3c of ref. [24]) shows the specific dependence upon that we use. This formulation takes account of all the available data from solar, reactor, and accelerator neutrino oscillation experiments. We have not assumed, as is often done, a flat probability distribution for all values of below the CHOOZ bound. The fact that we take account of the actual experimental constraints on decreases the estimated influence of compared to what would have been obtained for a flat probability distribution.
We have included in our analysis the possibility of an active-sterile admixture and in that case , where describes the possibility that oscillates into a state that is a linear combination of active () and sterile () neutrino states,
| (11) |
This admixture arises in the framework of 4- mixing [40]. The analysis procedure we follow in the case of a non-zero admixture of sterile neutrinos is described in section 3.3.2 of ref. [2]. For this case only, we assume .
We follow the usual convention and represent the reduced 8B solar neutrino flux by the parameter here is the ratio of the true flux to the flux predicted by the standard solar model. Thus
| (12) |
Here [14]. We define the reduced 7Be neutrino flux, , by analogy with . Thus
| (13) |
where with a uncertainty of %. The reduced neutrino flux is defined by
| (14) |
where [14] with a uncertainty of %.
Similarly, we define reduced 13N,15O and 17F neutrino fluxes that we parameterize by . We have checked that different limiting cases in the relative weights of the 13N, 15O and 17F fluxes (see discussion in ref. [41]) do not affect the accuracy of our results.
3.3 Survival probability and
The survival probability of electron neutrinos in the case of three neutrino oscillations, , can be simply related to the survival probability, , for two neutrino oscillations by the equation [42]
| (15) |
The effect of , the mass difference squared characteristic of atmospheric neutrinos, averages out in equation 15 for the energies and distances characteristic of solar neutrino propagation. The effective two-neutrino problem is solved with a re-normalized electron density . The results from the CHOOZ reactor experiment [38, 39] place a strong upper bound on , implying that is close to or close to . Atmospheric and solar data select the first option ( close to and close to ). Thus the main effect of a small allowed on the survival probability is the introduction of the factor in equation 15.
In what follows, we shall use ‘survival probability’ and to denote . Where numerical results are reported, we marginalize over . At all points in oscillation parameter space, we use the value of that minimizes for that set of parameters.
3.4 Marginalization for predicted event rates
In order to calculate properly the allowed ranges of the reduced event rates for (defined in equation 29) or (defined in equation 39), we first evaluate a global minimum . We then calculate, for example, and at each of many points in the multi-dimensional input parameter space. From this data set, we construct the minimum value of at each value of . Thus we are able to construct a function . We determine the allowed range of by selecting the values of that produce the appropriate for the specified confidence limit and 1 d.o.f.
3.5 Simulated KamLAND data
We simulate three years of KamLAND measurements using the data provided in the KamLAND paper [18]. We multiply by nine the number of events for all the prompt energy bins above 2.6 MeV. Following the KamLAND collaboration, we limit our analysis to energy bins above 2.6 MeV in order to eliminate the geo-neutrino background. The energy bins above 6 MeV contain zero events in the first KamLAND results. For these bins, we simulate the expected signal in 3 years of KamLAND data by using the number of events predicted by the present best fit oscillation solution (, ) for all the available solar plus KamLAND data.
3.6 SNO salt phase data
In the analyses presented in this paper, we have included the salt-phase SNO data [33] and the refined GNO [20] and SAGE [7] data, all released on September 7, 2003. Every one of the analyses performed in this paper was carried out with (in the current version of the paper) and without (in the previous version, hep-ph/0305159,v2) the new SNO, GNO, and SAGE data. Performing the analyses with and without the new data allowed us to double check all our conclusions and to verify that the departure from maximal mixing was the only physical variable whose value or statistical significance was much affected by the addition of the new data222In the version of this paper that was posted on the archive on June 19, 2003 and that was submitted for publication prior to the availability of the recently released SNO salt-phase data, we made best-estimate simulations of the expected salt-phase measurements (see hep-ph/0305159,v2, section 3.6). We shall see in section 8.2 that these simulations turned out to be accurate and the conclusions that were deduced from the simulations are in agreement with those derived by the SNO collaboration from the actual measurements. The agreement between the simulations and the measurements for the SNO salt-phase provides circumstantial evidence that the simulations we make later in this paper for other experiments actually capture the essential features of those new experiments. Readers interested in simulating solar neutrino measurements may profit by reading section 3.6 of hep-ph/0305159,v2 to see what are the essential ingredients of an accurate simulation of the SNO data..
In this version of our paper, we have included the charged current, neutral current, and elastic scattering rates [33] as determined by the SNO collaboration, where the spectral distributions of electron scattering and charged current events are not constrained by the known shape of the 8B neutrino energy spectrum. We treated the errors in the salt phase measurements as described in the detailed user guide written by the collaboration [43]; we no longer need to use our simulations of the SNO salt-phase data.
4 Solar plus KamLAND constraints
What can we say today about neutrino oscillation parameters and solar neutrino fluxes using a global analysis of all the existing data on solar and reactor neutrino experiments? And, what improvements can we expect in our knowledge of the oscillation parameters and neutrino fluxes after three years of data taking by the KamLAND collaboration?
Using a global analysis, we determine in section 4.1 the allowed regions of neutrino oscillation parameters and the 8B solar neutrino flux assuming that the 8B neutrino flux is a free parameter. In this subsection, we assume that all solar neutrino fluxes except the 8B neutrino flux are described well by the standard solar model calculation [14] of their best-estimates and uncertainties. Allowing both the 7Be and the 8B neutrino fluxes to be free parameters, we repeat the global analysis in section 4.2. We discuss in section 6.1 the changes in the predictions for future solar neutrino experiments that are caused by allowing the 7Be neutrino flux to vary freely.
The most dramatic result is obtained in section 4.3. In this subsection, we impose the luminosity constraint while allowing the , 7Be, 8B, and CNO neutrino fluxes to vary freely. The existing solar neutrino and KamLAND experiments constrain the total flux to % ()and are in agreement with the standard solar model prediction [14] within the calculated error.
We present in section 4.4 the constraints on the sterile neutrino fraction of the 8Be neutrino flux that are implied by the existing solar and KamLAND data. We also evaluate the effect of three years of simulated KamLAND data on the expected bound for the sterile fraction of the 8B neutrino flux.
We investigate in section 4.5 the extent to which solar neutrino and reactor data can constrain the CNO contribution to the solar luminosity and in section 4.6 we show that neutrino observations alone can provide a 20% measurement of the total solar luminosity.
All our of investigations in this section show that we will be stuck with a large uncertainty in the experimentally-determined 7Be solar neutrino flux until a dedicated 7Be solar neutrino experiment is performed.
For the reader who is mainly interested in the bottom line, we recommend jumping directly to section 4.3.
4.1 8B neutrino flux as a free parameter
Figure 3 shows the allowed region for the neutrino oscillation parameters and that is obtained by a global fit to all of the existing solar plus KamLAND data. In addition, the figure shows the reduction in the allowed region that may be expected if the KamLAND experiment takes data for a total of three years.
| Analysis | |||
|---|---|---|---|
| S’ + K (before) | () | () | () |
| S + K (after) | () | () | () |
| S + K 3 yr | () | () | () |
Table 2 shows the allowed ranges at () of the 8B solar neutrino flux and the neutrino oscillation parameters and . In table 2, we follow the usual convention and represent the 8B solar neutrino flux by the parameter , where is the ratio of the true flux to the flux predicted by the standard solar model as defined in eq. 12.
The comparison of the first and second rows of table 2 shows the impact of the recent SNO [33], GNO [20], and SAGE [7] data, especially the recently released SNO salt phase data [33, 43]. The positive uncertainty in is decreased by a factor of 4.5. The solar data before (after) the SNO salt phase release disfavors the higher LMA island less (more) than . The SNO salt phase data also improved significantly our knowledge of , especially the higher values; the uncertainty in is decreased by a factor of order 1.5. Moreover, the and uncertainties in are decreased by a 25%.
The ranges of and are slightly different in figure 3 and in table 2. Figure 3 was constructed by marginalizing over and ; the confidence level for the figure was calculated for two degrees of freedom. In constructing each column of table 2, we marginalized over all of the variables except the one whose range is listed; the confidence levels for the table were calculated for one degree of freedom.
The longer operation of the KamLAND experiment will shrink significantly the uncertainties in . The () uncertainty in is expected to decrease by a factor of order 2 (2.5). The expected improvements in our knowledge of and of the 8B neutrino flux are much more modest.
4.2 7Be and 8B neutrino fluxes as free parameters
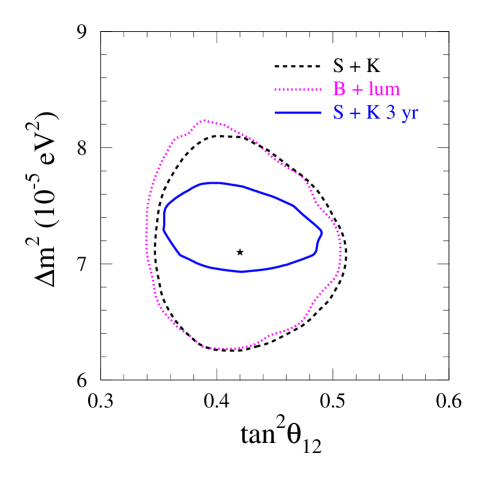
Table 3 shows how the allowed range of the oscillation parameters and the solar neutrino fluxes change when the flux of 7Be solar neutrinos is treated as a free parameter. Figure 5 shows the contours in the allowed oscillation parameter plane for the case in which the 7Be solar neutrino flux is treated as a free parameter (dashed curve) and also for the case in which the 7Be neutrino flux is constrained to have the standard solar model best-fit value and uncertainty (dotted curve). These two extreme treatments of the 7Be solar neutrino flux produce very similar allowed regions in the - plane.
The allowed ranges of , , and are only marginally affected by letting the 7Be neutrino flux vary.
However, the first row of table 3 shows that the current experimental uncertainty in the reduced 7Be neutrino flux, (see eq. 13), is a factor of 2.3 times larger than the quoted theoretical uncertainty in the standard solar model calculation of the 7Be neutrino flux. Moreover, table 3 shows that the experimental uncertainty in determining the 7Be solar neutrino flux is not expected to decrease significantly as a result of running the KamLAND experiment for three years. The KamLAND experiment does not provide a strong constraint on the oscillation probability for neutrinos with energies comparable to the MeV possessed by the 7Be solar neutrinos.
| Experiments | ||||
|---|---|---|---|---|
| S + K | () | () | () | () |
| S + K 3 yr | () | () | () | () |
We have carried out global solutions with and without including the measurement [6] of the solar neutrino capture rate in chlorine (cf. table 5). The purpose of these calculations was to determine how sensitive to a single experiment are the current inferences regarding neutrino oscillation parameters and solar neutrino fluxes. In our view, the implications of solar neutrino experiments are too important to rest solely on the results of a single measurement. Including the chlorine experiment causes only a modest improvement in the allowed ranges, of order 10%, for the neutrino oscillation parameters and for the 8B neutrino flux. However, the chlorine measurement affects significantly the best-fit value for the 7Be neutrino flux and the inferred uncertainty in this flux. With the chlorine experiment, (), while without the chlorine measurement (). The chlorine measurement drives down the best-estimate for by about 30% and decreases the error on by almost 30% .
4.3 All neutrino fluxes as free parameters plus luminosity constraint
| Analysis | ||||
|---|---|---|---|---|
| A | () | () | () | () |
| A + lum | () | () | () | () |
| B + lum | () | () | () | () |
Table 4 presents the results of global analyses in which the solar neutrino flux, as well as the 7Be and 8B solar neutrino fluxes, are treated as free parameters. This is the first table in which we show results obtained with and without imposing the luminosity constraint [12]. Cases in which the luminosity constraint are included are denoted by ‘+ lum’ in the table.
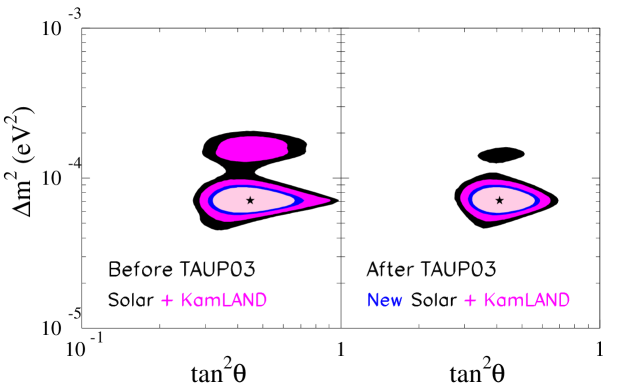
Figure 4 illustrates (primarily) the impact of the SNO salt-phase data [33] announced at the TAUP03 conference on September 7, 2003. The left panel of the figure shows the allowed oscillation regions (at %, %, %, and % () ) before the salt-phase data were announced and the right panel shows the currently allowed oscillation regions.
4.3.1 Neutrino fluxes without the luminosity constraint
The first row of table 4, which was calculated without including the luminosity constraint, should be compared with the second row of table 2 and the first row of table 3. The accuracy with which the global solution appears to determine the solar neutrino fluxes degrades as more free neutrino fluxes are varied in the analysis. For example, the quoted BP00 error on the predicted 7Be neutrino flux is % (), whereas the experimental determination is only accurate to % when the 7Be neutrino flux is treated as a free parameter. Similarly, the SSM uncertainty on the predicted neutrino flux is %, but the flux is only determined experimentally to %. The 8B solar neutrino flux, which is primarily determined by the SNO and Super-Kamiokande measurements, is not affected much by treating additional neutrino fluxes as free parameters. The accuracy with which and are determined is also not affected significantly by adding more free fluxes.
The luminosity constraint is grossly violated if we allow the , 7Be, and 8B neutrino fluxes to vary as free parameters without requiring that the total luminosity equal the observed luminosity. The first row of table 4 shows that the best-fit value for the neutrino flux is in this case, whereas the maximum value allowed by the luminosity constraint is (see equation 28).
4.3.2 Neutrino fluxes with the luminosity constraint
The constraints on the neutrino flux are dramatically improved, by more than a factor of ten, when the luminosity constraint is applied. This improvement is independent of whether the CNO neutrino fluxes are assumed to have their standard solar model best-fit and uncertainties (row two of table 4) or whether the CNO fluxes are treated as free parameters (row three of table 4). Remarkably, the solar neutrino flux is known at present to % (1 uncertainty) and is in agreement to that accuracy with the prediction of the standard solar model 333The results given here should be compared with an insightful analysis given in section VI of ref. [7]. The authors of ref. [7] made a series of simplifying assumptions in analyzing the pre-KamLAND solar neutrino data and obtained . The principal assumptions made in this analysis, which did not include a global treatment of all the experiments together, included assuming the correctness of the BP00 fluxes for the 7Be, CNO, and neutrinos and the constancy of the survival probability for all of these neutrinos. Although the authors suggest that their uncertainty may be underestimated, their reasoning shows clearly how the gallium experiments constrain the neutrino flux.
The constraints on the 7Be neutrino flux are not improved by imposing the luminosity constraint. The luminosity constraint affects differently the and 7Be solar neutrino fluxes. We shall explain the origin of this difference in section 5. However, the alert reader may notice a counter-intuitive result shown in column 4 () of table 4. The uncertainties are actually larger for when the luminosity constraint is imposed. The reason for this anomalous behavior is that the global is smaller () for case A of table 4 (without the luminosity constraint) than the global (80.4) found for case A plus the luminosity constraint. The uncertainties at a fixed confidence level () are calculated by computing the range of allowed by the relation .
The CNO fluxes are poorly constrained by the available solar neutrino data (cf. ref. [41]). In all cases, that we have considered the favored solution has the 13N, 15O, and 17F solar neutrino fluxes all equal to zero. The 15O flux is the best determined of the CNO solar neutrino fluxes. We find in units of the standard solar model prediction [14] that
| (16) |
The constraint given in equation 16 is unaffected, to the accuracy shown, by whether or not the luminosity constraint is imposed.
At , the 13N solar neutrino flux could be as large as times the standard solar model prediction and the 17F neutrino flux could be as large as 220 times the solar model prediction.
4.3.3 Allowed oscillation solutions: with and without the luminosity constraint
In ref. [2], the authors found that, using the existing solar plus KamLAND data, only the LMA oscillation solution is allowed at 4.7 . Repeating the same analysis but including the SNO salt phase data and the other new solar neutrino data [7, 33, 20], we find that only the LMA oscillation solution is allowed at 5.2 .
All other solar neutrino oscillation solutions (e.g., LOW, VAC, SMA) are excluded. In the analysis described in ref. [2] and in other similar discussions (see, e.g., ref. [3]), the solar neutrino fluxes and their uncertainties were either all taken from the standard solar model or all of the fluxes except the 8B neutrino flux were taken from the standard solar model.
If, instead, all solar neutrino fluxes are regarded as free parameters and the luminosity constraint is imposed, we find that the LMA oscillation is the only allowed solution at 4.5 .
All solutions in which the neutrino energy spectra are undistorted, i.e., all solutions without some form of neutrino oscillations (what used to be called ‘non-standard solar models’), are disfavored at [12].
The existing constraints on the 7Be and neutrino fluxes result from the chlorine [6] and gallium [7, 8, 20] solar neutrino experiments (cf. table 5). It is of interest to test separately the sensitivity of the inferred constraints on the neutrino fluxes by omitting either the chlorine or the gallium experiments from the global analysis (but imposing the luminosity constraint as in the third row of table 4). Omitting the chlorine experiment, we find that the constraints on , , and are essentially as stated in the third row of table 4, but that the constraints on the 7Be and neutrino fluxes are much relaxed:
| (17) |
Omitting the gallium experiment, we find
| (18) |
The chlorine experiment has a stronger effect on the constraints than does the gallium experiment.
Figure 3 shows that the uncertainties in determining and from existing data are not affected significantly by whether only the 8B neutrino flux is treated as a free variable or whether, instead, all the fluxes are treated as free variables subject to the luminosity constraint. In both cases, the allowed ranges are practically the same (cf. the second row of table 2 with the last row of table 4).
4.4 Sterile neutrinos
We can parameterize the sterile contribution to the neutrino flux in terms of or, alternatively, in terms of a derived parameter , the sterile fraction of the 8B neutrino flux (see discussion in section 3.2 and the more complete description in ref [2]).
The 1 allowed range for the active-sterile admixture is
| (19) |
in our analysis of the existing solar plus KamLAND data (cf. the first row of table 2). The fundamental parameter describing the sterile fraction is (cf. section 3.2 and ref [2]). However, it is convenient to think in terms of a sterile fraction of the flux, , which is potentially observable in the Super-Kamiokande and SNO experiments. This range corresponds to
| (20) |
Three years of accumulation of data by KamLAND (the S + K 3 yr second row of table 2) can marginally improve this bound to
| (21) |
or
| (22) |
On the other hand, if we impose the luminosity constraint while allowing the , 7Be, 8B, and CNO neutrino fluxes to vary freely (analysis B + lum in table 4), our present bounds are slightly weaker. In this case, we find
| (23) |
or
| (24) |
4.5 CNO luminosity
How much of the solar luminosity is due to the carbon-nitrogen-oxygen (CNO) nuclear fusion reactions that Hans Bethe suggested in 1939 are primarily responsible for energy generation in the Sun?
In ref. [41], the authors derived () constraints on the allowed range of the CNO contribution to the solar luminosity using all the presently existing solar neutrino and KamLAND experimental data. Imposing the luminosity constraint and carrying out a global analysis of the ratio of the CNO-produced luminosity to the total luminosity, they found [41]
| (25) |
We have carried out a similar global analysis but using simulated three years of data for KamLAND. The results summarized in equation 25 are not affected, to the accuracy shown, by the additional simulated KamLAND data.
For completeness, we have also carried out a global analysis allowing the fluxes to be free but without imposing the luminosity constraint. We find
| (26) |
The best-estimate values given in equation 25 and equation 26 are different. If the luminosity constraint is not imposed, then the global solution prefers a non-zero value for the CNO luminosity that is just slightly larger than the standard solar model best-estimate of 1.5%. The low-energy neutrinos that are required to fit the radiochemical experimental data are provided in this case by the CNO reactions. Moreover, the chlorine and gallium experiments suggest a preferred value of zero for the 7Be solar neutrino flux (see case A of table 4).
However, if the luminosity constraint is imposed, then the 7Be solar neutrino flux cannot easily be zero and the required low energy neutrinos are produced by 7Be electron capture (see case ‘B + lum’ of table 4 and the approximate form of the luminosity constraint, equation 28). In this case, the radiochemical experiments prefer a zero-value for the CNO luminosity.
4.6 Total luminosity measurement with neutrinos
What limits do existing solar plus reactor neutrino experiments place on the total luminosity of the Sun?
Each solar neutrino flux, , corresponds to a well-defined flux of energy, , where the energy coefficients are given in table 1 of ref. [12]. This energy is, of course, much larger than the actual energy of the neutrinos since most of the energy from solar fusion reactions is released to the star in the form of thermal energy and eventually radiated away in the form of photons (see discussion in ref. [12]).
We have performed a global analysis of all the available solar and reactor data to find the () allowed range for the total flux of solar luminosity, , based solely upon the neutrino data. We find for the ratio of the neutrino-inferred solar luminosity, , to the accurately measured photon luminosity, , that
| (27) |
At , the neutrino-inferred solar luminosity can be as large as (as small as) 2.1 (0.8) the precisely measured photon-luminosity. Three years of KamLAND data is expected to improve the limits stated in equation 27 by only about 10%.
4.7 Predictions for the radiochemical chlorine and gallium experiments
Table 5 summarizes the predictions for the radiochemical solar neutrino experiments of the LMA solution that are inferred from the existing solar neutrino and KamLAND experiments. The predictions are based upon the global analyses for which the best-fit neutrino oscillation parameters are listed in the first row of table 2 (and the third row of table 4, free solar neutrino fluxes plus luminosity constraint). The measured rate in the chlorine experiment is approximately () smaller than the best-fit LMA prediction.
| Source | Cl | Ga |
|---|---|---|
| (SNU) | (SNU) | |
| LMA | LMA | |
| 0(0) | 40.6 (41.8) | |
| 0.13(0.13) | 1.57 (1.61) | |
| 0.02(0.02) | 0.03 (0.03) | |
| 0.64(0.60) | 19.0 (17.9) | |
| 2.02(2.00) | 4.28 (4.23) | |
| 0.05(0.00) | 1.83 (0.00) | |
| 0.18(0.00) | 2.94 (0.00) | |
| 0.00(0.00) | 0.03 (0.00) | |
| Total |
5 How does the luminosity constraint affect the allowed range of solar neutrino fluxes?
The luminosity constraint states that a specific linear combination of all the neutrino fluxes that are produced by fusion reactions at a temperature of order 1 keV must be equal to unity. The precise coefficients for this linear combination are given in table 1 and equation 2 of ref. [12].
We can understand the strong effect of the luminosity constraint on the neutrino flux, and the relatively weak effect on the 7Be neutrino flux, by including only the largest terms in the luminosity constraint. We define a reduced neutrino flux to be the ratio of the true solar neutrino flux from a particular nuclear reaction to the neutrino flux predicted for this source by the BP00 solar model. If the standard solar model is a relatively good approximation to the actual Sun, then the leading terms in the luminosity constraint are
| (28) |
We see immediately from equation 28 that the luminosity constraint does not allow the flux to exceed, at any confidence level, 9% of the current standard solar model predicted flux. By contrast, if we do not impose the luminosity constraint, the best-fit value for is 1.49 not 1.0 and the maximum value of is 2.02 at (see the last column of table 4). The strong lower limit on follows from equation 28 because the chlorine and gallium solar neutrino experiments imply that can not be much larger than unity (cf. table 5).
The small coefficient of in equation 28 is the reason that the luminosity constraint does not impose tight constraints on the allowed 7Be solar neutrino flux, provided that the standard solar model is a reasonable approximation to the actual Sun. In principle, the 7Be solar neutrino flux could be as large as three times the predicted BP00 7Be neutrino flux without violating nuclear physics or energy constraints [12]. However, this would be true only for a real Sun that is very different from the standard solar model.
6 What will we learn from a 7Be solar neutrino experiment?
In this section, we investigate quantitatively what we may expect to learn from a measurement of the 7Be solar neutrino flux.
We begin in section 6.1 by comparing the differences in the predictions for future experiments caused by treating the 7Be and other solar neutrino fluxes as free parameters rather than by taking the fluxes, and their associated uncertainties, from the standard solar model. Then in section 6.2 we investigate how accurately a measurement of the 7Be solar neutrino flux is expected to determine neutrino oscillation parameters. We study in section 6.3 how accurately a 7Be experiment will determine solar neutrino fluxes. We determine in section 6.4 how well a 7Be neutrino-electron scattering experiment can constrain the CNO-produced luminosity of the Sun and in section 6.5 we show how accurately a 7Be neutrino-electron scattering experiment will help measure the total luminosity of the Sun. We compare in section 6.6 what can be learned from a 7Be CC experiment with what can be learned from a scattering experiment.
In all cases, we treat the 8B solar neutrino flux as a free parameter.
6.1 7Be free: Implications for future experiments
Whether or not is treated as a free parameter affects strongly the uncertainty, and the best estimate, of the predicted rate at which electrons scatter 7Be neutrinos or are absorbed in a CC experiment. We define the reduced 7Be scattering or CC (absorption) rate as follows:
| (29) |
where the denominator of equation 29 is the rate calculated with the BP00 7Be neutrino flux assuming no neutrino oscillations.
If we perform the global analysis of solar plus reactor experiments assuming that the BP00 calculation for the 7Be solar neutrino flux and its uncertainty are valid, then the predicted rate in a 7Be scattering experiment is, with () uncertainties:
| (30) |
Thus, if we use the solar model calculation of the 7Be neutrino flux and its uncertainty, then the predicted event rate for the 7Be rate experiment has a precision of %. The corresponding prediction for the reduced event rate in a CC (absorption) experiment with 7Be solar neutrinos is:
| (31) |
The precision of the CC prediction is comparable to what is obtained for a scattering experiment. The results given in equation 30 and equation 31 only make use of the currently available KamLAND data, but the results are practically the same if we use the three year simulated KamLAND result.
The result shown in equation 31 for the CC reaction includes only 7Be neutrinos from the 0.86 MeV electron capture line. On the other hand, the result for scattering that is given in equation 30 includes neutrinos from all the solar neutrino fluxes that produce recoil electrons with energies in the range 0.25-0.8 MeV. Most of the recoil electrons in the selected energy range are produced by 7Be neutrinos, although there are small contributions from CNO, , and neutrinos (whose fluxes are taken from the BP00 solar model [14]).
The situation is very different if we treat the 7Be solar neutrino flux as a free variable in the global analysis. In this case, using the existing KamLAND data and all the available solar data, we find:
| (32) |
and
| (33) |
The reason that the lower limit in equation 32 and equation 33 does not reach zero is that the CNO contribution between 0.2 MeV and 0.8 MeV is included, by definition, in .
The most important case allows all the neutrino fluxes to vary freely within the limits imposed by the luminosity constraint. With this experimental approach (cf. the third row of table 4), we find an even larger allowed range for the predicted rate of a 7Be solar neutrino experiment. For this ‘all free’ case, we obtain
| (34) |
| (35) |
The uncertainties are enormous for the predicted rates in 7Be experiments (cf. equations 34–35) if the solar neutrino fluxes used in the global fits to experiments are unconstrained by solar model calculations. The uncertainties in the predictions, % of the best-estimate value for the scattering rate (% for the CC rate), are more than an order of magnitude larger than the uncertainties in the predictions, % for the scattering rate (% for the CC rate), if the 7Be neutrino flux is constrained by the standard solar model prediction and uncertainties.
6.2 How accurately will a 7Be solar neutrino experiment determine neutrino oscillation parameters?
We suppose in this subsection that the scattering rate, , is measured and that the best-fit value coincides with the result obtained assuming the standard solar model [14] 7Be neutrino flux and the preferred values for and (cf. table 2 and equation 30). We have then carried out a global solution including all the currently available solar neutrino data, the simulated KamLAND three year data, and the hypothetical measurement of . We use the simulated three year data rather than the currently available one-year KamLAND data since it seems likely that the KamLAND reactor experiment will be completed before a 7Be solar neutrino experiment is completed.
We have imposed the luminosity constraint [12] on the solar neutrino fluxes when carrying out the global solution. We have treated the , 7Be, 8B, and CNO neutrino fluxes as free parameters.
| Experiments | |||
|---|---|---|---|
| S + K 3 yr | () | () | () |
| + Be | () | () | () |
| + Be | () | () | () |
| + Be | () | () | () |
| + Be | () | () | () |
| + Be | () | () | () |
Table 6 compares the globally allowed ranges of , and if a 7Be experiment is carried out with an accuracy of 30%, 10%, 5%, 3%, or 1% . For calibration, we also present in the first row of table 6 the allowed parameter ranges in the absence of a 7Be experiment.
The allowed ranges of and are, for all cases shown in table 6, and . The allowed range of changes only by a very small amount as a result of a precise 7Be solar neutrino experiment.
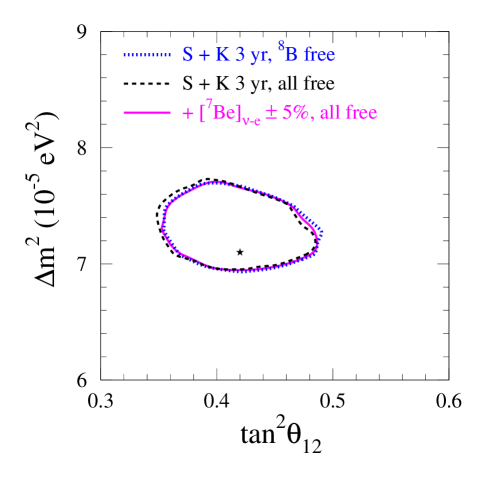
The solid curve in figure 5 represents the expected allowed region after a 5% measurement of . This ’post-7Be’ contour is not significantly smaller than the two other contours in figure 5. The two other contours represent the result of analyzing with different options all the current solar neutrino data plus three years of simulated KamLAND data. The two options are to allow all the solar neutrino fluxes to be free parameters, subject to the luminosity constraint, or to treat only the 8B solar neutrino flux as a free parameter.
We have also explored the effect of a 1% measurement of the 7Be neutrino-electron scattering rate on the existing bound for the sterile fraction, . We find that even a 1% 7Be experiment does not improve the existing limits derived in section 4.4.
We conclude that a measurement of the 7Be solar neutrino flux will not contribute much to the knowledge of the allowed region in oscillation parameter space unless there is additional new physics beyond neutrino oscillations or unless one of the previous solar neutrino experiments has a large previously unrecognized systematic uncertainty or bias.
6.3 How accurately will a 7Be neutrino experiment determine solar neutrino fluxes?
In the following subsection, section 6.3.1, we study what can be learned about the 7Be solar neutrino flux by measuring the 7Be scattering rate. In section 6.3.2, we investigate how much such 7Be experiments will tell us about the solar neutrino flux.
6.3.1 What do we learn about the 7Be solar neutrino flux?
If can be measured to an accuracy of %, then, according to table 6, the experimental knowledge of the 7Be solar neutrino flux will be improved by more than a factor of four over what will be known from the solar neutrino experiments plus three years of KamLAND reactor measurements. The experimental uncertainty in determining the 7Be solar neutrino flux would then be essentially equal to the current uncertainty in the standard solar model prediction of the 7Be neutrino flux. A 3% measurement of would lead to an improvement of a factor of eight in the accuracy with which the 7Be solar neutrino flux is known.
We conclude from a study of table 6 that a measurement of the 7Be scattering rate will lead to an enormous improvement in the experimental knowledge of the 7Be solar neutrino flux. Without a specific 7Be solar neutrino experiment, our empirical knowledge of the 7Be solar neutrino flux will be a factor of four less precise than the current uncertainty in the standard solar model prediction [% (experimental) versus % (standard solar model) ].
How sensitive are our quantitative conclusions to the assumed value for ? We have answered this question by carrying out global fits in which the assumed value for differs by from the current best fit. The results obtained for the ranges of the neutrino oscillation parameters and the solar neutrino fluxes by assuming the -different values are almost identical to the results shown in table 6 using our current best-prediction for .
6.3.2 What do we learn about the solar neutrino flux?
We have already seen from the discussion of table 4 that the solar neutrino flux is already known to an accuracy of % when the luminosity constraint is imposed. By comparing the first rows of table 4 and table 6 that additional measurements by KamLAND are not likely to reduce greatly the uncertainty in the experimental measurement of the flux.
However, a 7Be measurement can enormously improve our empirical knowledge of the neutrino flux. A measurement of to an accuracy of 5% will improve our experimental knowledge of the flux by a factor of four, to an extraordinary %. A 3% would reduce the experimental uncertainty to % , a factor of five improvement. No significant further improvement would be achieved by a 1% measurement.
6.3.3 What do we learn about the CNO solar neutrino fluxes?
A measurement of the 7Be solar neutrino flux would significantly improve our current very poor experimental knowledge of the CNO neutrino fluxes (cf. equation 16). Assuming a measurement of the 7Be neutrino flux accurate to 5% and three more years of operation of KamLAND, we find that the 15O flux (in units of the standard solar model prediction [14]) could be constrained to be
| (36) |
Thus a % measurement of the 7Be solar neutrino flux could improve the current () constraint on the 15O solar neutrino flux by a factor of five (two) (cf. equation 16). At , the 13N solar neutrino flux could be as large as times the standard solar model prediction and the 17F neutrino flux could be as large as 40 times the solar model prediction.
A measurement of the solar neutrino flux would not by itself significantly improve our knowledge of the CNO fluxes. For example, adding the data from a simulated % measurement of the neutrino flux would improve the upper limit given in equation 36 from 0.5 to 0.4 and the limit from 3.0 to 2.8 .
6.4 What do we learn about the CNO luminosity?
A measurement of the 7Be neutrino-electron scattering rate to an accuracy of 5% () will constrain the CNO luminosity to
| (37) |
The result shown in equation 37 is almost a factor of two improvement over the constraint that is obtained without a direct 7Be measurement (cf. equation 25 and equation 26). The constraint on the CNO luminosity will not be significantly improved by making a 7Be measurement that is more accurate than 5%.
Whether or not the luminosity constraint is included does not affect, to the accuracy shown, the result given in equation 37 .
6.5 How well can we constraint the total solar luminosity with a 7Be neutrino experiment?
Following the reasoning outlined in section 4.6, we can calculate the constraints on the total from neutrino experiments, assuming a measurement accurate to 5% of the 7Be neutrino-electron scattering rate. We find
| (38) |
The result given in equation 38 is not changed, to the accuracy shown, if we assume either a 3% or a 1% measurement of the 7Be neutrino-electron scattering rate.
6.6 Will we learn more or less from a CC 7Be experiment?
We have concentrated in this section on scattering experiments since the BOREXINO [46] and KamLAND [18] detectors are already well advanced toward measuring the 7Be neutrino-electron scattering rate. Moreover, there may be significant uncertainties in the CC cross section that are not present for the scattering measurement.
However, we note that a measurement with a CC detector with the same total experimental precision as for a scattering experiment would give comparable, actually somewhat better, precision. For example, for a common measuring error of a measurement of % (), the 7Be CC absorption rate would yield a determination of the total 7Be flux with an error (%, ) that is about three-quarters of the error (%) on the total 7Be neutrino flux that can be inferred from a scattering experiment. In both cases, the global analysis includes a fit to all the available solar neutrino plus KamLAND data.
7 What will we learn from a solar neutrino experiment?
To the best of our knowledge, Nakahata [47] first discussed in a systematic way the possibility of using a measurement of the scattering rate of solar neutrinos to determine more accurately the mixing angle represented by . In his discussion, Nakahata assumed that the total neutrino flux is given by the standard solar model with its associated uncertainties (% for the predicted neutrino flux) and therefore he did not apply the luminosity constraint.
In what follows, it is convenient to use the reduced scattering rate [or CC (absorption) rate] for neutrinos which is defined by the relation:
| (39) |
where the denominator of equation 29 is the rate calculated with the BP00 neutrino flux assuming no neutrino oscillations.
We assume throughout this section that the 7Be neutrino scattering rate has been measured to an accuracy of % and that the data are available for three years of operation of the KamLAND reactor experiment. From our current perspective, it seems likely that both the KamLAND reactor data and the 7Be solar neutrino data will be available before the completion of a solar neutrino experiment.
In section 7.1, we assume that the total neutrino flux, and the uncertainty in the flux, are calculated accurately using the standard solar model. Following Nakahata, we explore what can be learned from a precise measurement of the rate, , of neutrino-electron scattering of solar neutrinos if we have faith in the standard solar model predictions.
We consider a more rigorous and informative treatment in section 7.2. In this analysis, the , 7Be, 8B, and CNO neutrinos are treated as free parameters in a global analysis of all the data, with the data including simulated measurements of the and 7Be neutrino-electron scattering rates. We apply the luminosity constraint in the free-flux analysis described in section 7.2, obtaining simulated powerful limits on the neutrino flux and the range of .
We shall see that a measurement of to an accuracy better than % is required in order to significantly improve our experimental knowledge of . The main reason for the required high precision in the measurement of is that existing experiments plus the luminosity constraint already determine the total neutrino flux to % (see the last column of table 4).
We show in section 7.3 that a measurement of the neutrino-electron scattering rate will provide an accurate measurement of the total luminosity of the Sun from neutrino measurements alone.
In section 7.4, we present for neutrinos the current predictions for the rate of scattering and compare the power of measuring the scattering rate with the power of measuring the scattering rate.
7.1 Assuming the standard solar model neutrino flux
| Experiments | ||||
|---|---|---|---|---|
| S + K 3 yr +7Be | () | () | () | () |
| 5% | () | () | () | () |
| 3% | () | () | () | () |
| 1% | () | () | () | () |
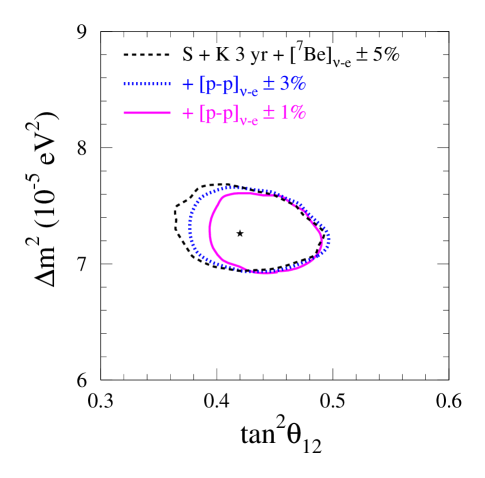
Table 7 shows what we can infer if we assume that the total flux is known to an accuracy of % from the standard solar model predictions.
We show in the table the results of a global analysis if the expected reduced scattering rate of neutrinos, , is measured to 5%, 3%, or 1% accuracy. The predicted rate for scattering with a 50 keV electron energy threshold is (see table 2 of ref. [2]):
| (40) |
We include in the global analysis that was used to construct table 7 all the presently known solar data, a simulation of three years of KamLAND measurements, and a measurement of the scattering rate of 7Be solar neutrinos, .
There are, according to table 7, only modest improvements in our knowledge of the neutrino oscillation parameters and the neutrino fluxes until the accuracy of the measurement becomes better than %. In other words, the measurement accuracy must be comparable to the quoted accuracy, %, of the solar model calculation of the total flux in order to make a major improvement. If is measured to an accuracy of 1%, then the uncertainties in determining and will be reduced by a factor of two. The uncertainties for and will be affected only by relatively small amounts even if is measured to 1%.
7.2 Free neutrino fluxes
| Experiments | |||
|---|---|---|---|
| S + K 3 yr + | () | () | |
| () | () | ||
| () | () | ||
| () | () |
Suppose we treat the , 7Be, 8B, and CNO solar neutrino fluxes as free parameters and impose the luminosity condition. Suppose also the and 7Be neutrino-electron scattering rates are measured.
In this case, table 8 and figure 6 show that a % measurement of the rate of scattering rate by solar neutrinos will improve by a factor of two our experimental knowledge of the allowed range of , but will not significantly improve our knowledge of the other solar neutrino fluxes or of . An accuracy of better than % is necessary, according to table 8, to decrease the allowed range of by more than 15%.
A 1% measurement of the scattering rate will also improve the bound on the sterile neutrino fraction, assuming that there are no sterile neutrinos. Using the existing solar data and simulated three years of KamLAND data plus a 5% measurement of the 7Be neutrino-electron scattering rate and a 1% measurement of the neutrino-electron scattering rate, we find that
| (41) |
The result shown in equation 41 was obtained by allowing all of the solar neutrino fluxes to be free parameters and imposing the luminosity constraint. Thus a 1% measurement can improve the limit on by about 20% (cf. the discussion in section 4.4). A 3% measurement of the neutrino-electron scattering rate will not significantly improve the limit on .
What can more precise solar neutrino experiments tell us about the mixing angle ? A solar neutrino experiment must be more accurate than 5% in order to improve the present limit that is derived from reactor, atmospheric, and solar neutrino data (see figure 2 and ref. [24]). A measurement accurate to 1% will, when analyzed together with a 5% 7Be solar neutrino experiment, all presently available solar neutrino and reactor data, and three years of KamLAND data, be capable of constraining to at . Figure 2 illustrates this modest improvement compared to the current limit of . A 1% 7Be solar neutrino experiment will not improve the bound shown in figure 2 without an accurate experiment.
We quote in all of our tables in this paper the allowed ranges after marginalizing over every parameter except the one of special interest. We have, for example, marginalized over all other quantities except in obtaining equation 41. This marginalization procedure is not the common practice in the field of neutrino oscillations. Because what we mean by errors is somewhat non-standard (but we think our procedure is valid), we have included in section 3.4 and also in section 9.2 discussions of the effect of marginalizing over input parameters.
7.3 How accurately will a neutrino experiment determine the solar luminosity?
We have discussed in section 4.6 and section 6.5 how neutrino experiments can be used to measure the total energy generation rate of the Sun. We have carried out a global analysis of all of the existing solar data plus a simulated 5% measurement of the neutrino-electron scattering rate as well as three years of simulated data of KamLAND and a 5% measurement of the 7Be neutrino-electron scattering rate. We find
| (42) |
Comparing equation 38 and equation 42, we see that a 5% measurement can improve the neutrino measurement of the solar luminosity by a factor of about three.
The constraints become even a factor of two stronger if the measurement is made to an accuracy of 1%. In this case, we find
| (43) |
A measurement to an accuracy of 1% would make a truly fundamental contribution to our knowledge of stellar energy generation. The neutrino measurements could be used to bound to % the contributions of all sources of energy other than the low-energy fusion reactions among light elements (the well-known chain and CNO cycle).
Unfortunately, a measurement of the neutrino electron scattering rate to an accuracy of 1% will not improve the constraints on the fraction of the solar luminosity that is produced by CNO fusion reactions. That is to say, the limits summarized in equation 37 are not tightened, to the quoted accuracy, by a measurement of the scattering rate to a precision of 1%.
7.4 What about the line?
In this subsection, we explore what can be learned by studying the solar neutrino flux. The interested reader can see in ref. [48] an early discussion of the theoretical questions that can be addressed by combining the measurement with other solar neutrino measurements. Moreover, that has recently been renewed interest in the experimental possibilities for measuring the neutrino-electron scattering rate at a deep underground site [49].
We present in section 7.4.1 the current best-estimate for the rate at which neutrinos are scattered by electrons. In section 7.4.2, we compare the power of a measurement with the power of a measurement.
The ratio of the to the neutrino flux is robustly determined by the standard solar model calculations. The ratio is determined more accurately than the individual fluxes because the ratio only depends weakly on the solar model characteristics. We have therefore used the BP00 value for the ratio,
| (44) |
in the calculations reported in this subsection (and in section 7.1 and section 7.2). However, we have verified that none of our quantitative conclusions are affected significantly if we change the ratio given in equation 44 by a relatively large amount, %.
7.4.1 The current predictions
What is the current best-estimate prediction for the rate of scattering of solar neutrinos by electrons? To answer this question, we have repeated the global analysis of the existing solar and KamLAND data as described in section 6.1. But in the present discussion we present the predictions for the , MeV, neutrino line instead of the 7Be neutrino line.
If we treat the 8B solar neutrino flux as a free parameter, but assume that all the other neutrino fluxes are as predicted by the BP00 standard solar model calculation [14], then the current best-estimate prediction for the reduced reduced reaction rate is
| (45) |
If instead we treat all the neutrino fluxes as free parameters and impose the luminosity constraint, then the predicted neutrino scattering scattering rate is
| (46) |
7.4.2 Which is better, or ?
Assuming that the neutrino flux is measured instead of the neutrino flux, we have repeated the global analyses of existing and future solar and KamLAND data that are described in section 7.1 and section 7.2. We assumed for these calculations the same accuracy for the measurements of the neutrino flux as was assumed in section 7.1 and section 7.2 for the measurements of the neutrino flux.
Our global analyses show that a measurement of the scattering rate by solar neutrinos would yield essentially equivalent information about neutrino oscillation parameters and solar neutrino fluxes as a measurement of the scattering rate by solar neutrinos. The estimated best-estimates and uncertainties in the parameters are almost identical for the analyses we have carried out for and neutrinos.
8 Maximal Mixing?
Is the currently allowed oscillation region for solar neutrinos consistent with maximal mixing, i.e., with ? And, if not, at what level is maximal mixing excluded? These are important questions for constructing particle physics models (see, e.g., [30, 50, 51, 52]).
We determine in section 8.1 at what level maximal mixing is excluded by using all the currently available solar plus KamLAND data. In section 8.2, we investigate the extent to which the SNO salt-phase data [53, 54] will strengthen or weaken the conclusion that exact Maximal Mixing is disfavored by solar and reactor data. In order to illustrate the sensitivity (or insensitivity) of the results to individual experiments, we present the results of the global analyses with and without including the chlorine experiment.
8.1 Solar plus KamLAND data today
We see from figure 3 that the allowed contour in the - plane satisfies . If we perform a global solution including all solar and KamLAND data and marginalize over , then maximal mixing is excluded at , i.e.,
| (47) |
This result given in equation 47 is in good agreement with the value of for the extent of the exclusion that was obtained [33] by the SNO collaboration using independent computer codes.
The result stated in equation 47 is slightly weakened if we exclude the chlorine experiment in the global solution. Then
| (48) |
If we had not marginalized over , but instead had used the two-dimensional contours of - (as is sometimes done in the literature), then the results would have been weaker than the constraints given in equation 47 and in equation 48. We would have obtained that, for 2 d.o.f. , maximal mixing was excluded at (including chlorine) or (excluding chlorine).
8.2 How well did the simulations work?
We described in section 3.6 of hep-ph/0305159, v2. how we simulated, prior to their announcement, the results of the SNO measurements in the salt phase (see also the footnote in section 3.6 of the present version of our paper). Using simulated instead of real SNO salt-phase data, we estimated that
| (49) |
Thus the simulations correctly predicted that the salt-phase results would strengthen the exclusion of maximal mixing by about an additional relative to the exclusion of that existed at the time the simulations were made.
9 Discussion
In section 9.1, we answer the question of why do solar neutrino experiments below 1 MeV. We use as the basis for our answer the calculations and discussion presented in the present paper.
We summarize in section 9.2 our view of what are the most important ideas and results that are described in section 2 to section 8. In section 9.3, we state our view of what all these results mean.
9.1 Why do solar neutrino experiments below 1 MeV?
There are three primary reasons for doing low energy solar neutrino experiments444For earlier discussions of the reasons for doing low energy solar neutrino energy experiments, see ref. [55], e.g., and the many important talks in the LowNu conference series: ; and ..
First, new phenomena may be revealed at low energies ( MeV) that are not discernible at high energies ( MeV). According to the currently accepted LMA oscillation solution, the basic oscillation mechanism switches somewhat below 1 MeV from the MSW matter-dominated oscillations that prevail at high energies to the vacuum oscillations that dominate at low energies (More precisely, we mean by the phrase ‘low energies’ those energies for which , see equation 4 and figure 1). We want to know if this transition from matter-induced to vacuum oscillations does indeed take place. If it does, is the ratio () of the kinematic term in the Hamiltonian (i.e., ) to the matter-induced term() the only parameter that determines the physical processes that are observed in this energy range? Or, could there be entirely new physical phenomena that show up only at the low energies, very long baseline, and great sensitivity to matter effects provided by solar neutrino experiments (see, for example, refs. [56, 57])?
Second, new solar neutrino experiments will provide accurate measurements of the fluxes of the important and 7Be solar neutrino fluxes, which together amount to more than 98% of the total flux of solar neutrinos predicted by the standard solar model. These measurements will test the solar model predictions for the main energy-producing reactions, predictions that are more precise than for the higher-energy neutrinos.
Remarkably, the combination of a 7Be solar neutrino experiment and a solar neutrino experiment can determine experimentally which terminating reaction of the chain, 3He-3He or 3He-4He, is faster in the solar interior and by how much. The ratio R of the rate of 3He-3He reactions to the rate of 3He-4He reactions averaged over the Sun can be expressed in terms of the and 7Be neutrino fluxes by the following simple relation555More precisely, should be replaced by the sum of the 7Be and 8B neutrino fluxes in the denominator of Eq. (50).:
| (50) |
The standard solar model predicts [58]. One of the reasons why it is so important to measure accurately the total and 7Be neutrino flux is in order to test this detailed prediction of standard solar models. The value of R reflects the competition between the two primary ways of terminating the chain and hence is a critical probe of solar fusion.
Using only the measurements of the solar neutrino fluxes, one can determine the current rate at which energy is being produced in the solar interior and can compare that energy generation rate with the observed photon luminosity emitted from the solar surface. This comparison will constitute a direct and accurate test of the fundamental idea that the Sun shines by nuclear reactions among light elements. Moreover, the neutrino flux measurements will test directly a general result of the standard solar model, namely, that the Sun is in a quasi-steady state in which the interior energy generation rate equals the surface radiation rate.
Third, low-energy solar neutrino experiments, 7Be plus , will make possible a precise measurement of the vacuum mixing angle, , and an improved measurement of the sterile mixing parameter (as well as a slightly improved constraint on ) (see section 7.2).
The low-energy measurements will provide, in addition, essential redundancy. In this paper, we have assumed the correctness of all solar neutrino and reactor experiments that have been performed so far or which will be performed in the future. But, the history of science teaches us that this is a dangerous assumption. Sometimes unrecognized systematic uncertainties can give misleading results. To be sure that our conclusions are robust, the same quantities must be measured in different ways.
9.2 Principal results
We present a list of our principal results, beginning with the results that pertain to individual solar neutrino fluxes (section 9.2.1), the neutrino oscillation parameters (section 9.2.2), and specific new experiments (section 9.2.3), and ending with technical remarks concerning statistical significance and marginalization (section 9.2.4).
9.2.1 Solar neutrino fluxes
- The solar neutrino flux.
-
The existing solar and reactor experiments determine the flux of solar neutrinos to an accuracy of %, provided one imposes the luminosity constraint (see below and section 5). The measured value is times the flux predicted by the BP00 [14] standard solar model (see the last two entries in the last column of table 4).
- The 7Be solar neutrino flux.
-
The existing solar plus reactor experiments provide only loose constraints on the 7Be solar neutrino flux. The 7Be flux is restricted at to the values , corresponding to approximately a % uncertainty (see the last row of table 4). The % uncertainty results when one varies all the principal solar neutrino fluxes as free parameters subject to the luminosity constraint.
- The 8B solar neutrino flux.
-
The 8B solar neutrino flux is robustly determined by the existing solar and KamLAND experiments. If one treats only the 8B flux as a free parameter, then the experimentally-determined flux divided by the standard model (BP00) prediction is () (see the second row of table 2). The uncertainty is unchanged if one allows all of the neutrino fluxes to vary as free parameters, subject to the luminosity constraint (see the last row of table 4).
- The CNO solar neutrino fluxes.
-
The existing solar neutrino experiments constrain only very poorly the CNO fluxes. The 15O flux is the most strongly constrained by the currently available data and even for this most favorable case the flux could be at () as large as 2.4 (6.4) times the standard model prediction (see equation 16). A 7Be experiment accurate to % could reduce the () uncertainty in the 15O neutrino flux by a factor of five (two) (see equation 36).
- The power of the luminosity constraint.
-
Table 4 shows that the luminosity constraint reduces by a factor of ten the uncertainty in the experimentally-determined solar neutrino flux, from () without the luminosity constraint to with the constraint. One can understand from the approximate equation 28 why the luminosity constraint provides such a powerful limitation on the flux, but is not very restrictive for the 7Be solar neutrino flux. If the real Sun is relatively close to the standard solar model [14], about 85% of the energy generation in the model goes through the 3He-3He termination (producing two neutrinos) and only about 15% goes through the 3He-4He termination (producing one neutrino and one 7Be neutrino). Therefore the condition for energy conservation that is expressed by the luminosity constraint limits the neutrino flux more tightly than the 7Be neutrino flux.
The luminosity constraint does not have a significant direct effect on the allowed region for the 8B neutrino flux because the 8B flux represents only a tiny fraction, 0.004%, of the energy generation in the standard solar model. The only effect of the luminosity constraint on the allowed 8B range is indirectly through the allowed regions for and .
- Comparison of neutrino luminosity with photon luminosity.
-
Neutrinos produced by a particular nuclear reaction contribute an accurately known amount of energy to the Sun. Thus an energy-weighted linear combination of the individual solar neutrino fluxes represents the current rate at which energy is being generated in the solar interior [12]. From neutrino measurements alone, one can measure the solar energy generation rate and then compare this neutrino luminosity with the photon luminosity being radiated from the solar surface. This comparison would test the fundamental idea that nuclear fusion reactions are responsible for the energy radiated by the Sun. Moreover, this same comparison would test a basic inference from the standard solar model, namely, that the Sun is in a quasi-steady state in which the energy currently radiated from the solar surface is currently balanced by the energy being produced by nuclear reactions in the solar interior.
Using existing solar and reactor data, the neutrino luminosity can be determined to about 20% (see equation 27). A 7Be solar neutrino experiment accurate to 5% could improve this determination to about 13% (see equation 38). The global combination of a 7Be experiment, plus a experiment, plus the existing solar data, and three years of KamLAND would make possible a precise determination of the solar neutrino luminosity. A solar neutrino experiment accurate to 5% would make possible a measurement of the solar neutrino luminosity to 4% (see equation 42) and a 1% experiment would determine the solar luminosity to 2% (see equation 43).
9.2.2 Neutrino parameters
- The allowed region of and .
-
Figure 3 illustrates the currently allowed region for and , as well as the much smaller allowed region that is expected to result after three years of operation of the KamLAND experiment. If only the 8B neutrino flux is treated as a free parameter (all other neutrino fluxes and their uncertainties being taken from the standard solar model), then at () (see the second row of table 2) ()and (). If instead all the principal neutrino fluxes are treated as free variables but subject to the luminosity constraint, then (see the last row of table 4) () and (). The oscillation parameters are less well constrained if one requires that the neutrino fluxes be determined by experiment rather than adopted from the standard solar model.
- The active-sterile admixture.
-
The sterile fraction of the incident solar neutrino flux can be described in terms of the parameter , which is defined in section 3.2 and in ref. [2]. The 1 allowed range for the active-sterile admixture is (see text before equation 24) if we allow all the neutrino fluxes to vary as free parameters but impose the luminosity constraint. For the Super-Kamiokande and SNO experiments, this limit corresponds to (see equation 24).
A 1% measurement of the neutrino-electron scattering rate, in conjunction with improved KamLAND measurements and a 5% 7Be experiment, can significantly improve the existing limit on (see equation 41) provided that there are no sterile neutrinos that show up at low neutrino energies. The 7Be measurement determines the flux significantly accurately that one is then sensitive to a small loss of flux to sterile neutrinos in a experiment. However, even a 1% measurement of the 7Be neutrino scattering rate will not, without an accurate measurement, tighten significantly the bound on (see discussion in section 6.2).
- The vacuum-matter transition.
-
We define in equation 3 and equation 4 the quantity [], which governs the transition from vacuum neutrino oscillations to matter dominated oscillations. For values of , vacuum (kinematic) oscillations are dominant while for , matter (LMA) oscillations are dominant.
Figure 1 illustrates the two limiting regimes, vacuum and matter oscillations, and the transition region between them. In the Sun, the vacuum-matter transition occurs somewhere near MeV.
One of the principal goals of future solar neutrino experiments is to try to find direct evidence for the vacuum-matter transition.
9.2.3 New experiments
- What additional KamLAND measurements will teach us.
-
We have simulated the results of a full three years of KamLAND operations (see section 3.5), assuming that the true result values of the oscillation parameters are equal to the current best-fit parameters. Performing a global analysis of the simulated KamLAND 3 yr data and all the currently available solar neutrino data, we find that the additional KamLAND data will reduce the allowed region for by about a factor of two (compare the second and third rows of table 2 and table 3). The allowed regions for and will be reduced less dramatically, but still significant, by about a factor of one-fourth.
- A 7Be solar neutrino experiment.
-
The predicted rate (in terms of the standard model rate) for a 7Be neutrino-electron experiment is very well determined if one assumes the standard solar model is correct: (see equation 30). However, if one does not assume the correctness of the solar model, then the uncertainty in the prediction is about nine times worse: (see equation 34).
We need an experiment to measure directly the flux of 7Be solar neutrinos!
How accurate does the 7Be experiment have to be in order to provide important new information? This question is answered in table 6. A measurement of the scattering rate accurate to % or better will reduce by a factor of four the uncertainty in the measured 7Be neutrino flux. Moreover, the % 7Be flux measurement will reduce the uncertainty in the crucial flux by a factor of about 2.5. A 7Be measurement accurate to % would provide another factor of two improvement in the accuracy of the 7Be and solar neutrino fluxes.
All of these improvements are measured with respect to what we expect can be achieved with three years of operation of the KamLAND experiment (see the top row of table 6), which is likely to be completed before a 7Be solar neutrino experiment is completed. Comparable information can be obtained from a CC (neutrino absorption) experiment and from a neutrino-electron scattering experiment if both are performed to the same accuracy.
Contrary to what some authors have stated, a 7Be solar neutrino experiment is not expected to provide significantly more accurate values for the neutrino oscillation parameters than what we think will be available after three years of operation of KamLAND (see table 6).
- A solar neutrino experiment.
-
According to the standard solar model,about 91% of the total flux of the neutrinos from the Sun is in the form of the low energy ( MeV) neutrinos. We cannot be sure that we have an essentially correct description of the solar interior until this fundamental prediction is tested. Moreover, the neutrinos are in the range where vacuum oscillations dominate over matter effects, so observing these low-energy neutrinos is an opportunity to test in a crucial way also our understanding of the neutrino physics.
If we really know what we think we know, if the standard solar model is correct to the stated accuracy (% for the total neutrino flux) and if there is no new physics that shows up below MeV, then table 8 shows that a measurement of the flux to an accuracy of better than % is necessary in order to significantly improve our experimental knowledge of . The main reason why such high accuracy is required is that the existing experiments, if they are all correct to their quoted accuracy, already determine the solar neutrino flux to %. (We assumed in constructing table 8 that three years of KamLAND reactor data will be available, as well as % measurement of the 7Be neutrino-electron scattering rate. The 7Be measurement does not contribute significantly to the measurement accuracy for .)
As described above, an accurate measurement of the solar neutrino flux will provide a direct test of the fundamental ideas underlying the standard solar model. The measurement will make possible the determination of the total solar luminosity from just neutrino experiments alone. The neutrino luminosity can be compared with the photon luminosity to check whether nuclear fusion reactions among light elements is the only discernible source of solar energy and whether the Sun is in an approximate steady state in which the rate of interior energy generation equals the rate at which energy is radiated through the solar surface.
The neutrinos (a MeV neutrino line) can give essentially the same information as the neutrinos.
- Maximal mixing; the SNO salt-phase data.
-
The solar (without the SNO salt-phase data) plus reactor data disfavor neutrino oscillation solutions with maximal mixing, i. e., , at a confidence level of . The addition of the most recent solar data, excludes maximal mixing at a confidence level of (see equation 47).
- What if one experiment is wrong?
-
The implications of solar neutrino experiments for physics and astronomy are too important to be allowed to depend upon just one experiment, no matter how well that experiment appears to have been performed. We have therefore checked the sensitivity of some of our results to removing the chlorine experiment from the total data set.
The principal reason for choosing the chlorine experiment to test the robustness of our conclusions is that the experiment supplies an important number. The total capture rate of solar neutrinos by 37Cl affects significantly some of our inferences. Although the chlorine experiment has been tested internally in different ways and has been carried out with exemplary care and skill [6], the full experiment has not been directly checked by any other solar neutrino experiment.
If we include the chlorine experiment in the total data set, the reduced 7Be neutrino flux implied by all the data is (see table 4). If the chlorine experiment is removed from the data set then (see equation17). Thus removing the chlorine experiment degrades the existing 7Be neutrino flux measurement from a % measurement to a % measurement.
Removing the chlorine experiment from the data set results in a relatively slightly weaker conclusion regarding maximal mixing. Instead of maximal mixing being disfavored by , as it is with the full data set, maximal mixing would only be disfavored by if the chlorine experiment is omitted (cf. equation 47 with equation 48.)
9.2.4 Statistical significance and marginalization
- Statistical significance.
-
Whenever we present the allowed range of a particular variable [e.g., , , , , , , , or ], we have marginalized over all parameters except the quantity singled out for special interest. This procedure is illustrated in section 3.3, where the marginalization procedure is outlined specifically for the variable . The marginalization procedure has also been applied (see discussion in section 3.4) to other derived quantities like , or (or ) that are themselves functions of the fundamental input variables.
The allowed ranges of or calculated by the marginalization procedure described above are different from, and smaller than (by up to about 50%), the allowed ranges that were usually quoted in our own previous papers. There, we determined the uncertainties for quantities like or by sampling the two-dimensional parameter space, and , at the desired confidence level, together with the other input parameters. The marginalization procedure described here yields a well defined range independent of the number of free parameters in the analysis. The marginalization procedure has been used to extract derived parameters as [2] or (first ref. in [3]) and it should be used in the future when calculating individual elements of the neutrino oscillation matrix like .
- Technical Details.
-
We describe in section 3 the method we use to calculate the global , introduce the parameter that represents the active-sterile admixture, and define the reduced solar neutrino fluxes , , and . We also summary the 96 data points (see table 1) that we use in our global analyses. In addition, we outline how we create simulated data for three years of KamLAND operation and for the salt-phase measurements of SNO.
9.3 What does it all mean?
We are agnostics on the question of whether or not we know the physics and the astronomy well enough to extrapolate accurately to a different neutrino energy domain and to different solar neutrino sources. New physics or astronomical processes may be relevant at neutrino energies below 1 MeV that are not important at higher energies. We have made the extrapolation in this paper in order to have a quantitative basis for discussing what to expect and what we might learn.
Acknowledgments.
We are grateful to M. C. Gonzalez-Garcia, C. Lunardini, and E. Lisi for valuable comments, suggestions, and insights. We are indebted to S. Freedman for a stimulating conversation regarding what can be learned from a 7Be solar neutrino experiment, to A. McDonald for a valuable discussion that sparked our simulation of the SNO salt-phase data, and to M. Chen for information about the potential feasibility of a solar neutrino experiment. We are grateful to many friends and colleagues who commented on the first version of this paper, which was posted on the archive before submission for publication. We have particularly benefited from a discussion with G. Fiorentini that sparked our computation of the solar luminosity from purely neutrino data. We have profited from valuable comments and stimulating suggestions by R. Lanou, D. McKinsey, F. Vissani, and L. Wolfenstein. We thank JHEP and an anonymous referee for allowing us to update our numerical calculations following the release on September 7, 2003 of new data from the SNO, GNO, and SAGE solar neutrino collaborations. JNB and CPG acknowledge support from NSF grant No. PHY0070928.References
- [1] L. Wolfenstein, Neutrino oscillations in matter, Phys. Rev. D 17 (1978) 2369; S.P. Mikheyev and A.Y. Smirnov, Resonance enhancement of oscillations in matter and solar neutrino spectroscopy, Sov. Jour. Nucl. Phys. 42 (1985) 913.
- [2] J.N. Bahcall, M.C. Gonzalez-Garcia and C. Peña-Garay, Solar neutrinos before and after KamLAND, J. High Energy Phys. 02 (2003) 009 [hep-ph/0212147].
- [3] G.L. Fogli, E. Lisi, A. Marrone, D. Montanino, A. Palazzo and A.M. Rotunno, Neutrino oscillations: a global analysis, arXiv:hep-ph/0310012; M. Maltoni, T. Schwetz, M.A. Tortola and J.W. Valle, Status of three-neutrino oscillations after the SNO-salt data, arXiv:hep-ph/0309130; P.C. de Holanda and A.Y. Smirnov, Solar neutrinos: the SNO salt phase results and physics of conversion, arXiv:hep-ph/0309299; H. Murayama and C. Peña-Garay, Neutrinoless double beta decay in light of SNO salt data, arXiv:hep-ph/0309114; P. Aliani, V. Antonelli, M. Picariello and E. Torrente-Lujan, The neutrino mass matrix after Kamland and SNO salt enhanced results, arXiv:hep-ph/0309156; A.B. Balantekin and H. Yuksel, Constraints on neutrino parameters from neutral-current solar neutrino measurements, arXiv:hep-ph/0309079; A. Bandyopadhyay, S. Choubey, S. Goswami, S.T. Petcov and D.P. Roy, Constraints on neutrino oscillation parameters from the SNO salt phase data, arXiv:hep-ph/0309174; G.L. Fogli, E. Lisi, A. Marrone, D. Montanino, A. Palazzo and A.M. Rotunno, Solar neutrino oscillation parameters after first KamLAND results, Phys. Rev. D 67 (2003) 073002; M. Maltoni, T. Schwetz and J.W. Valle, Combining first KamLAND results with solar neutrino data, Phys. Rev. D 67 (2003) 093003 [hep-ph/0212129]; P. Creminelli, G. Signorelli and A. Strumia, Frequentist analyses of solar neutrino data, J. High Energy Phys. 05 (2001) 052 [hep-ph/0102234]; A. Bandyopadhyay, S. Choubey, R. Gandhi, S. Goswami and D.P. Roy, The solar neutrino problem after the first results from KamLAND, Phys. Lett. B 559 (2003) 121; P.C. de Holanda and A.Y. Smirnov, LMA MSW solution of the solar neutrino problem and first KamLAND results, J. Cosmol. Astropart. Phys. 02 (2003) 001; H. Nunokawa, W.J. Teves and R. Zukanovich Funchal, Determining the oscillation parameters by solar neutrinos and KamLAND, Phys. Lett. B 562 (2003) 28 [hep-ph/0212202]; A.B. Balantekin and H. Yuksel, Global analysis of solar neutrino and KamLAND data, J. Phys. G 29 (2003) 665; V. Barger and D. Marfatia, KamLAND and solar neutrino data eliminate the LOW solution, Phys. Lett. B 555 (2003) 144; P. Aliani, V. Antonelli, M. Picariello and E. Torrente-Lujan, Neutrino mass parameters from Kamland, SNO and other solar evidence, Phys. Rev. D 68 (2003) 053001 [hep-ph/0212212].
- [4] G. Fiorentini and B. Ricci, How long does it take for heat to flow through the sun?, Comments Mod. Phys. E 1 (1999) 49.
- [5] J.N. Bahcall, Solar neutrinos. I. Theoretical, Phys. Rev. Lett. 12 (1964) 300; R. Davis Jr., Solar neutrinos. II. Experimental, Phys. Rev. Lett. 12 (1964) 303.
- [6] B.T. Cleveland et al., Measurement of the solar electron neutrino flux with the Homestake chlorine detector, Astrophys. J. 496 (1998) 505.
- [7] V. Gavrin, Results from the Russian American gallium experiment (SAGE), talk at VIIIth International Conference on Topics in Astroparticle and Underground Physcis (TAUP03), Seattle, Sept. 5–9, 2003; SAGE collaboration, J.N. Abdurashitov et al., Measurement of the solar neutrino capture rate by the Russian-American gallium solar neutrino experiment during one half of the 22-year cycle of solar activity, J. Exp. Theor. Phys. 95 (2002) 181 [astro-ph/0204245].
- [8] GALLEX collaboration, W. Hampel et al., GALLEX solar neutrino observations: results for GALLEX IV, Phys. Lett. B 447 (1999) 127.
- [9] Y. Fukuda et al., Solar neutrino data covering solar cycle 22, Phys. Rev. Lett. 77 (1996) 1683.
- [10] J.N. Bahcall and P.I. Krastev, How well do we (and will we) know solar neutrino fluxes and oscillation parameters?, Phys. Rev. D 53 (1996) 4211.
- [11] J.N. Bahcall and M. Pinsonneault, Solar models with helium and heavy-element diffusion, Rev. Mod. Phys. 67 (1995) 781.
- [12] J.N. Bahcall, The luminosity constraint on solar neutrino fluxes, Phys. Rev. C 65 (2002) 025801.
- [13] M.V. Garzelli and C. Giunti, Model independent information on solar neutrino oscillations, Phys. Rev. D 65 (2002) 093005.
- [14] J.N. Bahcall, M.H. Pinsonneault and S. Basu, Solar models: current epoch and time dependences, neutrinos, and helioseismological properties, Astrophys. J. 555 (2001) 990.
- [15] Super-Kamiokande Collaboration, S. Fukuda et al., Solar and hep neutrino measurements from 1258 days of Super-Kamiokande data, Phys. Rev. Lett. 86 (2001) 5651.
- [16] SNO collaboration, Q.R. Ahmad et al., Direct evidence for neutrino flavor transformation from neutral-current interactions in the Sudbury Neutrino Observatory, Phys. Rev. Lett. 89 (2002) 011301 [nucl-ex/0204008].
- [17] SNO collaboration, Q.R. Ahmad et al., Measurement of day and night neutrino energy spectra at SNO and constraints on neutrino mixing parameters, Phys. Rev. Lett. 89 (2002) 011302 [nucl-ex/0204009].
- [18] KamLAND collaboration, K. Eguchi et al., First results from KamLAND: evidence for reactor anti-neutrino disappearance, Phys. Rev. Lett. 90 (2003) 021802 [hep-ex/0212021].
- [19] M. Spiro and D. Vignaud, Solar model independent neutrino oscillation signals in the forthcoming solar neutrino experiments?, Phys. Lett. B 242 (1990) 279.
- [20] E. Bellotti, The Gallium Neutrino Observatory (GNO), talk at VIIIth International Conference on Topics in Astroparticle and Underground Physcis (TAUP03), Seattle, Sept. 5–9, 2003 ; GNO collaboration, M. Altmann et al., GNO solar neutrino observations: results for GNO I, Phys. Lett. B 490 (2000) 16.
- [21] M.C. Gonzalez-Garcia, M. Maltoni, C. Peña-Garay and J.W. Valle, Global three-neutrino oscillation analysis of neutrino data, Phys. Rev. D 63 (2001) 033005 [hep-ph/0009350].
- [22] M.C. Gonzalez-Garcia, Theory of neutrino masses and mixing, Nucl. Phys. B 117 (2003) 186 [hep-ph/0210359].
- [23] G.L. Fogli, G. Lettera, E. Lisi, A. Marrone, A. Palazzo and A. Rotunno, Three-flavor solar neutrino oscillations with terrestrial neutrino constraints, Phys. Rev. D 66 (2002) 093008 [hep-ph/0208026].
- [24] M.C. Gonzalez-Garcia and C. Pena-Garay, Three-neutrino mixing after the first results from K2K and KamLAND, hep-ph/0306001.
- [25] See talks at the 3rd International Workshop on Low Energy Solar Neutrinos, May 22-24, 2002 Heidelberg: K. Furuno, The KamLAND detector and backgrounds for solar neutrino detection; L. Perasso, Status of the BOREXINO experiment; D. McKinsey, CLEAN; M. Nakahata, Status of XMASS; R. Lanou, The HERON Project; H. Ejiri, MOON for low energy solar neutrinos with Mo-100; C. Cattadori, Status and perspectives of the LENS project.
- [26] H.A. Bethe, Possible explanation of the solar-neutrino puzzle, Phys. Rev. Lett. 56 (1986) 1305.
- [27] S.P. Mikheev and A.Y. Smirnov, Neutrino oscillations in matter with varying density, Proc. of the 6th Moriond Workshop on Massive Neutrinos in Astrophysics and Particle Physics, eds. O. Fackler and J. Tran Thanh Van (Editions Frontières 1986), p. 355.
- [28] A. Messiah, Treatment of electron-neutrino oscillations in solar matter: the MSW Effect, Proc. of the 6th Moriond Workshop on Massive Neutrinos in Astrophysics and Particle Physics, eds. O. Fackler and J. Tran Thanh Van (Editions Frontières 1986), p. 373.
- [29] J.N. Bahcall, Neutrino Astrophysics, Cambridge University Press, Cambridge, 1989.
- [30] M.C. Gonzalez-Garcia and Y. Nir, Neutrino masses and mixing: evidence and implications, Rev. Mod. Phys. 75 (2003) 345 [hep-ph/0202058].
- [31] S.J. Parke, Nonadiabatic level crossing in resonant neutrino oscillations, Phys. Rev. Lett. 57 (1986) 1275.
- [32] S.L. Glashow, Partial symmetries of weak interactions, Nucl. Phys. 22 (1961) 579; S. Weinberg, A model of leptons, Phys. Rev. Lett. 19 (1967) 1264; A. Salam, in Elementary Particle Theory, ed. N. Svartholm (Almquist and Wiksells, Stockolm, 1969), p. 367.
- [33] SNO Collaboration, S.N. Ahmed et al., Measurement of the total active B-8 solar neutrino flux at the Sudbury Neutrino Observatory with enhanced neutral current sensitivity, nucl-ex/0309004.
- [34] J.N. Bahcall, M.C. Gonzalez-Garcia and C. Pena-Garay, Before and after: how has the SNO neutral current measurement changed things?, J. High Energy Phys. 07 (2002) 054.
- [35] J.N. Bahcall, M.C. Gonzalez-Garcia and C. Pena-Garay, Robust signatures of solar neutrino oscillation solutions, J. High Energy Phys. 04 (2002) 007.
- [36] Kamiokande Collaboration, Y. Fukuda et al., Atmospheric muon-neutrino/electron-neutrino ratio in the multiGeV energy range, Phys. Lett. B 335 (1994) 237; R. Becker-Szendy et al., Neutrino measurements with the IMB detector, Nucl. Phys. (Proc. Suppl.) B 38 (1995) 331; Soudan-2 Collaboration, W.W. Allison et al., The atmospheric neutrino flavor ratio from a 3.9 fiducial kiloton-year exposure of Soudan 2, Phys. Lett. B 449 (1999) 137; Super-Kamiokande Collaboration, Y. Fukuda et al., Evidence for oscillation of atmospheric neutrinos, Phys. Rev. Lett. 81 (1998) 1562; M. Shiozawa, Super-Kamiokande, talk at the XXth International Conference on Neutrino Physics and Astrophysics (NU2002), Munich, May 25–30, 2002; MACRO Collaboration, M. Ambrosio et al., Status report of the MACRO experiment for the year 2001, hep-ex/0206027.
- [37] K2K Collaboration, M.H. Ahn et al., Indications of neutrino oscillation in a 250-km long-baseline experiment, Phys. Rev. Lett. 90 (2003) 041801.
- [38] M. Apollonio et al., Limits on neutrino oscillations from the CHOOZ experiment, Phys. Lett. B 466 (1999) 415.
- [39] F. Boehm et al., Results from the Palo Verde neutrino oscillation experiment, Phys. Rev. D 62 (2000) 072002.
- [40] D. Dooling, C. Giunti, K. Kang and C.W. Kim, Matter effects in four-neutrino mixing, Phys. Rev. D 61 (2000) 073011; C. Giunti, M.C. Gonzalez-Garcia and C. Peña-Garay, Four-neutrino oscillation solutions of the solar neutrino problem, Phys. Rev. D 62 (2000) 013005.
- [41] J.N. Bahcall, M.C. Gonzalez-Garcia and C. Pena-Garay, Does the sun shine by pp or CNO fusion reactions?, Phys. Rev. Lett. 90 (2003) 131301.
- [42] X. Shi and D.N. Schramm, Solar neutrinos and the MSW effect for three neutrino mixing, Phys. Lett. B 283 (1992) 305.
- [43] SNO Collaboration, S.N. Ahmed et al., How to use the SNO salt flux results, http://www.sno.phy.queensu.ca/sno/
- [44] J.N. Bahcall, E. Lisi, D.E. Alburger, L. De Braeckeleer, S.J. Freedman and J. Napolitano, Standard neutrino spectrum from decay, Phys. Rev. C 54 (1996) 411.
- [45] J.N. Bahcall, Gallium solar neutrino experiments: absorption cross sections, neutrino spectra, and predicted event rates, Phys. Rev. C 56 (1997) 3391.
- [46] BOREXINO collaboration, G. Alimonti et al., Science and technology of BOREXINO: a real time detector for low energy solar neutrinos, Astropart. Phys. 16 (2002) 205.
- [47] M. Nakahata, Value and sensitivity of the future low energy solar neutrino experiment, talk given at the 3rd Workshop on Neutrino Oscillations and their Origin (NOON2001), December 5-8, 2001, ICRR, Univ. of Tokyo, Kashiwa, Japan. See talk posted at http://www-sk.icrr.u-tokyo.ac.jp/noon2001/transparency/dec05/nakahata/nakahata.pdf.
- [48] J.N. Bahcall and P.I. Krastev, What can be learned by measuring the fluxes of the and the solar neutrino lines?, Phys. Rev. C 55 (1997) 929 [astro-ph/9607013].
- [49] M. Chen, private communication, May 2003.
- [50] Y. Nir, Pseudo-Dirac solar neutrinos, J. High Energy Phys. 06 (2000) 039.
- [51] G. Altarelli and F. Feruglio, Theoretical models of neutrino masses and mixings, hep-ph/0206077.
- [52] R.N. Mohapatra, ICTP lectures on theoretical aspects of neutrino masses and mixings, hep-ph/0211252.
- [53] SNO Collaboration, A.B. McDonald et al., The Sudbury Neutrino Observatory project, Nucl. Phys. B 77 (Proc. Suppl.) (1999) 43;SNO Collaboration, G.T. Ewan, W.F. Davidson, C.K. Hargrove, The Sudbury Neutrino Observatory—an introduction, Physics in Canada 48 (1992) 112; SNO Collaboration, The Sudbury Neutrino Observatory, Nucl. Instrum. Meth. A 449 (2000) 172.
- [54] M. Boulay, Present status and results from the SNO experiment, talk given at the APS April meeting (DPF2003), April 5–8, 2003, Philadelphia, PA. See talk on http://www.dpf2003.org/talks.html.
- [55] J.N. Bahcall, Why do solar neutrino experiments below 1 MeV?, in Low Energy Solar Neutrino Detection, Proceedings of the 2nd International Workshop (LowNu2), eds. Y. Suzuki, M. Nakahata and S. Moriyama (World Scientific 2001), p. 172 [hep-ex/0106086].
- [56] V. Berezinsky, M. Narayan and F. Vissani, Mirror model for sterile neutrinos, Nucl. Phys. B 658 (2003) 254.
- [57] P.C. de Holanda and A.Y. Smirnov, Searches for sterile component with solar neutrinos and KamLAND, hep-ph/0211264.
- [58] J.N. Bahcall, Solar models: a historical review, Nucl. Phys. (Proc. Suppl.) B 118 (2003) 77.