Effective number of neutrinos and baryon asymmetry from BBN and WMAP
Abstract
We place constraints on the number of relativistic degrees of freedom and on the baryon asymmetry at the epoch of Big Bang Nucleosynthesis (BBN) and at recombination, using cosmic background radiation (CBR) data from the Wilkinson Microwave Anisotropy Probe (WMAP), complemented by the Hubble Space Telescope (HST) Key Project measurement of the Hubble constant, along with the latest compilation of deuterium abundances and H region measurements of the primordial helium abundance. The agreement between the derived values of these key cosmological and particle physics parameters at these widely separated (in time or redshift) epochs is remarkable. From the combination of CBR and BBN data, we find the ranges for the effective number of neutrinos and for the baryon asymmetry (baryon to photon number ratio ) to be 1.7–3.0 and 5.53–6.76 , respectively.
I Introduction
The concordance model of cosmology, with dark energy, dark matter, baryons, and three flavors of light neutrinos, provides a consistent description of BBN ( minutes), the CBR ( Kyr), and the galaxy formation epochs of the universe ( Gyr). The standard model has received recent confirmation from the WMAP precision measurements of the CBR temperature and polarization anisotropy spectra map . However, despite the impressive successes of the standard model in describing a wide range of cosmological data, the possibility remains that there could be non-standard model contributions to the total energy density in the radiation era from additional relativistic particles.
In this paper new constraints are placed on any physics beyond the standard model that contributes to the energy density like radiation (i.e., decreases with the expansion of the universe as the fourth power of the scale factor, independent of the sign of that contribution). While such new physics may or may not be due to extra relativistic degrees of freedom, it is assumed that the non-standard contribution to the energy density may be parameterized as such. Simultaneously, constraints are placed on the baryon density at widely differing epochs in the evolution of the universe. The keys to these constraints are the recently released measurements of the CBR anisotropy spectra by the WMAP collaboration, the most recent compilation of high redshift, low metallicity deuterium abundances k and 4He abundances relevant to BBN.
II Modified relativistic energy density
The cosmology of interest here begins when the universe is already a few tenths of a second old and the temperature is a few MeV. At such early epochs the total energy density receives its dominant contribution from all the relativistic particles present (the evolution of the universe is said to be “radiation-dominated” (RD)). In the standard cosmology, prior to annihilation, these relativistic particles are: photons, pairs and three flavors of left-handed (i.e., one helicity state) neutrinos (and their right-handed antineutrinos). Then, the energy density is
| (1) |
where is the energy density in photons (which by today have redshifted to become the CBR photons at a temperature of about 2.7 K).
In “standard” BBN (SBBN) it is assumed that the neutrinos are fully decoupled prior to annihilation and do not share in the energy transferred from the annihilating pairs to the CBR photons. In this approximation, the photons in the post-annihilation universe are hotter than the neutrinos by a factor , and the relativistic energy density is
| (2) |
During the RD epoch the age and the energy density are related by (we have chosen units in which ), so that once the particle content () is specified, the age of the universe is known as a function of the CBR temperature. In the standard model,
| (3) |
| (4) |
The most straightforward variation of the standard cosmology is “extra” energy contributed by new, light (relativistic at BBN) particles “”. These might, but need not be sterile neutrinos. When the are decoupled, in the sense that they don’t share in the energy released by annihilation, it is convenient to account for the extra contribution to the standard-model energy density by normalizing it to that of an “equivalent” neutrino ssg ,
| (5) |
For SBBN = 0, where . For each additional “neutrino-like” particle (i.e., any two-component fermion), if , then = 1; if is a scalar, = 4/7. However, it may well be that the have decoupled even earlier in the evolution of the universe and have failed to profit from the heating when various other particle-antiparticle pairs annihilated (or unstable particles decayed). In this case, the contribution to from each such particle will be (). We emphasize that, in principle, we are considering any term in the energy density which scales like , where is the scale factor. In this sense, the modification to the usual Friedman equation due to higher dimensional effects, as in the Randall-Sundrum model rs (see also, rs1 ; rs2 ; rs3 ; rs4 ; rs5 ; rs6 ; rs7 ; bratt ), can be included as well. An important interest in this latter case is that it permits the possibility of a negative contribution to the radiation density (; ).
In the presence of such a modification to the relativistic energy density, the pre-annihilation energy density in Eq. (1) is changed to,
| (6) |
Any extra energy density () speeds up the expansion of the universe so that the right-hand side of the time-temperature relation in Eq. (3) is smaller by the square root of the factor in parentheses in Eq. (6),
| (7) | |||||
where is the age of the universe with the extra energy density. In the post-annihilation universe the extra energy density is diluted by the heating of the photons, so that,
| (8) |
and
| (9) |
This latter expression (Eq. 9) is also relevant for the modification to the spectrum of temperature fluctuations in the CBR (when compared with the standard case).
III Constraints on from the CBR
The competition between gravitational potential and pressure gradients is responsible for the peaks and troughs in the CBR power spectrum. The redshift of matter-radiation equality,
| (10) |
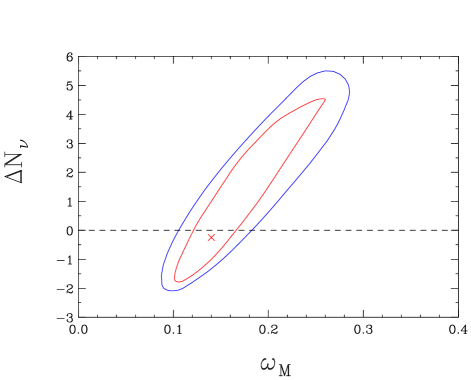
affects the time (redshift) duration over which this competition occurs. Here, is the total matter density (comprised, for nearly massless neutrinos, of baryons and cold dark matter) and ( km/s/Mpc) is the normalized Hubble constant. The direct correlation between and is evident in Fig. 1 which results from our analysis described below. The primary effects of relativistic degrees of freedom (other than photons) on the CBR power spectrum result essentially from changing the redshift of matter-radiation equality. If the radiation content is increased, matter-radiation equality is delayed, and occurs closer (in time and/or redshift) to the epoch of recombination.
The redshift of matter-radiation equality is important for two reasons hu :
-
•
Radiation causes potential decay which blueshifts the photons because they do not have to climb out of such deep wells. Moreover, the concurrent decay in the spatial curvature doubles the blueshift effect by contracting the wavelength of the photons relative to the pure cosmological expansion.
-
•
In the matter dominated (MD) era before recombination, the density contrast () of the pressureless cold dark matter (CDM) grows unimpeded (as ) while the density contrast of the baryons is either oscillating or decaying. The longer this pre-recombination MD era lasts, the more suppressed are the amplitudes of the peaks.
Conversely, if matter-radiation equality is delayed, the gravitational potential is dominated by the photon-baryon fluid closer to recombination resulting in a more pronounced peak structure.
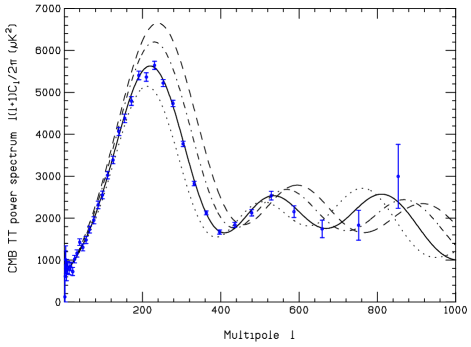
An increase in the relativistic content causes the universe to be younger at recombination with a correspondingly smaller sound horizon . Since the location of the peak scales roughly as (where is the comoving angular diameter distance to recombination), the peaks shift to smaller angular scales (larger ) and with greater separation. These features are clearly visible in Fig. 2.
The heights and locations of the peaks also depend on the history of the universe after recombination. At the end of matter domination and the onset of dark energy domination, further and much slower (compared to that in the radiation epoch) potential decay occurs. The more gradual potential decay causes the induced anisotropy to be suppressed by a factor of . The amplification of the power in the lowest ’s from this late decay serves as a probe of dark energy (or another probe of the matter content in a flat universe). In principle, the degeneracy between and is broken by this effect and by the accompanying change in the redshift at which the matter dominated epoch ends. However, note that the lowest multipoles also have the largest cosmic variance.
The TT and TE power spectra are computed using the Code for Anisotropies in the Microwave Background or CAMB camb which is a parallelized version of CMBFAST cmbfast . The Universe is assumed to be flat, in accord with the predictions of inflation inflation , and the dark energy is assumed to behave as a cosmological constant . The restriction of a flat geometry allows us to relate the dark energy and matter densities at the present time: . The angular power spectrum is calculated on a grid defined by , the baryon density (or ), , the number of equivalent neutrinos , the reionization optical depth , and the spectral index of the primordial power spectrum. Two priors are imposed to largely break the degeneracy between and . For a top-hat distribution is chosen corresponding to the HST measurement, HST , and we require that the universe be older than the globular clusters (which, at , are older than 11 Gyr chaboyer ). For comparison, we also consider the case when the age of the universe exceeds 12 Gyr.
Our top-hat grid, consisting of over 10 million points, is:
-
•
in steps of size 0.02.
-
•
in steps of size 0.001.
-
•
in steps of size 0.01 and , 0.3.
-
•
in steps of size 0.25, in steps of size 0.5 and = 0, 0.5.
-
•
in steps of size 0.025.
-
•
in steps of size 0.01 and , 0.84, 0.88, 1.04, 1.08, 1.12, 1.16, 1.20.
-
•
The normalization of the spectrum is a continuous parameter.
The first year WMAP data are in the form of 899 measurements of the TT power spectrum from to maptt and 449 data points of the TE power spectrum mapte . Although the effect of relativistic degrees of freedom on the TE spectrum is insignificant, it is included in our analysis for completeness. The likelihood of each model of our grid is computed using Version 1.1 of the code provided by the WMAP collaboration mapcode . The code computes the covariance matrix under the assumption that the off-diagonal terms are subdominant. This approximation breaks down for unrealistically small amplitudes. When the height of the first peak is below 5000 (which is many standard deviations away from the data), only the diagonal terms of the covariance matrix are used to compute the likelihood.
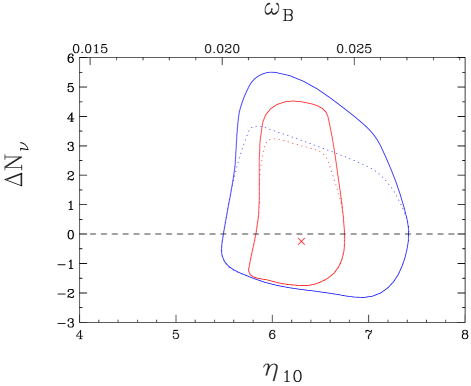
The best-fit parameters are , (), , , , and with a for 1341 degrees of freedom. The allowed parameter space in the –plane is shown in Fig. 3. The solid (dotted) lines correspond to the and regions111For 2-dimensional constraints, the , and regions are defined by , 6.17 and 11.83, respectively. for (12) Gyr. The cross identifies the best-fit point. Note that while this best fit point lies at , the distribution is very broad. After marginalizing over , the range in extends from 0.9 (= ) to 8.3 (= 5.3). Although similar CBR analyses (see Ref. others ) have included different, additional data to that from WMAP alone, making direct comparisons difficult, our results are in good agreement with them. The prior on has a significant effect on the allowed values of kssw for a simple reason. Since flatness is assumed, depends only on the matter content and the Hubble parameter via
| (11) |
The combination of the HST prior on and the prior restricts and help to break the degeneracy between and .
The best fit WMAP-determined baryon density is (), in excellent agreement with Spergel et al. sperg and other similar analyses others . The CBR 2 range extends from () to ().
These CBR constraints on and apply to epochs in the evolution of the universe Kyr. An important test of the standard models of cosmology and particle physics is to compare them with corresponding constraints from the much earlier epoch probed by BBN.
IV The roles of and in BBN
At few MeV, the neutrinos are beginning to decouple from the – plasma and the neutron to proton ratio, crucial for the production of primordial 4He, is decreasing. As the temperature drops below MeV, the two-body collisions between neutrinos and pairs, responsible for keeping the neutrinos in thermal equilibrium with the electron-positron – photon plasma become slow compared to the universal expansion rate and the neutrinos decouple, although they do continue to interact with the neutrons and protons via the charged-current weak interactions. Prior to annihilation, when the temperature drops below MeV and the universe is second old, these interactions, interconverting neutrons and protons, become too slow (compared to the universal expansion rate) to maintain equilibrium and the neutron-to-proton ratio begins to deviate from (exceeds) its equilibrium value (), where is the neutron-proton mass difference. Beyond this point, often described as neutron-proton “freeze-out”, the ratio continues to decrease, albeit more slowly than would have been the case in equilibrium. Since there are several billion CBR photons for every nucleon (baryon), the abundances of any complex nuclei are entirely negligible at these early times.
We note here that if there is an asymmetry between the numbers of and (“neutrino degeneracy”), described by a chemical potential , then the equilibrium neutron-to-proton ratio is modified to . In place of the neutrino chemical potential, it is convenient to introduce the dimensionless degeneracy parameter . A positive chemical potential (; more than ) leads to fewer neutrons and less 4He will be synthesized in BBN.
BBN begins in earnest after annihilation, at MeV ( minutes), when the number density of those CBR photons with sufficient energy to photodissociate deuterium (those in the tail of the black body distribution) is comparable to the baryon density. By this time the ratio has further decreased (the two-body reactions interconverting neutrons and protons having been somewhat augmented by ordinary beta decay; sec.), limiting (mainly) the amount of helium-4 which can be synthesized. As a result, the predictions of the primordial abundance of 4He depend sensitively on the early expansion rate and on the amount – if any – of a asymmetry.
In contrast to 4He, the BBN-predicted abundances of deuterium, helium-3 and lithium-7 (the most abundant of the nuclides synthesized during BBN) are determined by the competition between the various two-body production/destruction rates and the universal expansion rate. As a result, the D, 3He, and 7Li abundances are sensitive to the post-annihilation expansion rate, while that of 4He depends on both the pre- and post-annihilation expansion rates; the former determines the “freeze-in” and the latter modulates the importance of beta decay (see, e.g., Kneller & Steigman knellsteig ). Also, the primordial abundances of D, 3He, and Li, while not entirely insensitive to neutrino degeneracy, are much less effected by a non-zero (e.g., ks ).
Of course, the BBN abundances do depend on the baryon density which fixes the nuclear reactions rates and also, through the ratio of baryons to photons, regulates the time/temperature at which BBN begins. As a result, the abundances of at least two different relic nuclei are needed to break the degeneracy between the baryon density and a possible non-standard expansion rate resulting from new physics or cosmology, and/or a neutrino asymmetry. In this paper only the former possibility is considered; in another publication several of us (along with P. Langacker) have explored the consequences of neutrino degeneracy and we studied the modifications to the constraints on when both of these non-standard effects are simultaneously included.
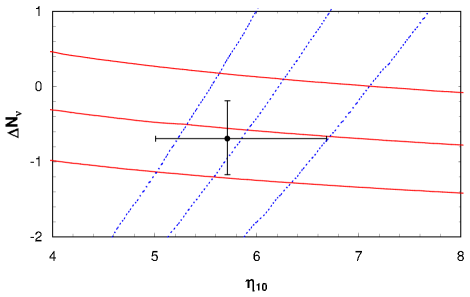
While the abundances of D, 3He, and Li are most sensitive to the baryon density (), the 4He mass fraction (Y) provides the best probe of the expansion rate. This is illustrated in Fig. 4 where, in the – plane, are shown isoabundance contours for D/H and Y (the isoabundance curves for 3He/H and for Li/H, omitted for clarity, are similar in behavior to that of D/H). The trends illustrated in Fig. 4 are easy to understand in the context of the discussion above. The higher the baryon density (), the faster primordial D is destroyed, so the relic abundance of D is anticorrelated with . But, the faster the universe expands (), the less time is available for D-destruction, so D/H is positively, albeit weakly, correlated with . In contrast to D (and to 3He and Li), since the incorporation of all available neutrons into 4He is not limited by the very rapid nuclear reaction rates, the 4He mass fraction is relatively insensitive to the baryon density, but it is very sensitive to both the pre- and post-annihilation expansion rates (which control the neutron-to-proton ratio). The faster the universe expands, the more neutrons are available for 4He. The very slow increase of Y with is a reflection of the fact that for higher baryon density, BBN begins earlier, when there are more neutrons. As a result of these complementary correlations, the pair of primordial abundances and the 4He mass fraction Y, provide observational constraints on both the baryon density and the universal expansion rate when the universe was some 20 minutes old. Comparing these to constraints when the universe was some 380 Kyr old, from the WMAP observations of the CBR spectra, provides a test of the consistency of the standard models of cosmology and of particle physics and further constrains the allowed range of the present baryon density of the universe.
V Primordial Abundances
It is clear from Fig. 4 that while D (and/or 3He and/or 7Li) largely constrains the baryon density and 4He plays the same role for , there is an interplay between and which is quite sensitive to the adopted abundances. For example, a lower primordial D/H increases the BBN-inferred value of , leading to a higher predicted primordial 4He mass fraction. If the primordial 4He mass fraction derived from the data is “low”, then a low upper bound on will be inferred. Therefore, it is crucial to make every effort to avoid biasing any conclusions by underestimating the present uncertainties in the primordial abundances derived from the observational data. For this reason deuterium is adopted as the baryometer of choice. Primarily, this is because its observed abundance should have only decreased since BBN els , but also because the deuterium observed in the high redshift, low metallicity QSO absorption line systems (QSOALS) should be very nearly primordial. In contrast, the post-BBN evolution of 3He and of 7Li are considerably more complicated, involving competition between production, destruction, and survival. As a result, at least so far, the current, locally observed (in the Galaxy) abundances of these nuclides have been of less value in constraining the baryon density than has deuterium. Nonetheless, inferring the primordial D abundance from the QSOALS has not been without its difficulties, with some abundance claims having been withdrawn or revised. Presently there are 5 – 6 QSOALS with reasonably firm deuterium detections bta ; btb ; o'm ; pb ; dod ; k . However, there is significant dispersion among the abundances and the data fail to reveal the anticipated “deuterium plateau” at low metallicity or at high redshift gs01 . Furthermore, subsequent observations of the D’Odorico et al. dod QSOALS by Levshakov et al. lev01 revealed a more complex velocity structure and led to a revised – and more uncertain – deuterium abundance. This sensitivity to the often poorly constrained velocity structure in the absorbers is also exposed by the analyses of published QSOALS data by Levshakov and collaborators lev1 ; lev2 ; lev3 , which lead to consistent, but somewhat higher deuterium abundances than those inferred from “standard” data reduction analyses. In the absence of a better motivated choice, here we adopt the five abundance determinations collected in the recent paper of Kirkman et al. k . The weighted mean value of is 2.6 222This differs from the result quoted in Kirkman et al. because they have taken the mean of log() and then used it to infer ( ).. But, the dispersion among these five data points is very large. For this data set for four degrees of freedom, suggesting that one or more of these abundance determinations may be in error, perhaps affected by unidentified and unaccounted for systematic errors. For this reason, we follow the approach advocated by o'm and k and adopt for the uncertainty in the dispersion divided by the square root of the number of data points. Thus, the primordial abundance of deuterium to be used here is chosen to be: . For SBBN (, ), at this corresponds to a baryon density () 333We have purposely avoided quoting the baryon density to more significant figures than is justified by the accuracy of the D-abundance determination..
A similar, less than clear situation exists for determinations of the primordial abundance of 4He. At present there are two, largely independent, estimates based on analyses of large data sets of low-metallicity, extragalactic H regions. The “IT” itl ; it estimate of Y(IT) , and the “OS” determination os ; oss ; fo of Y(OS) which differ by nearly . The recent analysis of high quality observations of a relatively metal-rich (hence, chemically evolved and post-primordial) H region in the Small Magellanic Cloud (SMC) by Peimbert, Peimbert, and Ruiz (PPR) ppr yields an abundance Y. When PPR extrapolated this abundance to zero metallicity, they found Y(PPR) , lending support to the OS value. These comparisons of different observations and analyses suggest that unaccounted systematic errors may dominate the statistical uncertainties. Indeed, Gruenwald, Steigman, and Viegas gsv argue that if unseen neutral hydrogen in the ionized helium region of the observed H regions is accounted for, the IT estimate of the primordial abundance should be reduced to Y(GSV) (see also vgs ; sj ). Here, we adopt this latter estimate for the central value but, as we did with deuterium, the uncertainty is increased in an attempt to account for likely systematic errors: Y , leading to a 2 range, Y ; this range is in accord with the estimate adopted by Olive, Steigman, and Walker (OSW) osw in their review of SBBN. Although we will comment on the modification to any conclusions if Y(IT) is substituted for Y(OSW), Figs. 4 – 8 are shown for and Y(OSW) = .
VI Standard BBN
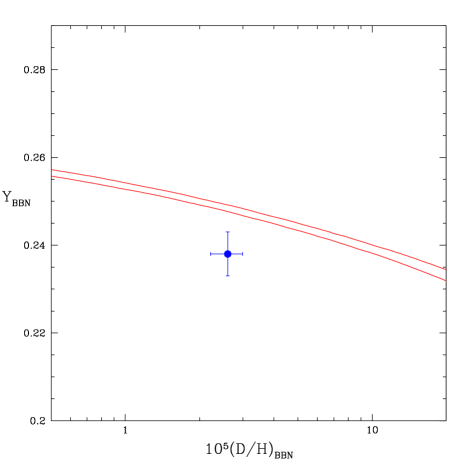
Before proceeding to our main goal of constraining new physics using BBN, it is worthwhile to set the scene by considering the standard model case ( = 3, ) first. The result of this comparison is well known: there is a “tension” between the primordial abundances of D and 4He inferred from the observational data and those predicted by SBBN. For example, if is used to fix the baryon density ( ) then, at , (), the corresponding predicted 4He abundance is Y (), which is some 2 higher than either the OSW or the IT estimates. This is illustrated in Fig. 5 which shows the SBBN-predicted relation between the relic abundances of D and 4He along with the Y(OSW) abundance estimate adopted here. The D-inferred baryon density is in excellent agreement with the baryon density determined independently (non-BBN; ) by Spergel et al. sperg from a combination of CBR and Large Scale Structure data (2dF + Lyman ): () 444It should be noted that from the CBR alone Spergel et al. find (). It is this value which is most directly comparable to our CBR and joint BBN/CBR results.. Thus, it appears that 4He is the problem: the primordial abundance of 4He is smaller than predicted for SBBN given either the observed deuterium abundance or the non-BBN inferred baryon density. At the same time we strongly emphasize that this “discrepancy” is only at the level and we should celebrate the excellent agreement between the baryon density determined when the universe was only 20 minutes old and when the universe was some 380 Kyr old (CBR).
VII Non-Standard BBN:
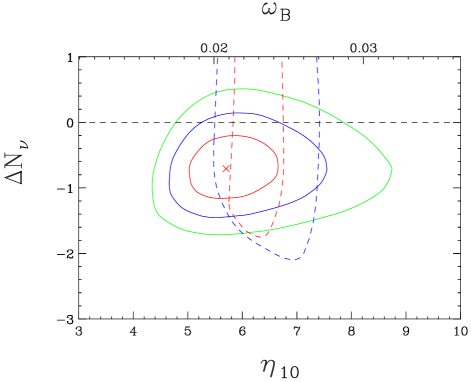
As noted above, for SBBN () the observationally inferred primordial abundance of 4He is too small (by ) for the baryon density inferred either from the D abundance or from the non-BBN analysis of Spergel et al. sperg . This suggests that the early universe expansion rate may have been too fast, leaving too many neutrons available for the synthesis of 4He. If this tension between 4He and D (or, between 4He and ) should persist, it could be a signal of non-standard physics corresponding to (). Indeed, in Fig. 4 it can be seen that for the adopted primordial abundances of D and 4He, there is a “perfect” fit () for () and . Although is only disfavored by , any increase in the early universe expansion rate (, ) is strongly disfavored. This is illustrated in Fig. 6 which shows the 1, 2 and 3 contours in the –plane for the adopted D and 4He (OSW) abundances. The shape of these contours reflects our much discussed complementarity between D and 4He: D provides the best constraint on the baryon density while 4He is most sensitive to the early universe expansion rate, the latter providing an excellent probe of possible new physics.
With reference to that Fig. 6 we note that even one extra, fully thermalized neutrino (= 1) is strongly disfavored. This seemingly eliminates the sterile neutrino suggested by the LSND experiment lsnd . For the LSND parameters, in the absence of significant neutrino asymmetry, this “sterile” neutrino would have been mixed with the active neutrinos and thermalized prior to neutrino decoupling (prior to BBN) paul . If such a neutrino were to exist, the “new” standard model would correspond to = 4. This would be a disaster since for = 4 and the OSW 4He abundance the minimum (which now occurs at ) is greater than 20. The situation is even worse for the IT 4He abundance since the smaller uncertainty in Y forces a much smaller baryon density (), with !
VII.1 Requiring
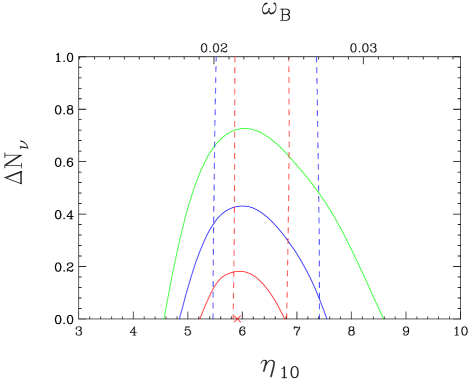
Since, as is well known from LEP pdg , there are three flavors of active, left-handed neutrinos (and their right-handed antiparticles), any extra contributions to the relativistic energy density at BBN should result in . Of course, “new physics” in the form of non-minimally coupled fields (e.g., css ; knellsteig and references therein) or from higher-dimensional phenomena (e.g., rs ; rs1 ; rs2 ; rs3 ; rs4 ; rs5 ; rs6 ; rs7 ; bratt ) may result in an effective . If, however, the class of non-standard physics of interest is restricted to , then the BBN constraints presented above (and those from the CBR) will change. With a prior of , the best fit BBN-determined values of the baryon-to-photon ratio and (for Y(OSW)) shift from and , to and . The value of changes to 4.2. The corresponding confidence contours in the –plane are shown in Fig. 7.
VIII Joint Constraints And Summary
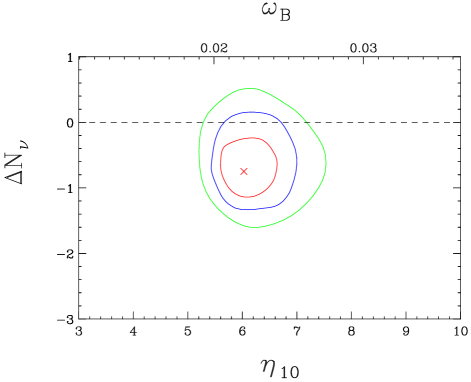
As may be seen from Figs. 6 and 7, the agreement between the values obtained for and from WMAP and from BBN separately is excellent. Guided by this, the BBN and CBR results are combined to obtain the joint fit in the – plane shown in Fig. 8. To a good first approximation, BBN (and primordial 4He) determines while WMAP fixes (with some help from BBN and primordial D). The corresponding figure for for the joint fit has not been shown because again the range is almost identical to that from BBN alone (Fig. 7).
| (2 range) | (2 range) | |
|---|---|---|
| WMAP | 0.9 – 8.3 | 5.58 – 7.26 |
| + Y(OSW) | 1.7 – 3.0 | 4.84 – 7.11 |
| + Y(IT) | 2.4 – 3.0 | 5.06 – 7.33 |
| WMAP + + Y(OSW) | 1.7 – 3.0 | 5.53 – 6.76 |
| WMAP + + Y(IT) | 2.4 – 3.0 | 5.58 – 6.71 |
| (2 bound) | (2 range) | |
|---|---|---|
| WMAP | 8.3 | 5.64 – 7.30 |
| + Y(OSW) | 3.3 | 5.04 – 7.18 |
| + Y(IT) | 3.1 | 4.89 – 6.56 |
| WMAP + + Y(OSW) | 3.3 | 5.66 – 6.80 |
| WMAP + + Y(IT) | 3.1 | 5.54 – 6.60 |
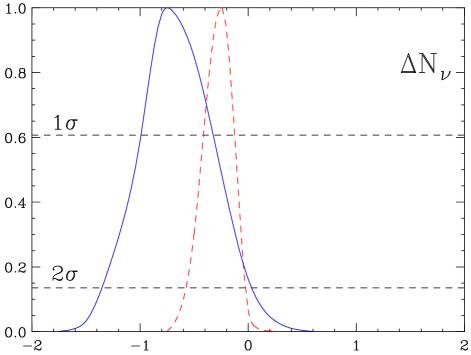
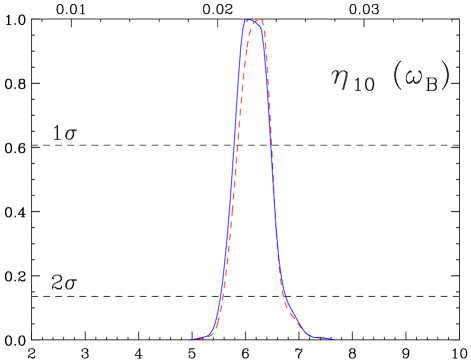
Our results are summarized in Tables I and II and Figs. 9 and 10. BBN and the primordial D abundance combine to provide a quite accurate determination of the baryon density ( at ). The currently large uncertainty in the primordial abundance of 4He is responsible for the larger allowed range of . While the best fit value for is for either the OSW or the IT 4He abundances, each are consistent with = 3 at . These results are in excellent agreement with those of Hannestad others , with which they are most directly related.
Clearly, BBN constrains much more stringently than WMAP, while the measurement of by WMAP is at a precision superior (by a factor ) to that from BBN. In this sense, the CBR and BBN are quite complimentary. Indeed, while the constraint on barely changes with the inclusion of the WMAP data in a joint analysis with BBN, it is sensitive to the adopted 4He abundance; see Fig. 9. On the other hand, the joint constraint on is extremely insensitive to the choice of the 4He abundance, being dominated by the WMAP data (and the primordial D abundance); see Fig. 10. However, BBN and WMAP do provide a very important consistency check of the standard model of cosmology at widely separated epochs, using significantly different physics. The excellent agreement between and when the universe was 20 minutes and 380,000 years old is a major triumph for the (new) standard model of cosmology.
Acknowledgements.
Extensive computations were carried out on the CONDOR system at the University of Wisconsin, Madison with parallel processing on up to 200 CPUs. We thank S. Dasu, W. Smith, D. Bradley and S. Rader for providing access to and assistance with CONDOR. This research was supported by the U.S.DOE under Grants No. DE-FG02-95ER40896, No. DE-FG02-91ER40676, No. DE-FG02-02ER41216, and No. DE-FG02-91ER40690, by the NSF under Grant No. PHY99-07949 and by the Wisconsin Alumni Research Foundation. VB, DM and GS thank the Kavli Institute for Theoretical Physics at the University of California, Santa Barbara for its support and hospitality.References
- (1) C. L. Bennett et al., astro-ph/0302207.
- (2) D. Kirkman, D. Tytler, N. Suzuki, J. O’Meara, & D. Lubin, astro-ph/0302006 (2003).
- (3) G. Steigman, D. N. Schramm, & J. E. Gunn, Phys. Lett. 66B, 202 (1977).
- (4) L. Randall & R. Sundrum, Phys. Rev. Lett. 83, 3370 (1999); Phys. Rev. Lett. 83, 4690 (1999).
- (5) J. M. Cline, C. Grojean, & G. Servant, Phys. Rev. Lett. 83, 4245 (1999).
- (6) P. Binetruy, C. Deffayet, U. Ellwanger, & D. Langlois, Phys. Lett. B477, 285 (2000).
- (7) R. Maartens, D. Wands, B. Bassett, & I. Heard, Phys. Rev, D62, 041301 (2000).
- (8) D. Langlois, R. Maartens, M. Sasaki, & D. Wands, Rev, D63, 084009 (2001).
- (9) S. Mizuno & K. Maeda, Phys. Rev. D64, 123521 (2001).
- (10) J. D. Barrow & R. Maartens, Phys. Lett. B532, 155 (2002).
- (11) K. Ichiki, M. Yahiro, T. Kajino, M. Orito, & G. J. Mathews, Phys. Rev. D66, 043521 (2002).
- (12) J. D. Bratt, A. C. Gault, R. J. Scherrer, & T. P. Walker, Phys Lett B546, 19 (2002)
- (13) For a recent review see, W. Hu and S. Dodelson, astro-ph/0110414.
- (14) A. Lewis, A. Challinor and A. Lasenby, Astrophys. J. 538, 473 (2000) [astro-ph/9911177]; http://camb.info/
- (15) U. Seljak and M. Zaldarriaga, Astrophys. J. 469, 437 (1996) [astro-ph/9603033].
- (16) A. H. Guth, Phys. Rev. D 23, 347 (1981).
- (17) W. L. Freedman et al., Astrophys. J. 553, 47 (2001) [astro-ph/0012376].
- (18) L. M. Krauss and B. Chaboyer, Science 299, 65 (2003).
- (19) G. Hinshaw et al., astro-ph/0302217.
- (20) A. Kogut et al., astro-ph/0302213.
- (21) L. Verde et al., astro-ph/0302218.
- (22) P. Crotty, J. Lesgourgues and S. Pastor, astro-ph/0302337; E. Pierpaoli, astro-ph/0302465; S. Hannestad, astro-ph/0303076.
- (23) see, e.g., J. P. Kneller, R. J. Scherrer, G. Steigman, & T. P. Walker, Phys. Rev. D64, 123506 (2001).
- (24) D. N. Spergel, et al. astro-ph/0302209.
- (25) J. P. Kneller & G. Steigman, Phys. Rev. D67, 063501 (2003).
- (26) H. S. Kang & G. Steigman, Nucl. Phys. B372, 494 (1992).
- (27) R. Epstein, J. Lattimer, & D. N. Schramm, Nature 263, 198 (1976).
- (28) S. Burles & D. Tytler, ApJ 499, 699 (1998a).
- (29) S. Burles & D. Tytler, ApJ 507, 732 (1998b).
- (30) J. M. O’Meara, et al. , ApJ 552, 718 (2001).
- (31) M. Pettini & D. V. Bowen, ApJ 560, 41 (2001).
- (32) S. D’Odorico, M. Dessauges-Zavadsky, & P. Molaro, A&A 338, L1 (2001).
- (33) G. Steigman, To appear in the Proceedings of the STScI Symposium, ”The Dark Universe: Matter, Energy, and Gravity” (April 2 – 5, 2001), ed. M. Livio [astro-ph/0107222].
- (34) S. A. Levshakov, M. Dessauges-Zavadsky, S. D’Odorico, & P. Molaro, ApJ 565 696 (2002).
- (35) S. A. Levshakov, W. H. Kegel & F. Takahara, ApJ 499, L1 (1998).
- (36) S. A. Levshakov, W. H. Kegel & F. Takahara, A&A 336, 29L (1998).
- (37) S. A. Levshakov, W. H. Kegel & F. Takahara, MNRAS 302, 707 (1999).
- (38) Y. I. Izotov, T. X. Thuan, & V. A. Lipovetsky, ApJS 108, 1 (1997).
- (39) Y. I. Izotov & T. X. Thuan, ApJ 500, 188 (1998).
- (40) K. A. Olive & G. Steigman, ApJS 97, 49 (1995).
- (41) K. A. Olive, E. Skillman, & G. Steigman, ApJ 483, 788 (1997).
- (42) B.D. Fields & K. A. Olive, ApJ 506, 177 (1998).
- (43) M. Peimbert, A. Peimbert, & M. T. Ruiz, ApJ 541, 688 (2000).
- (44) R. Gruenwald, G. Steigman, & S. M. Viegas, ApJ 567, 931 (2002).
- (45) S. M. Viegas, R. Gruenwald, & G. Steigman, ApJ 531, 813 (2000).
- (46) D. Sauer & K. Jedamzik, A&A 381, 361 (2002).
- (47) K. A. Olive, G. Steigman, & T. P. Walker, Phys. Rep. 333, 389 (2000).
- (48) A. Aguilar et al. [LSND Collaboration], Phys. Rev. D 64, 112007 (2001) [hep-ex/0104049].
- (49) P. Langacker, UPR-0401T.
- (50) K. Hagiwara et al. [Particle Data Group Collaboration], Phys. Rev. D 66, 010001 (2002).
- (51) X. Chen, R. J. Scherrer, & G. Steigman, Phys. Rev. D63, 123504 (2001).