hep-ph/0305071
DESY 03-054
Hadronic Cross-sections in two photon Processes at a Future Linear Collider111 E-mails: (a)rohini.godbole@desy.de, (b) deroeck@mail.cern.ch, (c) igrau@ugr.es (d) Giulia.Pancheri@lnf.infn.it
R. M. Godbole 222Permanent Address: Centre for Theoretical Studies, Indian Institute of Science, Bangalore 560 012, India.
Theory Division, DESY, Notkestrasse 85, D-22603 Hamburg, Germany
A. De Roeckb
CERN, CH-1211, Geneva-23, Switzerland
A. Grauc
CAFPE and DFTC, Universidad de Granada, Spain
G. Pancherid
Laboratori Nazionali di Frascati dell’INFN,
Via E. Fermi 40, I 00044, Frascati, Italy.
Abstract
In this note we address the issue of measurability of the hadronic cross-sections at a future photon collider as well as for the two-photon processes at a future high energy linear collider. We extend, to higher energy, our previous estimates of the accuracy with which the cross-section needs to be measured, in order to distinguish between different theoretical models of energy dependence of the total cross-sections. We show that the necessary precision to discriminate among these models is indeed possible at future linear colliders in the Photon Collider option. Further we note that even in the option a measurement of the hadron production cross-section via processes, with an accuracy necessary to allow discrimination between different theoretical models, should be possible. We also comment briefly on the implications of these predictions for hadronic backgrounds at the future TeV energy collider CLIC.
1 Introduction
The rising total cross-section in proton-proton collisions was a very early indication of QCD processes at work, reflecting the fact that the increasing energy allows a deeper probe of the structure of the colliding particles, leading to liberation of more constituents which results in a higher scattering probability[1]. The proton-proton and proton anti-proton cross-sections are now known experimentally to a very good precision over a large energy range. We still do not have a full theoretical understanding of these cross-sections starting from first principles, but there are various models of hadronic interactions whose parameters can be completely fixed by the data and which then allow for good predictions of the total cross-section in the high energy region, certainly up to LHC energies. Thus, although not everything is calculable from first principles in QCD, the total hadronic production at future hadronic accelerators can be predicted. Deviations from these predictions, beyond the theoretical errors, could indicate the onset of new physics, just like the rise of total cross-section, first observed at the ISR[1], was indeed the signal of hitherto undetected partonic interactions.
The situation is quite different for the photon induced processes in that the data cover a smaller energy range and also have larger errors. This renders the issue of measurement of the total cross-section at energies in the region 300-500 GeV, very important both from the theoretical, as well as an experimental point of view. Indeed, the question of hadron production in collisions is interesting for achieving a good theoretical understanding of the rise of the hadronic cross-sections with energy, in the framework of QCD or otherwise, as well as from a much more pragmatic viewpoint of being able to estimate the hadronic backgrounds [2] at the next linear colliders, particularly in the photon collider option as well in the option like CLIC [3] in the higher energy range. HERA and LEP have opened the way to an entire new field in QCD, the study of the hadronic interactions of the photon in terms of its quark and gluon content [4]. The rise in the total hadronic cross section begins to take place at centre of mass energies below 100 GeV but to determine the steepness of the rise one needs points in the range 300-500 GeV and at even higher energies. These do not exist. Different models have been suggested in the context of rise of the hadronic cross-sections in and processes. All of these ‘explain’ the rise for the and case equally well but differ substantially in their predictions for collisions even at the modest values of the energies that are currently available. However, within various experimental uncertainities they are all compatible with the current data. Thus to gain a good theoretical understanding of the total cross-section for processes, as in the case of hadronic collisions, one needs much higher energies and better statistics than the one currently available.
In the next section we discuss the available data on total hadronic cross sections at high energies. In section 3 we introduce photon colliders and present recent model predictions for the cross-sections. Section 4 details the simulation study made to assess the possible precision of the experimental measurement of the hadronic cross-sections at the photon colliders. In the next sections we discuss the required precision in the measurement of total hadronic cross-sections so as to distinguish among different models at the photon colliders and colliders respectively and then we end with conclusions.
2 Status of the currently available data and models
The currently available experimental information on total hadronic cross-sections for photon induced processes comes from the colliders PEP[5], PETRA[6] and LEP[7, 8] as well as HERA[9]. LEP and HERA provide the higher energy data. At LEP phase space limits the centre of mass system (CMS) energy, , of the interactions to about 100 GeV, whereas at HERA is higher. However, at HERA the presence of the proton partly obscures the issue. Fig. 1 shows a collection of data for the total hadronic
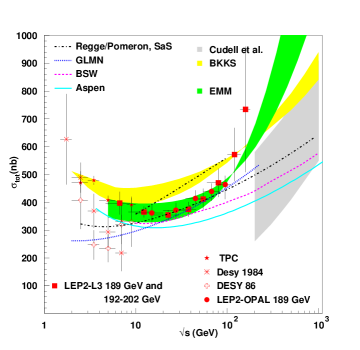
cross-section from the various experiments in comparison with the predictions from a number of theoretical models summarised in Ref. [10]. The predictions have been plotted from “proton-like” models, labelled SaS[11], Aspen[12], BSW[13], as well as from QCD and Regge inspired models, like the curve labelled GLMN[14] and the band labelled BKKS[15]. The band labelled EMM covers predictions of two different formulations, inelastic and total. For the EMM, we have used two sets of representative parameters[10], both of which are obtained from the cross-section following the procedure outlined in [16]. All models predict a rise of the cross-section with the collision energy , but with very different slopes. Also shown, by the region shaded in intermediate grey labelled Cudell et al, is a recent attempt of using only the low energy data to predict and at TeV energies [17]. Within errors, their predictions are seen to cover the range spanned by the predictions of almost all the models discussed here. Further note that, until five years ago, the available data for processes stopped short of GeV and did not show any rise. The data in this energy range have very large errors, show a large spread and the compatibility of the different experiments is marginal. A re-measurement of this region, as planned at VLEP in Novisibirsk, may be very useful even for understanding the high energy region as will be shown below.
The L3 [7] and OPAL [8] data have drastically changed the situation. Presently, the cross-section data indicate a very clear rise, which may be even stronger than in hadron-hadron collisions. This can be shown through Regge inspired fits of the type
| (1) |
where and are expected to be process independent, i.e. the same in , , and collisions.
First we note that the recent data from LEP shown in Fig. 1 have been corrected with models for acceptance and particularly for the invisible elastic cross sections and the low acceptance diffractive processes. To this end, Monte Carlo simulation programs like PYTHIA[18] and PHOJET[19] have been used, which have different elastic and diffractive component predictions. The correction factors are different for these two and are large. Both L3 and OPAL follow now the same strategy to present their data, by taking the average of the results obtained with both models. The data of the experiments agree in the region of overlap.

| Data | (nb) | (nb) | (nb) | ||
|---|---|---|---|---|---|
| L3 | – | 2.4 | |||
| L3 | – | fixed | 25 | ||
| L3 | ,fixed | ||||
| , fixed | 1.3 | ||||
| L3+OPAL | – | 4.0 | |||
| L3+OPAL | – | fixed | 26 | ||
| L3+OPAL | ,fixed | ||||
| fixed | 2.8 |
Table 1 shows results of fits to the measurements in the form of Eq. 1, using the full errors (except for the model dependence), not taking into account correlations. Similar values for the parameters are obtained using only the statistical errors. Since the power of the Regge term and its size cannot be both determined from the LEP data alone, we take the value measured in and interactions as given in the PDG[20], namely . We then consider three cases:
-
•
Fit1: All parameters and are left free
-
•
Fit2: is fixed to 0.093, as measured in and collisions, the other parameters are left free
-
•
Fit3: is fixed to 0.093, but a second pomeron term of the form as proposed in [21] was added with and the normalization fitted.
The fits are made for the L3 data alone – which have the largest range– and the L3+OPAL data. In the latter case the results remain dominated by the L3 data, but the relatively low increase in value shows that these data sets are now well compatible with each other. The results of the fit are shown in Fig. 2. Clearly the L3 data reject Fit2. A universal pomeron slope of about 0.08-0.093 is not compatible with the L3 data. Fit1 shows that the pomeron term is of order 0.2-0.3. This remains true if the fits are made to the data corrected with either PHOJET or PYTHIA separately as the L3 collaboration reports in their paper [7]. Using two pomerons terms with a fixed power following [21], as in in Fit3, also accounts for the rise. Based on these data alone, and without taking into account correlations between the data points, the second pomeron component in the data is visible with about 5 significance. These results do not change significantly if the data-point at the largest value is excluded from the fit. The results do show a dependence on the model used for unfolding the cross-sections. We find for the L3 data, that correcting the data using Pythia or Phojet at a time, instead of taking an average of both these models, yields values of of and respectively for Fit1. A similar model dependence in the fits was observed in [22]. Note however, that both values of are still significantly larger than the soft pomeron value of . Thus the total cross section appears to rise faster than in hadron-hadron collisions. It is however imperative that other LEP experiments make similar analyses in the high region to confirm this important result.
The results depend on the value of used in the fits. E.g. changing in the range of yields a slope of in Fit1 and the cross section for the second hard pomeron from in Fit3. While the main message of the fits to the data remains the same for these values, the exact value of the pomeron slope or cross section depends on the Regge power. To pin down the Regge part, better measurements at low energy in dedicated experiments will be needed.
Thus a study of high energy behaviour of the two-photon total cross section holds potential of yielding very interesting information. Improved or additional data in the LEP range from other experiments can help but there are a number of theoretical and experimental issues, which only an Linear Collider (LC) can clarify, by reaching higher energies.
We now turn to discuss the models proposed so far for . A review of the theoretical ideas and issues on the total cross section behaviour in collisions was presented in [10]. As mentioned already, all models predict a rise of the cross-section with the collision energy , but with very different slopes. The dramatic differences in the predictions for high energies show our present lack of understanding. In pure proton-like models (for example the solid curve [12]), the rise follows closely that of the proton-proton cross-section, while in QCD based models (upper [15] and lower [10] bands), the rise is obtained using the eikonalized pQCD jet cross-section. The upper and lower here refer to the position of the bands at low energy. In order to give a quantitative estimate of the energy dependence in the different models, one can fit the model predictions with eq.1 and calculate, for each model, the effective values of and . The results for three of the models are given in
| Model | (nb) | (nb) | ||
|---|---|---|---|---|
| BKKS (upper edge) | 166.5 | 0.13 | 538.2 | 0.38 |
| BKKS (lower edge) | 180.6 | 0.11 | 356.5 | 0.18 |
| Aspen | 145.7 | 0.094 | 517.5 | 0.39 |
| EMM (lower edge) | 14.01 | 0.34 | 475.4 | 0.14 |
| EMM (upper edge) | 19.9 | 0.29 | 475.3 | 0.084 |
Table 2. As expected, the slope for the Aspen model is close to that of the proton cross-sections, while the QCD based models, EMM or BKKS, are described by values in the range –. Note, however, that the earlier discussion of the fits shows that the lower values of are in disagreement with the present data.
The discussion above just shows that data seem to indicate larger values for in eq. (1) for processes, i.e. a faster rise with energy than for the processes. In addition, we also see that different models differ greatly in their predictions. All this makes it clear that a good measurement of the total hadronic cross-section for photon induced processes is quite important. In the next sections we will examine the experimental issues involved in measuring two-photon interactions at a future high energy e+e- and collider, extending previous estimates up to energy of 1 TeV in the centre of mass frame.
3 Linear colliders and Two Photon Physics.
Two photon processes at future high energy LC can be measured either as in a storage ring, via photon emission from the lepton beams, according to a Weizsäcker Williams(WW)[23] energy distribution, or using the LC in a photon collider mode [24]. In the latter case the high energy electron beam is converted into a high energy photon beam, by backscattering of photons off an intense laser beam, just before the interaction point. The maximum energy of the generated photons is given by , with the electron beam energy and with and the laser photon energy and angle between the electron and laser beam. The distance of the conversion to the interaction point is in the range of several mm to a few cm. A typical value for is 4.8, which leads to photon spectra which peak around . Hence, a typical distribution of luminosity as a function of the invariant mass peaks at the maximum reachable invariant mass of around with a width of for collisions. The ’luminosity’ is usually defined to be the luminosity corresponding to the region and is typically 10% of the geometrical luminosity. However, since the electron beams are converted before collision, smaller functions at the interaction point can be allowed for. This can make up for part of the luminosity lost compared to an collider, by using smaller beam spots. For TESLA [25], for an LC with initial CMS energy of 500 GeV, one finds [26] This leads to event samples corresponding to a luminosity of the order 100 fb-1 per year, for the Photon Collider. Similar numbers are obtained for CLIC [27].
4 Simulation study
First we consider the case for the e+e-collider mode. Present data for the two photon cross-section at LEP are hampered by experimental and detector limitations. For two photon events coming from interactions of quasi-real photons, the electrons disappear in the beam-pipe. Hence the only information available is the hadronic final state. The variable needs to be reconstructed from the visible hadronic final state in the detector. At the highest energies for a 500 GeV LC the hadronic final state extends in pseudorapidity in the region , as shown in Fig. 3a, while a typical LC detector covers roughly the region . Hence the correlation of the measured compared to the true one will be even poorer at the LC than at LEP, as shown in Fig. 3b. However, some information can be obtained by measuring the total integrated cross-section above a value (see Section 5).
For a collider the photon beam energy can be tuned with a spread of less than 10%, such that measurements of can be made at a number of “fixed” energy values in e.g. the range GeV by changing the beam energy of the collider, as shown in Fig. 3c. For the spectra shown it was assumed in the simulation that the same value of is kept at each energy, which means that the wavelength of the laser needs to be changed at each beam energy. A more likely scenario is that the same laser is used at the lower energies, which will then have correspondingly different values, and thus somewhat different spectra.
In the simulation study events were selected with visible GeV, and it was asumed that a minimum of three charged tracks would be detected in the experiment. The acceptance for non-diffractive events was found to be about 95%. The simulation shows that the diffractive non-elastic events are accepted with 35% efficiency, while elastic events are essentially lost. Hence to measure the total cross-section with sufficient precision specially designed measurements for the diffractive components will be required. To that end also measurements at lower energy (e.g. LEP) will be useful, in order to extrapolate the elastic component. A technique to measure diffractive contributions separately, mirrored to the rapidity gap methods used at HERA, has been proposed in [29]. It is assumed here that such measurements will be made, and it will be possible to reduce the systematic error due to the diffractive component.

| Type | Value | Comment |
|---|---|---|
| Selection cuts | 3% | HERA/frag. parameters |
| Diffraction | 3-8% | events |
| Detector smearing | 3% | HERA |
| Lumi/ spectrum | 3-4% | short runs ( one day) |
| Bin correction | 2% | spread |
The absolute precision with which these cross-sections can be measured ranges from 5% to 10% for collider like TESLA, in the CMS energy range up to 700 GeV. The important contributions to the errors come from the control of the diffractive component of the cross-section, Monte Carlo models used to correct for the event selection cuts, the knowledge of absolute luminosity and shape of the luminosity spectrum. For a photon collider based on CLIC [27], which could reach values up to 2 TeV and beyond, the corresponding error range is from about 7 to 15%. The errors given in Table. 3 are estimated using SIMDET [28] and extrapolations from HERA and LEP studies.

Fig. 4 shows present photon-photon cross-section data in comparison with predictions at higher photon energies from some of the recent phenomenological models [10] illustrated in Fig. 1. Because of uncertainties in the overall normalization, some of the curves reproduced in this figure have been scaled (up or down) so as to overlap with the low energy data point from LEP experiments. This emphasizes solely the energy dependence and reduces the uncertainties due to the low energy normalization. Pseudo data points from one of (thus scaled) models [15] are added with a systematic error of –. The statistical errors are small since even only for a day of running at a given energy, events are produced. Statistical samples of order events will be sufficient for this measurement.
5 Precision needed to distinguish between models
In this section we update previous estimates [10, 30] for the precision needed to distinguish between different models for the total cross-section.
| (GeV) | Aspen | BSW | DL | |
|---|---|---|---|---|
| 20 | 309 nb | 330 nb | 354 nb | 7% |
| 50 | 330 nb | 368 nb | 402 nb | 10% |
| 100 | 362 nb | 401 nb | 450 nb | 10% |
| 200 | 404 nb | 441 nb | 507 nb | 9% |
| 500 | 474 nb | 515 nb | 598 nb | 8% |
| 700 | 503 nb | 543 nb | 636 nb | 8% |
| 1000 | 538 nb | 578 nb | 679 nb | 7% |
In Table 4 we show total cross-sections for three models of the ‘photon-is-like-the-proton’ type. The last column shows the 1 level precision needed to discriminate between Aspen[12] and BSW[13] models. The model labelled DL is obtained from Regge/Pomeron exchange and factorization at the residues [31], with parameters from ref.[20]. Table 5 gives the precision needed to distinguish between the two minijet formulations of Fig. 1 and the BKKS model[15].
| EMM, Inel,GRS | EMM, Tot,GRV | BKKS | ||
|---|---|---|---|---|
| (=1.5 GeV) | (=2 GeV) | GRV | ||
| 20 | 399 nb | 331 nb | 408 nb | 2 % |
| 50 | 429 nb | 374 nb | 471 nb | 9% |
| 100 | 486 nb | 472 nb | 543 nb | 3% |
| 200 | 596 nb | 676 nb | 635 nb | 6% |
| 500 | 850 nb | 1165 nb | 792 nb | 7 % |
| 700 | 978 nb | 1407 nb | 860 nb | 13 % |
| 1000 | 1133 nb | 1694 nb | 940 nb | 19% |
The last column in Table 5 gives the percentage difference between the two models which bear closest results among these three.
A detailed comparison of the predictions reveals that in order to distinguish between all the models the cross-sections need to be determined to a precision of better than 10% [10] at a future 0.5-1 TeV e+e-collider. This seems feasible from the simulation studies discussed above. It should be pointed out that some of the differences in the model predictions even at higher energies are due to the low energy normalization. If all the models were to be scaled down to the same value, for instance at 50 GeV c.m. energy, then differences among the different proton like models would very much decrease. Not so for the QCD based models, which continue to show very different high energy behaviour.
On the other hand, while the absolute cross-sections are measured with limited precision, the change of the cross-section with energy can be determined much more accurately. Fitting the data of the collider to the Regge inspired form in the high energy region, one can determine with a precision of . The models show a variation between and and hence can be distinguished.
6 in the mode
It will be difficult to measure with sufficient precision in the normal mode of the linear collider, however some information can be gained from measuring the cross-section . This is calculated by convoluting the total cross-section with the spectrum of these photons. This spectrum is given by the Weizsäcker Williams(WW) or effective photon approximation[23] which has been used quite successfully to translate photoproduction cross-sections into those for electron initiated processes. There have been many discussions of the improvements on the original WW approximation [32]. This has also been extended to include the effects of a reduction in the parton content of the photon due to virtuality of the photon [33], while dealing with the resolved photon processes. The cross-section, including the effects due to (anti)tagging of the electron is given by
| (2) |
Here where is the c.m. energy of the collider. The WW spectrum used is given by
| (3) |
where
Here, using the maximal scattering angle for the outgoing electron, we have taken anti-tagging into account and have included the suppression of the photonic parton densities due to its virtuality following ref. [34].
To select events, a minimum value of is required, selecting a region such that the value of can be corrected for smearing and losses with sufficient precision. Also a maximum value is imposed, because the events resemble annihilation events for too large a value of and cannot be easily separated. Additionally an anti-tagging condition for the scattered electrons is imposed. SIMDET simulation studies lead to choose the region 50 GeV2 , and the anti-tagging cuts are . With these cuts the total cross-section can be determined with a precision of 5-10%.
In Fig. 5, we show the cross-section
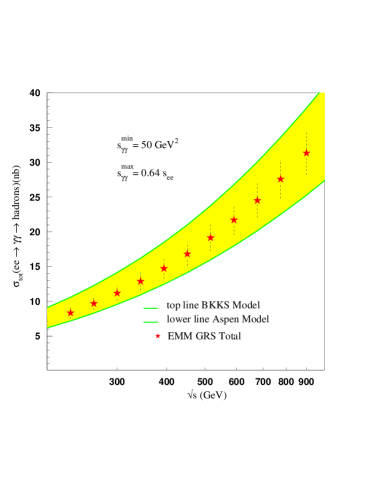
as a function of of the machine. The top curve corresponds to the prediction for of the BKKS model [15] and the lower curve corresponds to the prediction of the Aspen model [12]. Note that the difference of about factor 2 (say) at GeV, is reduced to about after convolution with the bremsstrahlung spectrum. The ‘data points’ are given with a pessimistic error of 10%. Hence even in the worst of the cases (no photon collider, large uncertainties in the cross-section measurement) a linear collider with GeV, can definitively contribute to a further understanding of the energy dependence of the total cross-section.
Eq. 2 can also be used to calculate the number of hadronic events per bunch crossing, which is expected to be significant at the high energy collider like CLIC. However, in this case it is necessary to add the effect of the beamstrahlung photons as well. We do this for CLIC, by taking the spectra of beamstrahulng photons as provided in Ref. [35]. For the design parameters considered, the two-photon luminosities per bunch crossing, corresponding to both or one photon being a bremsstrahlung one are and respectively, where as the one coming from beamstrahlung photons alone is . The expected number of hadronic events expected per bunch crossing, with these effective two photon luminosities per bunch crossing, are shown in Table 6. It shows the number of events expected for three different values of the lower limit on instead of the fixed value of 50 GeV2 considered above.
| GeV2 | Aspen | EMM(BN) | BKKS | EMM |
|---|---|---|---|---|
| 5 | 4. | 5.5 | 5.7 | 6.3 |
| 25 | 3.4 | 4.7 | 5.0 | 5.5 |
| 50 | 3.2 | 4.5 | 4.7 | 5.3 |
The number obtained by us for the Aspen model is consistent with that in Ref.[36] with SAS parametrisation of the . Thus we see that depending on which theoretical model gives the right high energy description, we expect between 4-7 hadronic events per bunch crossing at CLIC. The beamstrahlung photons completely dominate the luminosity. Inclusion of the beamstrahlung contribution increases the expected number of events by about a factor 10 than expected just for the bremsstrahlung photons. However, about half of these events come from the contribution to the luminosity coming from the cross-term between the bremsstrahlung and the beamstrahlung photons.
7 Conclusions
Future linear colliders will be instrumental in the study of high energy photon collisions. We have shown that it will be possible at these colliders, to extract new important information on the energy dependence of the total hadronic cross-section in two photon collisions, . The best option for this purpose would be the photon collider mode, allowing for precise measurements at several energies. Accuracies of the order of 5-10% can be achieved, in a region where model predictions vary by a factor 2 or more. Even in the mode, there is sufficient sensitivity left in the total inclusive reaction (which does not require reconstruction of ), to distinguish between model classes though perhaps not between models in a given class. Further, it should be added that, for centre of mass energies of the collider up to a – GeV, the size of this inclusive cross-section is determined more by the normalisation of for in – GeV region than by the steepness of its energy dependence. Thus clarification of the measurements by the LEP groups in this energy range can play a crucial role in the determination of the hadronic backgrounds per bunch crossing expected in the mode.
Acknowledgments
This work was supported in part by the EU through HPRN-CT2002-00311. RMG wishes to thank the CERN theory division for hospitality where part of this work was done and the Department of Science and Technology, India for partial support under project no. SP/S2/K-01/2000-II.
References
- [1] D.Cline, F.Halzen and J. Luthe, Phys. Rev. Lett. 31 (1973) 491.
- [2] M. Drees and R.M. Godbole, Phys. Rev. Lett. 67 (1991) 1189; P. Chen, T. Barklow and M.E. Peskin, Phys. Rev. D49 (1994) 3209, R.M. Godbole, hep-ph/9807379, Proceedings of the Workshop onQuantum Aspects of Beam Physics, Jan. 5 1998 - Jan. 9 1998, Monterey, U.S.A., 404-416, Ed. P. Chen, World Scientific, 1999.
- [3] CLIC, A linear collider based on CLIC technology, the CLIC study team, G. Guignard (Editor), CERN-2000-08.
- [4] For a review, see for example, M. Drees and R.M. Godbole, Journal of Phys. G21 (1995) 1559.
- [5] H. Aihara et al., TPC/ Coll., Phys. Rev. D41 (1990) 2667.
- [6] S.E. Baru et al., MD-1 Coll., Zeit. Phys. C53 (1992) 219.
- [7] L3 Collaboration, M. Acciarri, et al,, CERN-EP/2001-012, Phys. Lett. B519 (2001) 33, hep-ex/0102025.
- [8] OPAL Collaboration. G. Abbiendi et al., Eur. Phys. J. C14 (2000) 199.
-
[9]
H1 Collaboration, S. Aid , et al., Zeit. Phys.
C69, 27 (1995), hep-ex/9405006;
ZEUS collaboration, S. Chekanov et al., Nucl. Phys. B627 (2002) 3, hep-ex/0202034. - [10] R. M. Godbole, G. Pancheri, Eur. Phys. J. C19 (2001) 129, hep-ph/0010104.
- [11] G. Schuler and T. Sjöstrand, Zeit. Phys. C68 (1995) 607; Phys. Lett. B376 (1996) 193; Zeit Phys. C73 (1997) 677.
- [12] M.M. Block, E.M. Gregores, F. Halzen and G. Pancheri, Phys.Rev. D58 (1998) 17503; M. Block, E.M. Gregores, F. Halzen and G. Pancheri, Phys.Rev. D60 (1999) 54024.
- [13] C. Bourelly, J. Soffer and T.T. Wu, Mod.Phys.Lett. A15 (2000) 9.
- [14] E. Gotsman, E. Levin, U. Maor, E. Naftali, Eur.Phys.J. C14 (2000) 511, hep-ph/0001080.
- [15] B. Badelek, M. Krawczyk, J. Kwiecinski and A.M. Stasto, Phys.Rev. D62 (2000) 074021; e-Print Archive: hep-ph/0001161.
- [16] A. Corsetti, R.M. Godbole and G. Pancheri, Phys.Lett. B435 (1998) 441.
- [17] J.R. Cudell et al., hep-ph/0212101.
-
[18]
T. Sjöstrand, Comp. Phys. Comm., 82 (1994) 74;
T. Sjöstrand, Lund University report, LU-TP-95-20 (1995). -
[19]
R. Engel and J. Ranft, Phys. Rev. D54 (1996) 4244;
R. Engel, Zeit. Phys. C66 (1995) 203. - [20] D.E. Groom et al, PDG 2000, Eur. Phys. Jour. C15, (2000), 1.
- [21] A. Donnachie and P. Landshoff, Phys. Lett. B437 (1998) 408.
- [22] M. Block and K. Kang, hep-ph/0302146.
- [23] C.F. v. Weizsäcker, Z. Phys. 88,(1934) 612; E.J. Williams, Phys. Rev. 45 (1934) 729.
-
[24]
I.F. Ginzburg et al., Nucl. Inst. Meth. A205 (1983)
47, A219 (1984) 5;
V.I. Telnov, Nucl. Inst. Meth. A94 (1990) 72, hep-ex/9908005.
R. Brinkmann et al., Nucl. Instrum. Meth. A406 (1998) 13. - [25] TESLA, R. Brinkman et al., DESY-01-011 and ECFA-2001-209.
- [26] V. Telnov, hep-ex/0101002.
- [27] H. Burkhardt, V. Telnov, CERN-SL-2002-013-AP, CLIC-NOTE-508, May 2002
- [28] M. Pohl and J. Schreiber, DESY99-030 (1999).
- [29] A. De Roeck, R. Engel and A. Rostovtsev, hep-ph/9710366.
- [30] R. Godbole, A. Grau and G. Pancheri, QCD and Multiparticle Production, page 424. Proceedings of the XXIX International Symposium on Multiparticle Dynamics, Brown U., Aug. 2000. Eds. I. Sarcevic and C-I Tang. World Scientific 2000. e-print Archive: hep-ph/9912395.
- [31] A. Donnachie and P.V. Landshoff, Phys. Lett. B296 (1992) 227.
- [32] See for example, S. Frixione, M.L. Mangano, P. Nason and G. Ridolfi, Phys. Lett. B319 (1993) 339.
- [33] M. Drees and R.M. Godbole, Phys. Rev. D50 (1994) 3124.
- [34] M. Drees and R.M. Godbole, Zeit. Phys. C59 (1993) 591.
- [35] D Schulte, private communication and http://clicphysics.web.cern.ch/CLICphysics/
- [36] D. Schulte, DESY-TESLA-97-08, 1997