Inconsistencies in Interpreting the Atmospheric Neutrino Anomaly
Abstract
We note a discrepancy between the value of R expected on the basis of the muon neutrino angular distribution and the value actually observed. The energy independence of leads to a fine tuning problem. This may be indicative of some unaccounted for new physics
pacs:
14.60.Pq,14.60.St1. Introduction
Evidence for an atmospheric neutrino anomaly is of two types. The angular distribution of the SuperKamiokande data shows an upward/downward deficiency.
| Experiment | Measured R value |
|---|---|
| IMB-1 | 0.680.11 |
| Kamiokande Sub-GeV | 0.600.05 |
| Kamiokande Multi-GeV | 0.570.07 |
| IMB-3 | 0.540.050.12 |
| Frejus | 1.000.150.08 |
| Nusex | 0.990.29 |
| Soudan(99) | 0.640.110.06 |
| Super Kamiokande Sub-GeV | 0.6380.0160.050 |
| Super Kamiokande Multi-GeV | 0.6580.078 |
In addition numbers of prior experiments (table 1) noted an apparent deficiency of muon neutrinos. This deficiency seems to be too large to be explained (solely) by the angular anomaly.
2.
The quantity was introduced to minimize systematic errors associated with neutrino flux estimates. It is insensitive to the flux normalization, insensitive to detection efficiencies, insensitive to scattering angle errors between the and the charged lepton (unless binned by direction), insensitive to muon-electron differences that are modeled in the Monte Carlo. Table 1 lists and compares several measurements of .
3. The Angular Distribution
The flight length of the depends on its direction.
with representing the distance from the
center of the earth to the upper atmosphere where the neutrinos are born and
representing the distance from the center of the earth to the detector
().
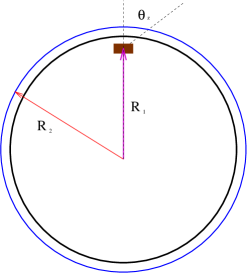
Those from above travel about 15 km. Those from below travel about 10,000 km. The propagation distance is a continuous distribution, but it is predominantly bimodal. Such a bimodal distribution facilitates a comparison of flux traveling over 2 distance scales. Such a comparison is insensitive to the flux normalization. Near the zenith, it is insensitive to first order in the scattering angle between the reconstructed muon and the neutrino.
4. The Problem
The observed muon deficiency is too large to be explained by just muon neutrino oscillations, even at maximal mixing. Even if all events in the upward hemisphere were fully mixed the smallest could be is about 0.75. This is a fine tuning problem. While it is possible that at maximum mixing, for some value of the energy the integral effect of neutrino oscillations over the set of distances illustrated in figure 3 could produce an of about 0.63. A small change in the oscillation length at energies above or below this tunned value would cause to jump from 0.75 when only the lower hemisphere oscillates, at higher energies and to 0.5 when oscillations occur over all solid angle at lower energies. But as seen in figure 1 is essentially energy independent [?] with no clear break over a factor of about 50 in energy. A more natural explanation [?] would be a large enough such that oscillations occur over all solid angle for all energies and . But this would not lead to any directional modulation. The atmospheric neutrino anomaly may be due to new physics perhaps including neutrino oscillations. Numerous (2+14) ad hoc parameters, in addition to neutrino oscillations, have been used to fit the data in figure 2. If one attempts to understand the data utilizing only neutrino oscillations and no adjustments the difference between the expected and observed values of With the measured up/down rate the difference is about 4-5 sigma. Assuming maximal mixing, the difference is about 3 sigma (R=0.75 expected 0.610.05 observed)
REFERENCES
- [1] Y. Fukuda et al. Phys. Rev. Lett. 81 1562 (1998).
- [2] Y. Fukuda et al. Phys. Lett. B433 9 (1998).
- [3] J. LoSecco hep-ph/9807432
- [4] M. Shiozawa, Talk presented at the Neutrino 2002 Meeting, Munich, May 2002.
- [5] T. Kajita, correspondence.