CERN-TH/2003-096
BUTP-2003/09
April 2003
An Analysis of the Inclusive Decay and
Constraints on the -Meson Distribution Amplitudes
A. Ali111On leave of absence from Deutsches
Elektronen-Synchrotron DESY, Hamburg, FRG.
Theory Division, CERN, CH-1211 Geneva 23, Switzerland
and
A.Ya. Parkhomenko222On leave of absence from
Department of Theoretical Physics,
Yaroslavl State University,
Sovietskaya 14, 150000 Yaroslavl, Russia.
Institut fr Theoretische Physik,
Universitt Bern,
CH-3012 Bern, Switzerland
Abstract
We calculate the -meson energy spectrum in the decay in the leading-order perturbative QCD in the static quark limit for the Orthoquarkonium. Our principal result is the extraction of parameters of the effective vertex function (EVF) involving a virtual and a real gluon from the available data on the hard part of the -meson energy spectrum. The perturbative QCD based framework provides a good description of the available CLEO data, allowing to constrain the lowest Gegenbauer coefficients and of the quark-antiquark and gluonic distribution amplitudes of the -meson. The resulting constraints are combined with the existing ones on these coefficients from an analysis of the and transition form factors and the requirement of positivity of the EVF, yielding and for GeV2. This reduces significantly the current uncertainty on these coefficients. The resulting EFV , including the -meson mass effects, is presented.
1 Introduction
Experiments involving the production and decays of the - and -mesons are consistent with the picture that the -meson is largely an flavour-octet state, but the -meson contains a significant amount of a flavour-singlet quark-antiquark () component in its wave-function [1, 2, 3, 4, 5]; in addition, the gluonic () content of the -meson is substantial [6]. This implies that for processes involving gluons and the -meson, in particular in the decays of heavy mesons of current phenomenological interest, such as inducing the decay [7, 8, 9, 10, 11, 12, 13] and the exclusive decays [14, 15, 16, 17, 18, 19, 20, 21], but also the inclusive decay of the Orthoquarkonium [22], the effective -gluon-gluon vertex plays an important role. This effective vertex function (EFV) has to be known sufficiently well to undertake a quantitative analysis of the data involving the -meson. Calling this EFV , where and are the virtualities of the two gluons, the QCD anomaly provides the normalization of this vertex for on-shell gluons, . When one or both of the gluons are virtual with relatively large virtuality, the effective vertex can be calculated in perturbative QCD [23, 24, 25, 26].
In this approach, the -meson wave-function is described in terms of two light-cone distribution amplitudes (LCDAs) involving the quark-antiquark and the gluonic components, where is the scaled energy of one of the partons of the -meson and is the typical hard scale in the vertex. These two components mix if the QCD evolution is taken into account. The leading-twist LCDAs of the -meson can be expressed as infinite series of the Gegenbauer polynomials (for the quark-antiquark) and (for the gluonic) components [27, 28, 29, 30, 31, 32]
| (1) |
| (2) |
where , and the following notation is used for the Gegenbauer moments:
| (3) | |||||
| (4) |
The constrained parameters , , and are computable and can be found, for example, in the Appendix A of Ref. [24]. Usually, one employs an approximate form for the -meson LCDAs in which only the first non-asymptotic terms in both the quark-antiquark and gluonic components are kept. Thus, in this approximation
| (5) |
where the explicit forms for and have been used. The free parameters and , which enter in and , are not determined from first principles, and have to be modeled or extracted from a phenomenological analysis of data. To that end, a fit of the CLEO and L3 data on the and transition form factors for larger than 2 GeV2 [33, 34] was recently undertaken in Ref. [25], yielding
| (6) |
where the initial scale of the evolution is taken as GeV2. Note, that the coefficients and are strongly correlated. The estimates (6) can be translated in terms of the universal free parameters and , yielding:
| (7) |
The current determination of these coefficients, in particular , is rather poor, leading to a huge uncertainty in the evaluation of the vertex function .
In this paper, we undertake a perturbative-QCD based analysis of the recent data on the inclusive process in the large -meson energy region published recently by the CLEO collaboration [35], which is expected to be dominated by the process . Moreover, Chen and Kagan [22] have argued that the shape of the -meson energy spectrum in this decay is sensitive to the shape of the vertex function, involving the -meson, a real and a virtual gluons (see Fig. 1). This sensitivity has already been used by the CLEO collaboration [35] to rule out certain models for this vertex, with the CLEO analysis favouring a rapidly falling -dependence of the vertex , in line with the perturbative QCD predictions [23, 24]. Motivated by these observations, we undertake a quantitative analysis of the CLEO data to constrain the LCDAs involving the quark-antiquark and the gluonic components of the -meson. The results of this analysis are presented in terms of the coefficients and , where we have taken the initial scale as , which corresponds to the minimum gluon virtuality . This analysis is then combined with an earlier analysis of the and transition form factors [25] to further constrain the two parameters. As the physical interpretation of the function is that it represents a probability distribution, much the same way as the partonic distributions are in, for example, deep inelastic lepton scattering off nucleons, this function must remain positive definite in the entire range. The requirement of positive definiteness of the function provides additional constraints on the parameters and , in particular on the latter. The combined analysis leads to the following correlated ranges for these coefficients:
| (8) |
Finally, we use this information to calculate the vertex, including the -meson mass effects, relegating the detailed derivation to a subsequent paper [39].
This paper is organized as follows: In section 2, we calculate the branching ratio for the process and the -meson energy spectrum in this decay. Numerical analysis of the CLEO data is carried out in section 3, and the resulting constraints are combined with the analysis of the transition form factor to determine the LCDAs of the -meson. Section 4 contains a brief summary. The expressions for the matrix element squared for the decay are displayed in the Appendix.
2 Branching Ratio and -Distribution in the Decay
Several processes contribute to the inclusive -meson production in the -meson decay. The two dominant decays are: and . The first of these has been estimated from the measured value of the hadronic cross-section and the branching ratio , yielding [35], and the CLEO data has been corrected for the component. In addition, there is also the continuum production from the process , which can be estimated from the -continuum data below the resonance. This data also provides a good profile of the fragmentation in the process . Typically, the fragmentation processes involving the intermediate state populate the low- region, where is the relative -meson energy expressed in terms of the -meson mass . One expects that in the large- region, the process dominates. Assuming this, we will concentrate here on the intermediate three-gluon state and analyze the -spectrum in the large- region alone. The quality of the fits provides a justification of this procedure a posteriori.
A typical Feynman diagram describing the decay is presented in Fig. 1.

The other 17 diagrams can be obtained from the above one by the permutations of the gluons in the intermediate (virtual) and final state. For the matrix element calculations, we adopted the static limit for the heavy quark-antiquark pair in the orthoquarkonium , so that both the quark () and antiquark ( carry half of the -meson four-momentum, and the velocity-dependent corrections are neglected.
The total decay amplitude can be divided into three parts:
| (9) |
where each of the three terms collects the contributions from the diagrams with the virtual gluon of the same four-momentum , with and being the four-momenta of the -meson and the th final gluon. The explicit forms of the three contributions are as follows:
where ( are the colours of the gluons) is the symmetrical constant of the colour group with ; is the strong coupling constant; is the polarization tensor of the -meson, , , and are the mass of the quarkonium, the four-momentum, the polarization vector, and the non-relativistic wave-function in the position space evaluated at the origin, respectively; and () are the gluonic field-strength tensor and its dual involving the th gluon with the polarization vector and four-momenta ; is the four-momentum of the virtual gluon, and . In the above equations the notations are as follows: , , etc. It is worth noting that the matrix element satisfies the Bose symmetry under the exchange of gluons, in particular, under the interchange of the first and second gluons while the term remains unchanged.
The function is the effective vertex function involving the -meson and two gluons, one of which is on the mass shell (). We shall call this interchangeably also the transition form factor. A form of this function motivated by the QCD analysis of the loop diagram was suggested by Kagan and Petrov [9]:
| (13) |
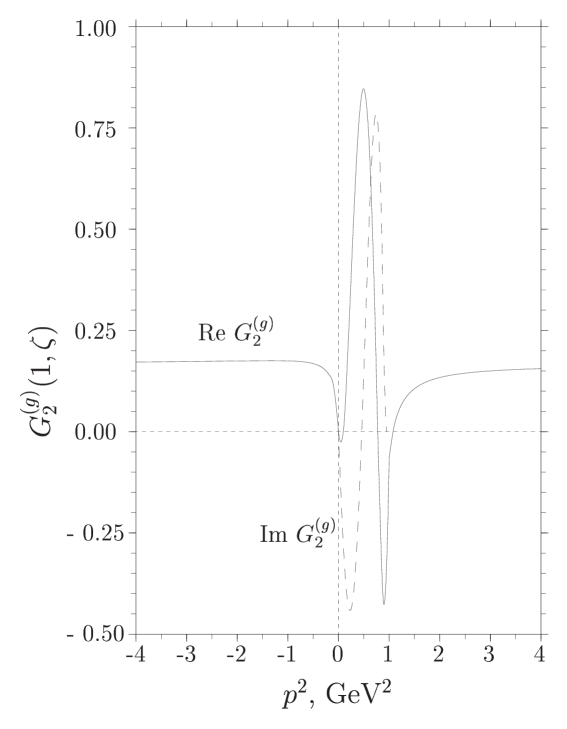
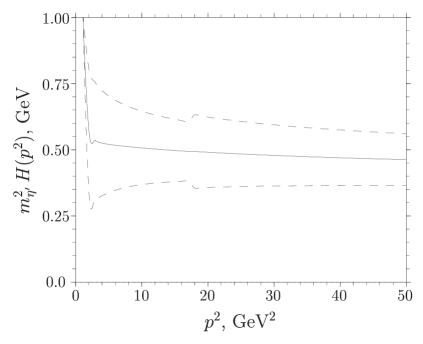
where the function was approximated by the constant value , extracted from the decay [7]. In a companion paper [39] we argue that the form (13) for the transition form factor also emerges in the perturbative calculations of this function in the hard-scattering approach by keeping the -meson mass. In this approach, the dependence of the function on the gluon virtuality is given by the following expression:
| (14) |
where is the -meson decay constant expressed in terms of the -meson decay constant MeV, , and the function has the form [39]:
| (15) |
In Eq. (14) the scale in the strong coupling , and also in the second Gegenbauer moments and of the quark-antiquark and gluonic LCDAs of the -meson, is related with the gluon virtuality , but there is an uncertainty in its precise definition. One of the possibilities is to require that the function is finite at all values of including the singularity point of the EVF (13), , which can be done, for example, by putting .
The dependence of the function on the momentum squared of the virtual gluon is presented in Fig. 2 with the value in the large- asymptotic region. Since this result is based on the application of perturbation theory, its validity is restricted to the region , where typically (or somewhat higher). In view of this, we shall set and ignore the structure in in the low- region seen in Fig. 2.
As already noted, the functions and in Eq. (14) are the second Gegenbauer moments of the quark-antiquark and gluonic light-cone distribution amplitudes (LCDAs) of the -meson. The scale appearing in the definitions of these moments is set by the initial value in the evolution of the Gegenbauer moments. As the mass of the -meson is large, GeV, it is not a good approximation to neglect it. Assuming further, that the evolution of the Gegenbauer moments is valid for the gluons with virtualities larger than 1 GeV2, we shall take GeV2.
The total decay width of the -meson into the -meson and three gluons, , averaged over the quarkonium spin states and summed over the polarizations and colours of the final gluons can be written in the form:
where the factor takes into account the identity of the final gluons. The expression for the matrix element squared is rather lengthy and can be found in the Appendix, where we have also discussed some technical details of our Monte Carlo integration.
The -meson energy distribution function can be defined as follows:
where is the three-gluon decay width of the -meson in the leading order:
| (18) |
Here, and are the constants of the colour group, and is the strong coupling estimated at the scale of the -meson mass. The corrections to the decay width are known since a long time and are numerically large [36]. However, we do not take them into account, as we have calculated the decay only in the leading order. One anticipates that in the distribution , a good part of the explicit corrections should drop out, and we are tacitly assuming that the remaining corrections do not greatly influence the energy spectrum derived in the lowest non-trivial order.
3 Numerical Analysis of the Data and the -Meson LC Distribution Amplitudes
As the results for the matrix element squared in the decay are not yet available in the literature, we shall give their explicit expressions in this paper. In that context we note that it is sufficient to have the expressions for one of the diagonal terms () and one of the non-diagonal terms (), as the others can be obtained by using the Bose symmetry. With this, the expressions for the components , derived from Eq. , and c.c., resulting from the cross terms in Eq. and in , are given in the Appendix.
We start our numerical calculations by reproducing the already known results for the -meson energy spectrum [35, 22], as this provides a good consistency check of our calculations. For this purpose, the spectrum in Fig. 3 is calculated with the same set of phenomenological parameters as has been used in Ref. [22] for the following three input forms333 We thank Alex Kagan for providing us the input parameters used in their analysis of Fig. 3. It should be noted that in the rest of our paper we have used the input parameters displayed in Table 1.:
-
a)
A slowly falling EVF: where the two-loop expression is used for the strong coupling .
-
b)
A rapidly falling EVF of the form (13) with the function approximated by the constant value GeV-1.
-
c)
An intermediate EVF: with GeV.
The shapes of the -meson energy spectrum resulting from these EVFs are presented in Fig. 3.
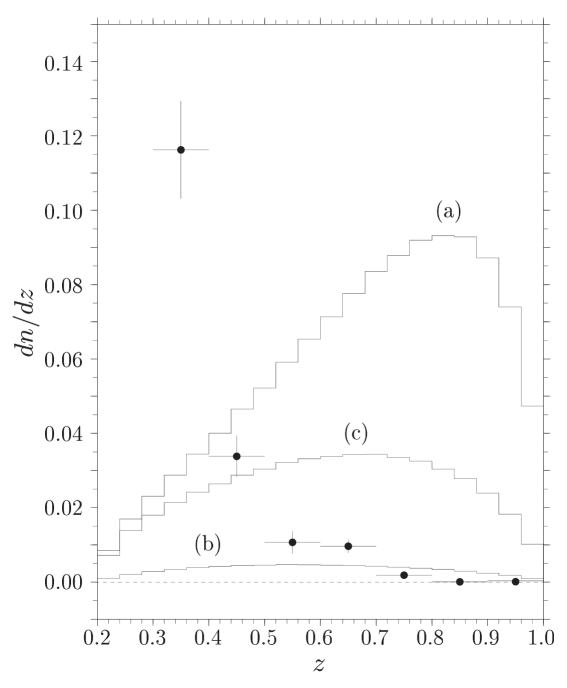
The experimental points in the decay shown in this figure are taken from Ref. [35]. Our results are in agreement with the ones in Ref. [22], and we confirm the previous observation that the curve (b) corresponding to the rapidly falling EVF is in reasonable agreement with the experimental data in the hard-energy region [35]. Note that the allowed kinematic domain of the variable is , where . The region is too small to be resolved experimentally, given the statistics of the CLEO data [35], and hence the energy distribution above is included in the last energy bin .
Let us now turn to the analysis of the perturbative-QCD based form of the effective vertex presented in Eqs. (13)–(15). To fit the parameters and from the existing experimental data on the decay, it is convenient to first derive an approximate numerical formula for the -meson energy spectrum. This expression will come in handy for subsequent comparison with other independent calculations and will also facilitate undertaking analysis of the data in future by the experimental groups themselves. As the amplitude of the process considered is linear in and , the energy spectrum is quadratic in these parameters. The general form for the energy spectrum in the decay can be written as follows (suppressing in this equation the scale-dependence of the coefficients for ease of writing):
We have generated the theoretical -spectrum, using a high statistics Monte Carlo phase space programme, with fixed values of the coefficients and , and have varied their values over a certain range to numerically determine the dependence of the spectrum on these coefficients. Other parameters in our numerical analysis are listed in Table 1, which are the same as the ones used in the analysis of the and transition form factors [25], for the sake of consistency, as we are going to make use of this analysis.
| 9.46 GeV | 1.3 GeV |
| 958 MeV | 4.3 GeV |
| 133 MeV | 305 MeV |
| 2 GeV2 |
We have not included any errors on , and , as the parametric uncertainties from the Gegenbauer coefficients are by far the largest, which we study.
| 1.9172(27) | 2.5187(36) | -0.3108(13) | 0.8744(19) | -0.1888(07) | 0.0146(06) | |
| 1.6750(25) | 2.2368(34) | -0.2583(12) | 0.7953(18) | -0.1560(07) | 0.0122(06) | |
| 1.2768(21) | 1.7344(29) | -0.1855(10) | 0.6343(15) | -0.1097(06) | 0.0089(05) | |
| 0.6475(17) | 0.8945(17) | -0.0866(07) | 0.3396(09) | -0.0484(05) | 0.0044(05) |
The coefficients [] for the four bins of the -meson energy spectrum are presented in Table 2. The numbers presented in the parentheses represent the statistical error of our Monte Carlo calculations, for which we have used the Monte Carlo phase space generator FOWL from the CERN Library of programmes. With the help of the program MINUIT [40], the following best fit values of the parameters and are obtained:
| (20) | |||||
for the last three experimental bins with (the stated corresponds to three degrees of freedom), and
| (21) | |||||
for the four experimental data points in the large- region (). The minimum of the fit in the last case, namely for four degrees of freedom, is unacceptably large. Thus, as already observed in Ref. [35], only the last three bins in the energy spectrum are dominated by the decay. Following this, we concentrate on the analysis of the last three bins with . The contours both in the Gegenbauer coefficients (, ) and in the Gegenbauer moments (, ) are presented as long-dashed curves in Fig. 4.
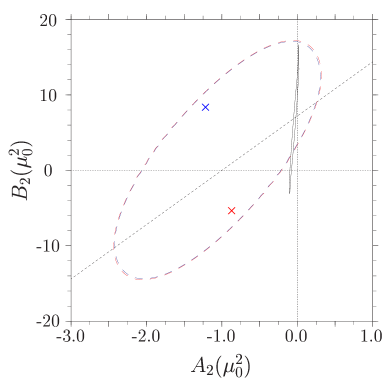
The best fit values (20) are denoted by the crosses (). The narrow contours (solid curves) also shown in these figures result from the analysis of the data on the transition form factor [25]. As we are using GeV2 in our analysis, the results from Ref. [25] have been rescaled from GeV2 to GeV2 with the help of Eqs. (3) and (4) for . We note that the analysis of the data, being more sensitive to the quark-antiquark LCDA of the -meson, provides a much more precise determination of the parameter and hence of the Gegenbauer moment , than what can be determined at present from the CLEO data on . However, what concerns the coefficient , and also the Gegenbauer moment , the CLEO data on , despite its statistical limitations, has cut out some of the allowed parameter region from the analysis. The additional constraint that follows from demanding that the vertex function remains positive definite for all values of is shown through the short-dashed lines in these figures, admitting only the parameter space below these lines. We will discuss this constraint in more detail below.
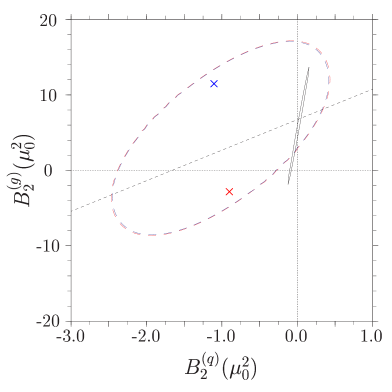
A blow up of the overlapping region in the parameter space () is shown in Fig. 5.
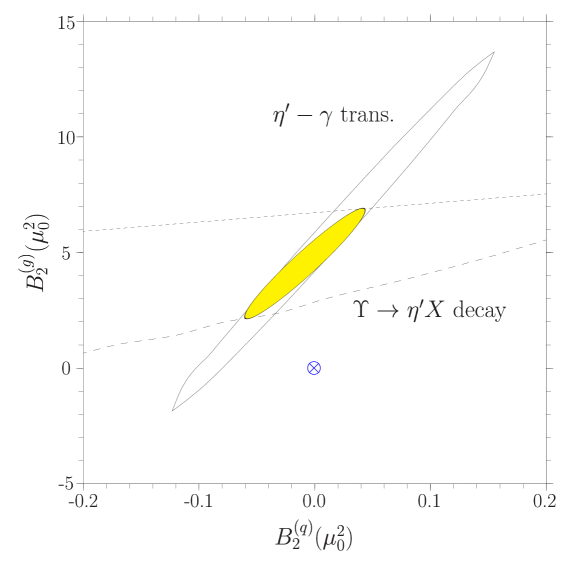
Here, the contours following from the transition form factor analysis and the decay fit are shown through the solid and dashed curves, respectively. In drawing the allowed parameter space from the decay fit, we have imposed the additional condition that the vertex function for has the same sign as the corresponding function calculated with the asymptotic forms of the -meson quark-antiquark and gluonic LCDAs which is defined as positive-definite in the entire region. With Eq. (13) taken into account, this condition implies and results [with the help of the explicit from (14) of the function ] in the following inequalities:
| (22) | |||||
where the function (15) is approximated by its value in the large- asymptotics. The values and were taken for the constrained parameters in the numerical analysis. The positivity constraint removes the larger values of above the short-dashed curve in Fig. 5, which would otherwise force the vertex function to cross the zero at some value of and become negative. This is exemplified below for specific values of the Gegenbauer coefficients. The resulting combined best fit of the parameters and is shown as the coloured (shaded) region. This yields the following correlated values:
| (23) | |||
with the central values having for three degrees of freedom. For comparison, the point shown as , corresponding to the asymptotic LCDA, has for three degrees of freedom. Thus, the asymptotic form of the -meson LCDA is not favoured by our analysis.
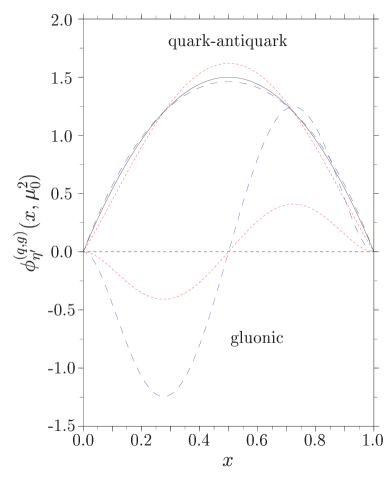
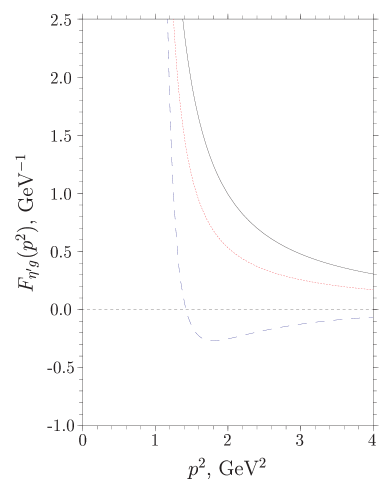
The shapes of the quark-antiquark and gluonic LCDAs are presented in Fig. 6 (left frame); the resulting transition form factor corresponding to these LCDAs is also shown in this figure (right frame). The solid and dotted curves in this figure correspond to the asymptotic LCDA and the combined best fit values of the Gegenbauer coefficients (23), respectively. We also show, for the sake of illustration, representative LCDAs with the Gegenbauer coefficients having the values and . These parametric values are taken from the analysis in Ref. [25], but are in conflict with the positive definiteness of the vertex function , as shown by the dashed curve for . In fact, the constraint of positivity on the effective vertex function cuts out regions in the parameter space and , as otherwise the contribution from the gluonic LCDA starts to dominate, which makes the vertex function negative for some range of considered here and in Ref. [25]. Thus, positivity criterion provides an effective constraint on the magnitude of the coefficient , reducing significantly the otherwise allowed range in Eq. (7). In the context of our analysis, we note that the asymptotic -meson LCDA provides a fair description (though not the best fit) of the current data on , and hence one anticipates that the subasymptotic corrections in the LCDAs, and the vertex function , while important in the analysis of data, are not dominant.444The approximate validity of the asymptotic transition form factors involving the -, - and -mesons compared to the data, observed in Refs. [37, 38], also suggests that the coefficient in the -meson is bounded by this data. The gluonic components of the - and the -meson LCDAs are small in any case.
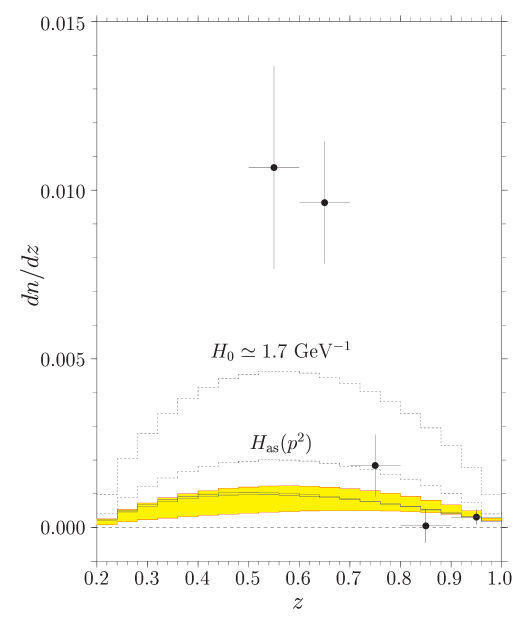
The -meson energy spectrum for the EVF motivated by the perturbative QCD analysis is presented in Fig. 8 in comparison with the experimental data [35] and the spectrum corresponding to the “rapidly falling” form of the EVF [22] labeled by the constant value of the function GeV-1. The second dotted line labeled by corresponds to the EVF when only the asymptotic form of the -meson LCDA ( and ) is taken into account. The yellow (shaded) region demarcates the spectrum with the Gegenbauer coefficients having values in the range of the combined best fit (23). The blue (solid) curve lying inside this region corresponds to the best fit values (20) obtained from the analysis of the decay only. From Fig. 8 it is seen that the rapidly falling phenomenological EVF with gives a harder -meson energy spectrum for the large energy region compared to the CLEO data. The spectrum with the asymptotic form of the -meson LCDA is well correlated with the experimental point in the bin , but overestimates the data in the other two bins. It should be noted that the last two bins (especially the bin ) are very uncertain in the current data, which has to be statistically improved to draw sharper conclusions.
4 Summary
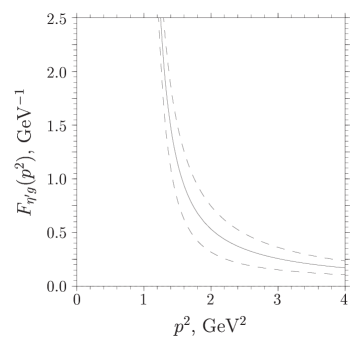
We have calculated the -meson energy spectrum in the decay in leading order perturbative QCD in the static quark limit for the Orthoquarkonium. Assuming some phenomenological vertex functions, our results are in agreement with the ones obtained earlier in Ref. [22]. In our analysis, the -meson is described in the leading-twist (twist-two) accuracy in terms of the quark-antiquark and gluonic LCDAs for which the asymptotic and the first non-asymptotic terms are taken into account. In this approximation, the EVF depends essentially on the Gegenbauer coefficients and . They are determined from the CLEO data on in the large- region () of the -meson energy spectrum [35], which is well explained by our perturbative QCD approach. However, the resulting contour in the Gegenbauer coefficients have a large dispersion. Combining the analysis of the data with an earlier analysis of the transition from factors in a similar theoretical framework [25], and requiring additionally that the vertex function remains positive definite in the entire region, yield much improved determination of the Gegenbauer coefficients, yielding and . Our analysis improves the phenomenological profile of the LCDAs in the -meson, and in turn yields a better determination of the vertex function compared to the earlier estimates of the same. The resulting function (the – gluon transition form factor) is presented in this paper including the -meson mass effects.
5 Acknowledgments
We would like to thank Alex Kagan, Christoph Greub, Peter Minkowski and Sheldon Stone for numerous helpful discussions. We also thank Gustav Kramer for his comments on the earlier version of this manuscript. The work of A.Ya.P. has been supported by the Schweizerischer Nationalfonds.
Appendix A Matrix Element Squared for the Decay
In Sec. 2, we have displayed explicitly the terms () in the decomposition of the total amplitude of the decay in the leading-order perturbative QCD [Eqs. (2)–(2)]. Squaring this amplitude results in very lengthy expressions. Nevertheless, it is possible to present compact analytical expressions for some parts of the matrix element squared. In particular, the square of the term , summed over the polarizations and colours of the final gluons and averaged over the polarization states of the -meson, can be written as follows:
| (24) |
where the well-known property of the symmetrical constants of the colour -group has been used:
| (25) |
and the dynamical function has the form:
It is easy to check that this function is invariant under the interchange , which reflects the Bose symmetry for the set of the Feynman diagrams considered. The other two dynamical functions and originating from the squares of the terms and , respectively, can be obtained from by the obvious replacements: and .
The differential width of the decay has a non-trivial dependence on five variables (three angles can be integrated out trivially) in the rest frame of the decaying particle. In the Monte Carlo generator, the matrix element squared is rewritten in terms of the following dimensionless variables:
| (27) |
which satisfy the relation:
| (28) |
where is the relative mass of the -meson.
The experimentally measured quantity is the -meson energy spectrum – the number of events inside the energy bin with the central value and the width . This can be calculated theoretically in the Monte Carlo approach, which we have used. In particular, as an input for the calculation of the contribution coming from , the following equation was used:
| (29) | |||||
where the representation (24) for was put into the definition of (2). The dimensionless functions is related to the functions as follows:
| (30) |
The first integral in Eq. (29) serves for a selection of the generated Monte Carlo events with the -meson energy being inside the bin .
In the same way all the other contributions from the matrix element squared were implemented in the numerical analysis. In particular, the contribution to the energy spectrum coming from the product c.c. can be written as:
| (31) | |||||
However, we have not been able to find compact expressions for the non-diagonal terms (). We present here instead the dimensionless function in a form of a series in powers of :
| (32) |
where functions are as follows:
| (38) |
where , , and . It is easy to see that the equations for are symmetric under the interchange .
The expressions for the other can be derived from the ones given above by using the Bose symmetry.
References
- [1] F. J. Gilman and R. Kauffman, Phys. Rev. D 36, 2761 (1987) [Erratum-ibid. D 37, 3348 (1988)].
- [2] H. Leutwyler, Nucl. Phys. Proc. Suppl. 64, 223 (1998) [arXiv:hep-ph/9709408].
- [3] R. Kaiser and H. Leutwyler, Eur. Phys. J. C 17, 623 (2000) [arXiv:hep-ph/0007101].
- [4] T. Feldmann, P. Kroll and B. Stech, Phys. Rev. D 58, 114006 (1998) [arXiv:hep-ph/9802409].
- [5] T. Feldmann, P. Kroll and B. Stech, Phys. Lett. B 449, 339 (1999) [arXiv:hep-ph/9812269].
- [6] P. Ball, J. M. Frere and M. Tytgat, Phys. Lett. B 365, 367 (1996) [arXiv:hep-ph/9508359].
- [7] D. Atwood and A. Soni, Phys. Lett. B 405, 150 (1997) [arXiv:hep-ph/9704357].
- [8] W. S. Hou and B. Tseng, Phys. Rev. Lett. 80, 434 (1998) [arXiv:hep-ph/9705304].
- [9] A. L. Kagan and A. A. Petrov, arXiv:hep-ph/9707354.
- [10] I. E. Halperin and A. Zhitnitsky, Phys. Rev. Lett. 80, 438 (1998) [arXiv:hep-ph/9705251].
- [11] F. Yuan and K. T. Chao, Phys. Rev. D 56, 2495 (1997) [arXiv:hep-ph/9706294].
- [12] A. Datta, X. G. He and S. Pakvasa, Phys. Lett. B 419, 369 (1998) [arXiv:hep-ph/9707259].
- [13] M. R. Ahmady, E. Kou and A. Sugamoto, Phys. Rev. D 58, 014015 (1998) [arXiv:hep-ph/9710509].
- [14] I. E. Halperin and A. Zhitnitsky, Phys. Rev. D 56, 7247 (1997) [arXiv:hep-ph/9704412].
- [15] H. Y. Cheng and B. Tseng, Phys. Lett. B 415, 263 (1997) [arXiv:hep-ph/9707316].
- [16] A. S. Dighe, M. Gronau and J. L. Rosner, Phys. Rev. Lett. 79, 4333 (1997) [arXiv:hep-ph/9707521].
- [17] N. G. Deshpande, B. Dutta and S. Oh, Phys. Rev. D 57, 5723 (1998) [arXiv:hep-ph/9710354].
- [18] D. s. Du, C. S. Kim and Y. d. Yang, Phys. Lett. B 426, 133 (1998) [arXiv:hep-ph/9711428].
- [19] A. Ali, J. Chay, C. Greub and P. Ko, Phys. Lett. B 424, 161 (1998) [arXiv:hep-ph/9712372].
- [20] A. Ali, G. Kramer and C. D. Lu, Phys. Rev. D 58, 094009 (1998) [arXiv:hep-ph/9804363].
- [21] M. Beneke and M. Neubert, Nucl. Phys. B 651, 225 (2003) [arXiv:hep-ph/0210085].
- [22] A. L. Kagan, AIP Conf. Proc. 618, 310 (2002) [arXiv:hep-ph/0201313]; Y. Chen and A.L. Kagan, Univ. of Cincinnati preprint (in preparation).
- [23] T. Muta and M. Z. Yang, Phys. Rev. D 61, 054007 (2000) [arXiv:hep-ph/9909484].
- [24] A. Ali and A. Y. Parkhomenko, Phys. Rev. D 65, 074020 (2002) [arXiv:hep-ph/0012212].
- [25] P. Kroll and K. Passek-Kumericki, Phys. Rev. D 67, 054017 (2003) [arXiv:hep-ph/0210045].
- [26] S. S. Agaev and N. G. Stefanis, arXiv:hep-ph/0212318.
- [27] M. V. Terentev, Sov. J. Nucl. Phys. 33, 911 (1981) [Yad. Fiz. 33, 1692 (1981)].
- [28] T. Ohrndorf, Nucl. Phys. B 186, 153 (1981).
- [29] M.A. Shifman and M.I. Vysotsky, Nucl. Phys. B 186, 475 (1981).
- [30] V.N. Baier and A.G. Grozin, Nucl. Phys. B 192, 476 (1981).
- [31] M. V. Terentev, JETP Lett. 33, 67 (1981) [Pisma Zh. Eksp. Teor. Fiz. 33, 71 (1981)].
- [32] A. V. Belitsky and D. Muller, Nucl. Phys. B 537, 397 (1999) [arXiv:hep-ph/9804379].
- [33] J. Gronberg et al. [CLEO Collaboration], Phys. Rev. D 57, 33 (1998) [arXiv:hep-ex/9707031].
- [34] M. Acciarri et al. [L3 Collaboration], Phys. Lett. B 418, 399 (1998).
- [35] M. Artuso et al. [CLEO Collaboration], Phys. Rev. D 67, 052003 (2003) [arXiv:hep-ex/0211029].
- [36] P. B. Mackenzie and G. P. Lepage, Phys. Rev. Lett. 47, 1244 (1981).
- [37] T. Feldmann, Int. J. Mod. Phys. A 15, 159 (2000) [arXiv:hep-ph/9907491].
- [38] T. Feldmann and P. Kroll, Phys. Scripta T99, 13 (2002) [arXiv:hep-ph/0201044].
- [39] A. Ali and A. Y. Parkhomenko, “The Vertex Including the -Meson Mass”, CERN-TH/2003-063 (to be published).
- [40] F. James and M. Roos, Comput. Phys. Commun. 10 (1975) 343.