February 28, 2003 LBNL-52452
The Direct Limit on the Higgs Mass and the SM Fit 111This work is supported in part by the Director, Office of Science, Office of High Energy and Nuclear Physics, Division of High Energy Physics, of the U.S. Department of Energy under Contract DE-AC03-76SF00098
Presented at the Workshop on Electroweak Precision Data and the
Higgs Mass
DESY-Zeuthen, February 28 - March 1, 2003
To be published in the proceedings
Michael S. Chanowitz222Email: chanowitz@lbl.gov
Theoretical Physics Group
Ernest Orlando Lawrence Berkeley National Laboratory
University of California
Berkeley, California 94720
Because of two anomalies, the Standard Model (SM) fit of the precision electroweak data has a poor confidence level, . Since both anomalies involve challenging systematic issues, it might appear that the SM could still be valid if the anomalies resulted from underestimated systematic error. Indeed the of the global fit could then increase to 0.71, but that fit predicts a small Higgs boson mass, GeV, that is inconsistent at 95% CL with the lower limit, GeV, established by direct searches. The data then favor new physics if the anomalous measurements are both excluded or both retained, and the Higgs boson mass cannot be predicted until the new physics is understood. The validity of the SM could however be maintained by a propitious combination of statistical fluctuation and systematic error. The current data do not allow a definitive conclusion.
Disclaimer
This document was prepared as an account of work sponsored by the United States Government. While this document is believed to contain correct information, neither the United States Government nor any agency thereof, nor The Regents of the University of California, nor any of their employees, makes any warranty, express or implied, or assumes any legal liability or responsibility for the accuracy, completeness, or usefulness of any information, apparatus, product, or process disclosed, or represents that its use would not infringe privately owned rights. Reference herein to any specific commercial products process, or service by its trade name, trademark, manufacturer, or otherwise, does not necessarily constitute or imply its endorsement, recommendation, or favoring by the United States Government or any agency thereof, or The Regents of the University of California. The views and opinions of authors expressed herein do not necessarily state or reflect those of the United States Government or any agency thereof, or The Regents of the University of California.
Lawrence Berkeley National Laboratory is an equal opportunity employer.
The Direct Limit on the Higgs Mass and the SM Fit
Michael S. Chanowitz
Lawrence Berkeley National Laboratory
University of California
Berkeley, California 94720
Abstract
Because of two anomalies, the Standard Model (SM) fit of the precision electroweak data has a poor confidence level, . Since both anomalies involve challenging systematic issues, it might appear that the SM could still be valid if the anomalies resulted from underestimated systematic error. Indeed the of the global fit could then increase to 0.71, but that fit predicts a small Higgs boson mass, GeV, that is inconsistent at 95% CL with the lower limit, GeV, established by direct searches. The data then favor new physics if the anomalous measurements are both excluded or both retained, and the Higgs boson mass cannot be predicted until the new physics is understood. The validity of the SM could however be maintained by a propitious combination of statistical fluctuation and systematic error. The current data do not allow a definitive conclusion.
1 Introduction
A decade of beautiful experiments at CERN, Fermilab, and SLAC have provided increasingly precise tests of the Standard Model (SM). The data confirms the SM at the level of quantum effects and probes the Higgs boson mass. The global fit333We fit only the observables considered by the EWWG prior to 2002, including neither APV nor . Theoretical systematics are not clearly controlled for the former while the latter as a 3% measurement is insensitive to SM-level radiative corrections. Including them the fit would yield . has a poor confidence level , due to two anomalies. One of these, from NUTEV[1], is recent. The other, the discrepancy between the effective leptonic mixing angle, , determined from three leptonic asymmetry measurements() versus its determination from three hadronic () measurements, is dominated by the discrepancy between the two most precise, [2] and ,[3] which has been a persistent feature of the data since the earliest days of LEP and SLC.
In this talk I focus on how the direct lower limit from LEP II, GeV,444 N.B., the 95% lower limit from the direct searches does not imply a 5% chance that but rather means that if the mass were actually 114.4 GeV it could have escaped detection with 5% likelihood. The likelihood for GeV is . See for instance section 5 of [4]. constrains the interpretation of these anomalies, and especially the asymmetry anomaly.[5] The central observation is that the only measurements which support in the allowed region are precisely the ones with big pulls that drive the fit to a poor CL. Without the discrepant measurements the prediction for is too low. In particular, the agreement of the SM with the data would not be improved if both anomalies were attributed to systematic error, since the resulting fit (with and removed) predicts GeV, with only a 5% likelihood that GeV.
The mass measurement plays a central role, discussed in more detail in [5]. In the SM fit, it favors the lower range of the leptonic asymmetries, , over the larger hadronic result, . Using the two loop result of [6] the new experimental result, GeV,[7, 8] implies and a very light value for . Essentially it is which decides whether or will have the largest pull.
The interpretation of the data is not clear. All three generic possibilities are in play: new physics, statistical fluctuation, and underestimated systematic error. It is certainly possible that either anomaly is genuine evidence of new physics,[9] in which case the SM fit would be invalidated and we could not use the precision data to constrain the Higgs boson mass until the new physics were understood. Statistical fluctation is also a possible explanation, which is fairly represented by the global CL’s. The new 23 MeV downward shift in increases the global CL by a factor two, from 0.01 to 0.02, which still cannot be said to be “favored”.
Concerning the possibility of underestimated systematic error, the three leptonic asymmetry measurements, , are theoretically clean and use three quite different experimental techniques, so that a large common systematic error is very unlikely. In contrast, both and depend on subtle systematic issues, involving experimental technique and, especially, nontrivial applications of QCD. The three hadronic asymmetry measurements have important shared systematics, both theoretical and experimental. If the systematic uncertainties of the and anomalies were much larger than current estimates, the of the global fit could increase to as much as 0.71. The SM might then appear to provide a good description of the data, however we would then encounter the conflict with the LEP II lower limit on . This conflict would also signify new physics,[10] to raise the prediction for into the allowed region above 114 GeV. Again could not be predicted until the new physics is known. With oblique corrections it is possible to “dial in” essentially any value of .[5]
It should be clear that the focus here on the possibility of underestimated systematic error is not based on the belief that it is the most likely explanation. In both cases the experimental groups have put great effort into understanding and estimating the systematic uncertainties, and the quoted systematic errors are too small to explain the anomalies.[1, 3] In fact, the situation is truly puzzling, and there is no decisive reason to prefer systematic error over new physics as the explanation of either anomaly. Rather we consider the systematic error hypothesis simply in order to understand what it implies and find that it also points to new physics.
Though it is an a posteriori observation, the grouping of the six asymmetry measurements into hadronic and leptonic clusters is a striking feature of the data. The leptonic asymmetries are the three lowest, combining to with , . The hadronic asymmetries are the three highest, tightly clustered around , with , . Combining all six measurements we have with and . It is unclear whether the grouping into leptonic and hadronic clusters is by chance or whether it is telling us something, either about new physics or about systematic effects. Since they are linked by common systematics, we consider the the three hadronic asymmetry measurements together when considering the systematic uncertainty hypothesis.
2 SM Fits
The SM radiative corrections are computed with ZFITTER v6.30,[11] but with the two loop .[6] Experimental correlations are from [12] and is from [13] as in [12]. Predictions for are obtained using [12] and also with a “Bayesian” likelihood method[5]. Both methods give very similar results, and only the former are reported here. When fitting the same observables the SM predictions and results agree well with [8, 12], with small differences from our use of [6].
Table 1 summarizes fits of four data sets, in which none, one, or both sets of anomalous measurements are excluded. We vary and , which are constrained, and and , which are unconstrained. Fit A is our “all data”set, including the ten -sensitive observables (the six determinations, , and three “non-asymmetry” observables, , , and ) and five -insensitive observables (, , , , and ). The CL increases from 0.02 in fit A to 0.17 if is omitted (B), or to 0.08 if the hadronic asymmetries are omitted (C), to 0.71 if both are omitted (D).
Fits restricted to the -sensitive sector, which determines the SM prediction for , are also shown in table 1. Fit A′, with all ten -sensitive observables, has , while B′ and C′ are at 0.07 and 0.02 respectively, each substantially smaller than the corresponding global fits A,B,C. A fit of just the three most precise -sensitive observables, , , and , which together dominate the prediction,555The fit to these three observables has with (90% CL), compared with and from the all-data global fit A. yields and . The poor consistency of the -sensitive sector is cause for concern in assessing the reliability of the SM prediction of .
Table 1. Results for global fits A - D and for the corresponding fits restricted to -sensitive observables, A′ - D′.
| All | ||
|---|---|---|
| All | A | B |
| , | 16.5/12, 0.17 | |
| C | D | |
| 16.7/10, 0.081 | 6.3/9, 0.71 | |
| -sensitive only: | ||
| All | A′ | B′ |
| 22.2/8, 0.0046 | 13.2/7, 0.067 | |
| C′ | D′ | |
| 13.2/5, 0.022 | 2.94/4, 0.57 |

The global CL’s fairly reflect the likelihoods of the fits. Consider for example fit B, for which is the only significant outlyer, with a pull of 2.59. While corresponds to , in the context of fit B we should ask for the probability that at least one of 12 independent measurements would deviate by . This is , which appropriately reflects from the global fit.
It is also instructive to consider the predictions of the -sensitive observables, table 2. For the central value is GeV, the 95% upper limit is 122 GeV, and the
Table 2. Predictions for from the three highest precision -sensitive observables, from the combined leptonic asymmetries , the combined hadronic asymmetries , and the three remaining (non-asymmetry) -sensitive observables. The value of at the minimum is shown along with the symmetric 90% confidence interval and the likelihood for GeV. Values indicated as or fall below or above the interval GeV within which the fits are performed.
| (GeV) | 90% | ||
|---|---|---|---|
| 39 | 0.062 | ||
| 410 | 0.97 | ||
| 35 | 0.12 | ||
| 55 | 0.10 | ||
| 410 | 0.97 | ||
| 17 | 0.057 |
likelihood for GeV is . The mass also prefers small . The only important contributor to large is , with central value GeV and symmetric 90% CL interval up to 1200 GeV. Also shown are the predictions of the three leptonic asymmetries which are similar to , the three hadronic asymmetries which are nearly identical to (since it has much greater precision than and ), and the non-asymmetry measurements which resemble though with a stronger preference for light . The distributions are shown in figure 1.
Table 3 summarizes the predictions of the four global fits for which is shown in table 1. Fit A is similar to the EWWG all-data fit[8], with the 95% CL upper limit at GeV. The omission of from fit B increases appreciably but has little effect on . Fits C and D, with the hadronic asymmetry measurements excluded, both have GeV as central value, with 7% and 5% CL’s respectively for GeV. The distributions for fits A and D are shown in figure 2.
Since the internal consistency of the global fit, , and the consistency of the fit with the search limit, , are independent, it is interesting to consider the combined probability, given by the product
The relative values of for the different fits are especially interesting. From table 3 we see that is approximately independent of whether the hadronic asymmetry measurements are included, although the individual factors on the right side of eq. (1) are very sensitive to . For instance, for global fit A ( ‘all’ data), and so that .For fit C, with the three omitted, we have , , and . Similarly, and . If the hadronic asymmetry measurements are omitted, the increase in the global fit confidence level is compensated by a roughly equal decrease in the consistency with the direct search limit.
Table 3. Higgs boson mass predictions for global fits A - D. Each entry shows the value of at the minimum, the symmetric 90% confidence interval, the CL for consistency with the search limit, and the combined likelihood , eq. (1), with the factors and explicitly displayed.
| All | ||
|---|---|---|
| All | A | B |
| C | D | |
It is easy to show that the product of independent CL’s has an expectation value of so that the expectation value of is 0.25. Consider a continuous probability density function defined for positive , with normalization
Then the CL for is
and the expected value of F is
where equations (2) and (3) suffice to evaluate the integral. For a product of independent CL’s the expectation value of the combined product CL is then given by factors of the form of equation (4), with the result . In the case at hand is the product of two distributions: and , where is the difference between the minimum at and the global minimum. The factor 1/2 in is compensated by the fact that the domain of extends from to ; modifying equations (2-4) appropriately, the expected value is again 1/2.

In addition to the pairings and , the other prominent feature of table 3 is that depends sensitively on whether is retained but not on , i.e., and . For fits C and D, with omitted, the consistency with the search limit is poor. Relative to 0.25, the value of is marginal for all four fits.
3 New Physics to Increase
The low values of in fits C and D are either statistical fluctuations (e.g., of ) or they are signals of new physics. Examples of new physics that could do the job are the MSSM with light sneutrinos and sleptons (Altarelli et al. in [10]) or a fourth generation of quarks and leptons with a massive neutrino (Novikov et al. in [10]). An illustrative set of parameters for the latter is GeV, GeV, GeV, GeV, and GeV.
The prediction for can be increased arbitrarily in models for which the dominant effect of the new physics is via the and boson self energies, considered in the oblique approximation[14]. Figure 3 shows an fit to the minimal data set, with the minimum read to the left and read to the right. In contrast to the SM fit with a distinct minimum at GeV, also shown, the oblique fit is flat, with no preference for any range of . The confidence level is and the variation in is very small, with for GeV.

Values of above 1 TeV cannot be interpreted literally as applying to a simple Higgs scalar. For TeV symmetry breaking is dynamical, occurring by new strong interactions that cannot be analyzed perturbatively.[15] If the Higgs mechanism is correct, there are new quanta that form symmetry breaking vacuum condensates. Values of above 1 TeV can be regarded only as a rough guide to the order of magnitude of the masses of the condensate-forming quanta.
The range of positive needed in figure 3 occurs in models with custodial breaking, e.g., from nondegenerate quark or lepton isospin doublets. Negative is less natural but there is not a no-go theorem, and models with have been exhibited. It is also possible to fit the data by varying with fixed — see figure 11 of [5]. Moderately large, postive is again preferred. In this fit the confidence level for above the LEP II lower limit is , and the 95% upper limit extends to GeV.
4 Discussion
Taken together the precision electroweak data and the direct searches for the Higgs boson create a complex puzzle with many possible outcomes. An overview is given in the “electroweak schematic diagram,” figure 4. The diagram illustrates how various hypotheses about the two anomalies lead to new physics or to the conventional SM fit. The principal conclusion is reflected in the fact that the only lines leading into the ‘SM’ box are labeled ‘Statistical Fluctuation.’ That is, systematic error of both and cannot save the SM fit, since it implies the conflict with the search limit, indicated by the box labeled , which in turn either implies new physics or reflects statistical
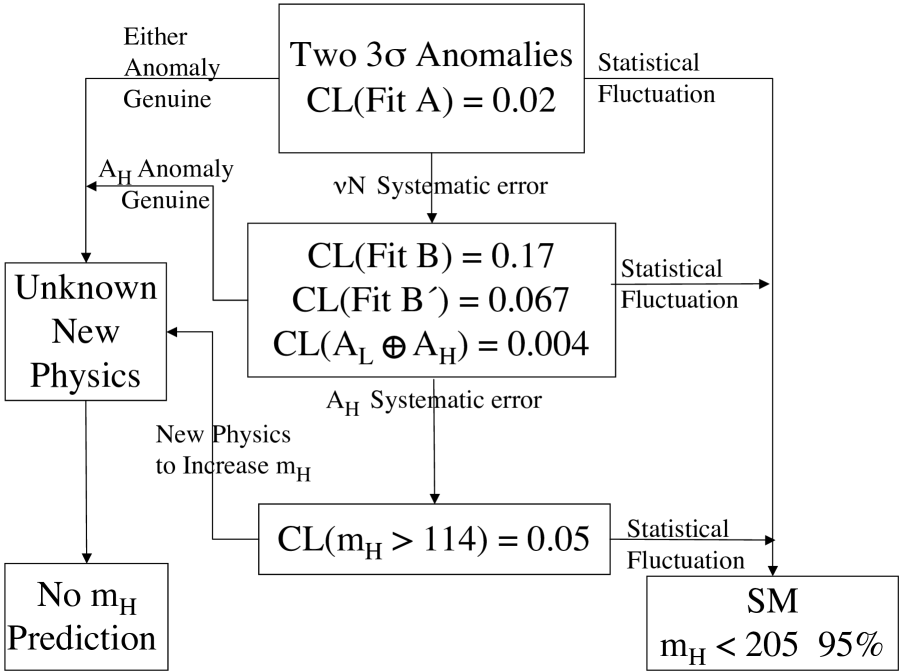
fluctuation (e.g., of ). The problem is exhibited by the small value of for each of the fits in table 3.
The ‘New Physics’ box in figure 4 is reached if either anomaly is genuine or, conversely, if neither is genuine and the resulting 95% conflict with the search limit is genuine. The global confidence levels of fits A and B fairly reflect the probability that they are due to statistical fluctuations. They do not favor the SM and they also do not exclude it: “It is a part of probability that many improbable things will happen.”[16]
The smoothest path to the SM traverses the central box, fit B, and then exits via ‘Statistical Fluctuation’ to the SM. In this scenario QCD effects might explain the NuTeV anomaly and the 17% confidence level of fit B could be a statistical fluctuation. This is a valid possibility, but two other problems indicated in the central box should also be considered in this scenario. First, the consistency of the -sensitive measurements is marginal, indicated by the 6.7% confidence level of fit B′. Second, the persistent conflict between the leptonic and hadronic asymmetry measurements, currently with , is at the heart of the determination of . Thus even if we assume that the of the global fit is a statistical fluctuation, the reliability of the prediction of depends on even less probable fluctuations.
The leptonic asymmetry measurements have been finalized. There are still some ongoing analyses of the hadronic asymmetry data, but unless major new systematic effects are uncovered, large changes are unlikely. To do better we will need a second generation Z factory, such as the proposed Giga-Z project. However, to fully exploit the potential of such a facility it will be necessary to improve the precision of by a factor of or better, requiring a dedicated program to measure below GeV to .[17] The boson and top quark mass measurements will be improved at the TeVatron, LHC, and, eventually, at a linear collider.
The issues raised by the data heighten the excitement of the moment in high energy physics. If both anomalies reflect systematic effects, the resulting SM fit is inconsistent with the LEP II limit. For the SM prediction of to be valid the anomalies must be a propitious combination of systematic effect () and statistical fluctuation ( vs. ). The end of the decade of precision electroweak measurements leaves us with a great puzzle, that puts into question the mass scale at which the physics of electroweak symmetry breaking will be found. The solution of the puzzle could emerge at the TeVatron. If it is not found there it will emerge at the LHC, which at its design luminosity will be able to search for the new quanta of the symmetry breaking sector over the full range allowed by unitarity.[15, 18]
Acknowledgement: I wish to thank the organizers for the opportunity to attend this very interesting workshop and Peter Zerwas for kind hospitality beyond the call of duty.
References
- [1] K. McFarland, these proceedings.
- [2] M. Swartz, these proceedings.
- [3] P. Wells, these proceedings.
- [4] M. S. Chanowitz, Phys. Rev. D 59 (1999) 073005 [arXiv:hep-ph/9807452].
- [5] M. S. Chanowitz, Phys. Rev. D 66 (2002) 073002 [arXiv:hep-ph/0207123]; Phys. Rev. Lett. 87 (2001) 231802 [arXiv:hep-ph/0104024].
- [6] A. Freitas, S. Heinemeyer and G. Weiglein, arXiv:hep-ph/0212068.
- [7] R. Hawkings, these proceedings.
- [8] M. Grünewald, these proceedings.
- [9] For new physics models of the anomalies see for instance X. G. He and G. Valencia, Phys. Rev. D 66 (2002) 013004 [Erratum-ibid. D 66 (2002) 079901]; D. Choudhury, T. M. Tait and C. E. Wagner, Phys. Rev. D 65 (2002) 053002 [arXiv:hep-ph/0109097]; W. Loinaz, N. Okamura, T. Takeuchi and L. C. Wijewardhana, arXiv:hep-ph/0210193.
- [10] For new physics to increase see for instance G. Altarelli, F. Caravaglios, G. F. Giudice, P. Gambino and G. Ridolfi, JHEP 0106 (2001) 018 [arXiv:hep-ph/0106029]; V. A. Novikov, L. B. Okun, A. N. Rozanov and M. I. Vysotsky, JETP Lett. 76 (2002) 127 [Pisma Zh. Eksp. Teor. Fiz. 76 (2002) 158] [arXiv:hep-ph/0203132]; Phys. Lett. B 529 (2002) 111 [arXiv:hep-ph/0111028].
- [11] D. Bardin et al., Comput. Phys. Commun. 133 (2001) 229 [arXiv:hep-ph/9908433].
- [12] The LEP Collaborations ALEPH, DELPHI, L3, OPAL, the LEP Electroweak Working Group, and the SLD Heavy Flavour and Electroweak Groups, LEPEWWG/2002-02, December 10, 2002 [arXiv:hep-ex/0112036].
- [13] H. Burkhardt and B. Pietrzyk, Phys. Lett. B 513, (2001) 46.
- [14] M. E. Peskin and T. Takeuchi, Phys. Rev. D 46 (1992) 381.
- [15] M. S. Chanowitz and M. K. Gaillard, Nucl. Phys. B 261 (1985) 379.
- [16] Agathon, quoted by Aristotle in the Poetics, as translated by G. Eliot in Daniel Deronda.
- [17] F. Jegerlehner, these proceedings.
- [18] M. S. Chanowitz and W. B. Kilgore, Phys. Lett. B 347 (1995) 387 [arXiv:hep-ph/9412275];Phys. Lett. B 322 (1994) 147 [arXiv:hep-ph/9311336]; J. Bagger et al., Phys. Rev. D 52 (1995) 3878 [arXiv:hep-ph/9504426].