Quasiparticle Description of the QCD Plasma,
Comparison with Lattice Results at Finite and
Abstract:
We compare our flavor, staggered QCD lattice results with a quasiparticle picture. We determine the pressure, the energy density, the baryon density, the speed of sound and the thermal masses as a function of and . For the available thermodynamic quantities the difference is a few percent between the results of the two approaches. We also give the phase diagram on the – plane and estimate the critical chemical potential at vanishing temperature.
1 Introduction
QCD at high temperatures () and/or quark chemical potentials () plays an important role in particle physics, since it describes relevant features of nature in extreme conditions. According to the standard picture of QCD, at high and/or there is a change from a state dominated by hadrons to a state dominated by partons (quarks and gluons). This transition happened in the early Universe (at essentially vanishing net baryon density [1]) and probably happens in heavy ion collisions (at moderate but non-vanishing density) and in neutron stars (at large density, for which a rich phase structure is conjectured [2, 3, 4]). There has been several studies in order to determine the thermodynamic properties of the QCD plasma. The weak coupling expansion of thermodynamic quantities shows a poor convergence near the transition temperature [5, 6, 7]. Better convergence is expected from different improved techniques, e.g. screened perturbation theory [8, 9], or a systematic rearrangement of the perturbative expansion [10], or using an effective field theory in 3D [11]. Note that noticeable deviations () from the ideal gas limit is expected upto temperatures as high as 1000 times the critical temperature (). The lattice approach is applicable to investigate the plasma upto a several times and at zero chemical potential [12, 13, 14]. The phenomenology of these lattice results has been widely analyzed in the literature. Successful quasiparticle descriptions [15, 16, 17] have been introduced to reproduce the properties of the QCD plasma. One can extrapolate these results to non-zero baryon densities by using the thermodynamical consistency of the model. Unfortunately, until recently it was not possible to compare the predictions of the quasiparticle model with direct lattice calculations. The lack of lattice results was a consequence of the sign problem. The fermionic determinant in the path integral becomes complex for non-vanishing -s. This fact spoils any Monte-Carlo based technique used in numerical simulations.
Many suggestions were studied in detail to solve the sign problem and to give physical answers on the lattice at non-vanishing chemical potentials. Unfortunately, until recently none of them were successful. Recent interest in this field was initiated by the overlap improving multi-parameter reweighting method [18]. The phase diagram and the critical point were determined in the flavor QCD on lattices with staggered quarks [19]. Several groups confirmed the results of Refs. [18, 19] on the phase diagram [20, 21, 22]. Furthermore, it became possible to determine the equation of state (EoS) at finite chemical potentials [23], too (for a recent review on lattice QCD at non-vanishing chemical potentials see Ref. [24]). Thus, it would be of interest to see how these new lattice results can be described with the quasiparticle approach. This is the primary goal of the present paper.
The paper is organized as follows. In Section 2 we briefly summarize the quasiparticle approach at and show how to extend it to non-vanishing chemical potentials. Section 3 compares our most recent lattice results with the prediction of the quasiparticle model. In Section 4 we summarize.
2 Quasiparticle model
In order to be self-contained we start with a brief review of the quasiparticle model 111When writing up this paper a different phenomenological approach was compared with lattice results at non-vanishing in Ref. [25]. The quark-gluon plasma liquid model was found to be in close agreement with our lattice data. suggested in Ref. [16]. Consider a QCD plasma containing gluons (), number of “light” and number of “heavy” quarks ( and , respectively). These basic constituents have temperature and chemical potential dependent effective masses
| (1) |
where the -s are the rest masses, -s are the chemical potentials of partons and the -s are the asymptotic values of the hard thermal/density-loop self-energies
| (2) | |||
| (3) |
where is the effective gauge coupling (depending on , , see below), and the summation is performed over the quark flavors (). We are interested in the non-zero “light” quark chemical potential region therefore we set for the “heavy” quarks. Note that the baryonic chemical potential is three times the “light” quark one. In our notations .
The thermodynamic potential the pressure contains contribution from the ideal pressure of the quasiparticles () and from the pressure arising from their interactions ():
| (4) |
The ideal gas pressure is the usual Fermi or Bose integral which takes into account the antiparticles in the quark pressure, too:
| (5) | |||
| (6) |
We do not fix the quark and gluon state multiplicities separately, but we demand that their ratio should be . If we impose a stationarity condition [26] on the pressure then further thermodynamic quantities (such as energy density (), quark number density () and entropy density ()) will have only quasiparticle and mean field, , contributions:
| (7) |
where is the ideal quark number density. The functional form of the interaction pressure, , follows from the above condition, too. The derivatives of in and directions are easily accessible quantities
| (8) |
so can be obtained by an appropriate line integral on the plane.
What remains to be done is to determine the effective gauge coupling which appears in the formula of the self-energies. For vanishing chemical potentials it decreases logarithmically with increasing temperature. A renormalization group inspired parametrization is as follows:
| (9) |
Imposing the Maxwell-relation between the derivatives of the quark number density and entropy
| (10) |
yields a first order, linear partial differential equation for with straightforwardly calculable coefficients
| (11) |
This differential equation should be solved with the boundary condition at (eq. (9)). Thus, the quasiparticle model is unambiguously defined by using thermodynamical consistency for non-zero -s above the critical line (). Below the solution of the differential equation, thus the pressure is not unique. In this region the system has hadronic degrees of freedom instead of partonic. The quasiparticle model constructed from partons looses its validity.
3 Comparison with lattice results
As we have already mentioned the sign problem of lattice QCD at finite chemical potentials spoils any Monte-Carlo method based on importance sampling. The recently proposed overlap ensuring multi-parameter reweighting method [18] enabled us to determine the EoS at non-zero temperatures and chemical potentials [23]. The simulations were carried out on temporal and spatial extension lattices with two “light” () and one “heavy” () dynamical quarks. Note that the mass of the “heavy” quark corresponds approximately to the physical mass of the strange quark, whereas the mass of the “light” quarks is several times larger than the physical values for the up/down quarks. In the lattice analysis both the temperature and the baryon chemical potential covered the range upto .
Our lattice calculations were done on lattices with temporal extension. In order to help the continuum interpretation we multiply the lattice results by the dominant correction factors between the and the continuum case. We denote the limit as the SB (Stefan-Boltzmann) case.
| (12) | |||
| (13) |
Note that the dependence of these factors are suppressed in the limit. Here indicates the difference between the pressure at and the pressure at . The well-known continuum expressions for the non-interacting quark gluon plasma are
| (14) | |||
| (15) |
Including these dominant multiplicative corrections the results might be interpreted as continuum estimates. (Clearly, the appropriate – but more CPU-consuming – way is to carry out the lattice calculations at and perform an extrapolation to .)
The quasiparticle model has four free parameters: and to determine the gauge coupling, the gluon multiplicity and the integration constant in the interaction pressure. They were used as fit parameters in order to receive the least possible difference between the thermodynamic observables measured on the lattice and the ones predicted by the quasiparticle description. In principle it is sufficient to use only the lattice results at vanishing in the fitting procedure since afterwards the thermodynamical consistency unambigously defines the quasiparticle approach; but this could lead to large differences between the two types of descriptions at non-vanishing -s. It turned out to be more sensible to use both the and the lattice data for fitting in order to gain a better agreement between the two approaches for higher -s. Therefore we fitted the quasiparticle picture on the at and at our highest chemical potential () lattice results, simultaneously. The chi-square function () was constructed by using the statistical errors of the lattice data. We constructed statistical errors for the fit parameters, which are to give the confidence level corresponding to the bounds of the interval [27]. Clearly, the parameter region according to this confidence level has a complicated shape in the four-dimensional parameter space. The quoted errors just indicate the borders of this domain. Furthermore, these errors should be taken with a grain of salt, since the constructed functions contains no information about the systematical uncertainties of our lattice data. We found it to be more reliable to fit on lattice results instead of at , since minimizing the function of the pressure yielded an interaction measure without a turning-point around , which is typical of the lattice results. The best parameter values with statistical uncertainties can be found in Table 1.
| MeV |
Using the best fit parameters we can obtain the temperature and chemical potential dependence of several thermodynamic quantities and compare them with lattice data. Note that we use as the overall scale in the results. In formulas and figures is used as the transition temperature at vanishing chemical potential, whereas indicates the transition temperature at non-vanishing chemical potentials. We chose the chemical potential values so as to cover the characteristic -s occuring in the heavy ion collisions. At our smallest chemical potential value, MeV, and at around MeV Au+Au colliding experiments were carried out at RHIC [28, 29], whereas at MeV Pb+Pb collisions took place at SPS [30].
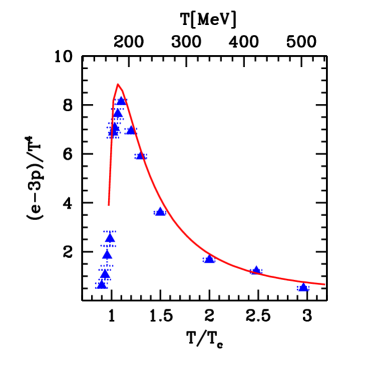
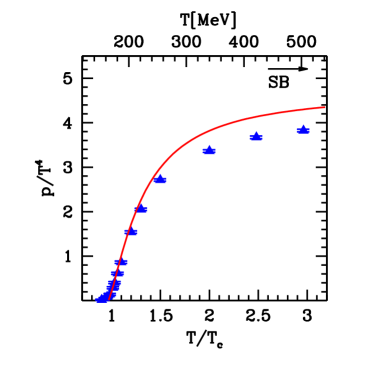
Figures 1 and 2 show the behavior of the “interaction measure”, (), and the pressure (both normalized by ) at vanishing chemical potentials. Both the lattice result and the prediction of the quasiparticle approach are given. On the one hand there is a good agreement between the two techniques for (), on the other hand for the pressure one finds a larger difference. It is easy to understand the reason for that. First of all we used in our fitting procedure, therefore a better agreement is expected for this quantity than for , which is a predicition of the model. Secondly, the pressure can be obtained as an integral of the interaction measure
| (16) |
Differences in () at small temperatures dominates the above integral. Though the difference between the lattice and the quasiparticle results for () is rather small at large one observes a 20% difference around . Therefore we end up with an difference for even in the large region. There might be several explanations for the differences between the two approaches. It can be that the lattice results in the continuum limit () change the picture and lead to smaller discrepancies. Alternatively, it also can be that the quasiparticle approach simplifies the interaction in the quark-gluon plasma. This means that the predicition of this method can be off.
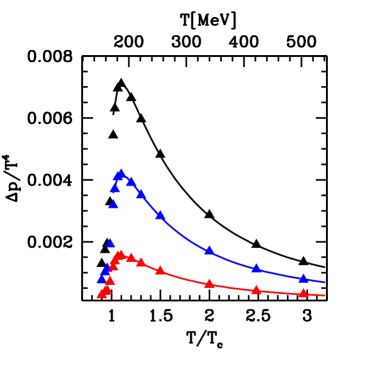
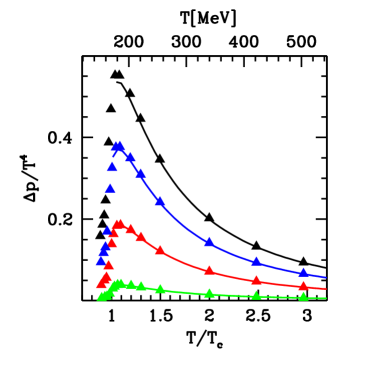
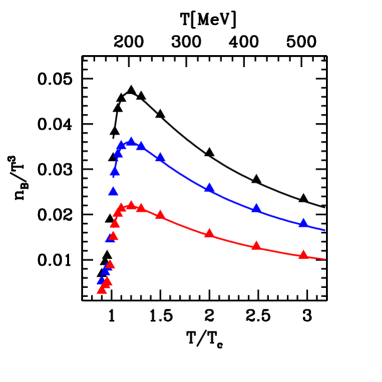
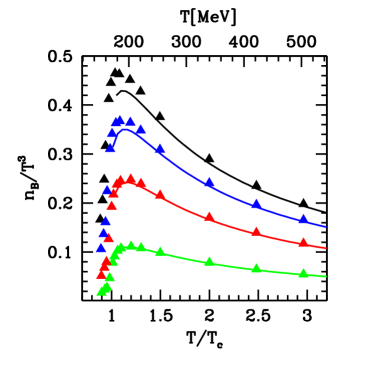
We show the temperature dependence of in Figure 3 and that of in Figure 4. Both figures indicate a nice agreement between the two types of QCD plasma descriptions (the largest difference is at low temperatures and high chemical potential). The temperature dependence of the baryon density is similar to that of the pressure since they are connected by the formula
| (17) |
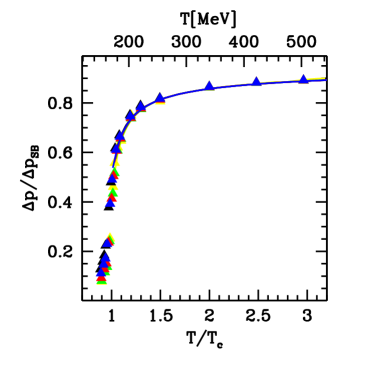
We observe an interesting scaling behavior of normalized by (Figure 5). This quantity () depends only on and it is almost independent of the chemical potential. This scaling behaviour is less accurate around and it gets more and more precise for higher temperatures.
It is of extreme importance to determine the phase line (the line, which separates the phases dominated by hadrons and partons). One is particularly interested in results at low temperatures, for which only model estimates are available. First we use the quasiparticle picture, then an extrapolation to the lattice data in order to determine the phase line.
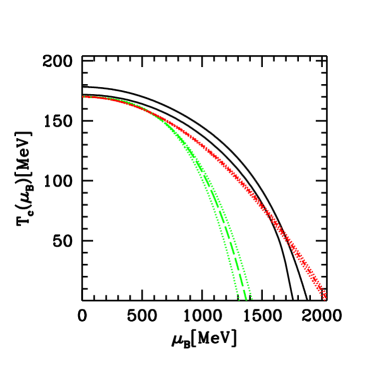
We defined a quasiparticle critical line based on the following observation (see Figure2): the pressure around is a lot lower than the pressure at high temperatures, which is in the order of . A simple explanation of this fact is that the number of degrees of freedom in the QGP is much bigger than in the hadronic phase, which is a dilute gas of pions. So we set to be a few percent of along the phase line (note that the result is rather insensitive to the exact value of this percentage as illustrated in Figure 6). The line defined above is depicted also at rather low temperatures and we get MeV for the point of intersection on the axes. We must interpret this value as the critical chemical potential () with great care since for the low temperature, high chemical potential region the color-superconducting phase is conjectured [31], which is obviously not contained in this quasiparticle framework.
The quasiparticle transition line shows a nice agreement with the directly measured lattice transition line in the region (Figure 6). Outside of this region we do not have direct lattice results. It is intriguing to see the behavior of the critical lines when . We extended our lattice transition line to zero temperature by using two fits namely a second and a fourth order polynom. Due to versus - symmetry we keep only even order terms in the fitting procedure. The bands in Figure 6 indicate the statistical uncertainties of the fits. The two curves agree nicely in the directly measured region. They deviate for smaller temperatures and larger chemical potentials. The quadratic polynomial fit predicts at vanishing temperature MeV (which exceeds expectations). The quartic approximation gives for the same quantity MeV. The difference between the predicitions of the two kinds of polynoms might be interpreted as a rough estimate for the systematic uncertainty of the extrapolation to low temperatures.
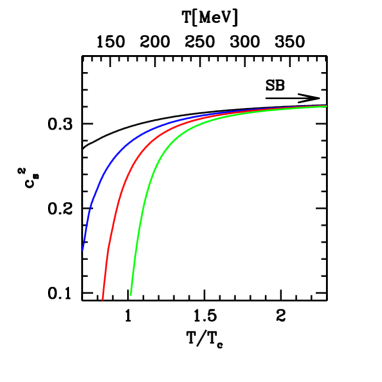
The dynamical properties of the plasma phase is primarily determined by the speed of sound
| (18) |
As it can be seen in Figure 7 increasing chemical potential yields higher speed of sound.
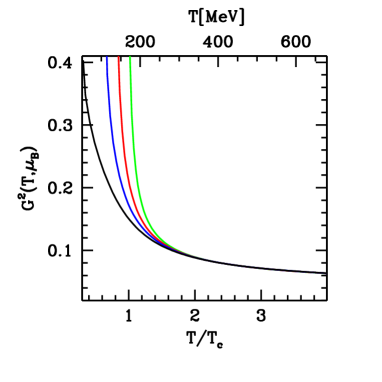
One can also look for the predictions of the quasiparticle model for quantities which are straightforward predicitions of the quasiparticle approach however, it is difficult to obtain them directly on the lattice. Such important quantity is the gauge coupling of the quasiparticle picture, which is shown in Figure 8. Note that the static potential at finite chemical potentials can be in principle measured on the lattice. Using the lattice potential one can easily define the gauge coupling. Clearly, the parametrization of the gauge coupling in the quasiparticle picture is not equivalent with the above mentioned coupling.
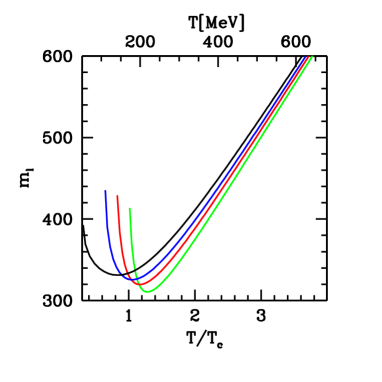
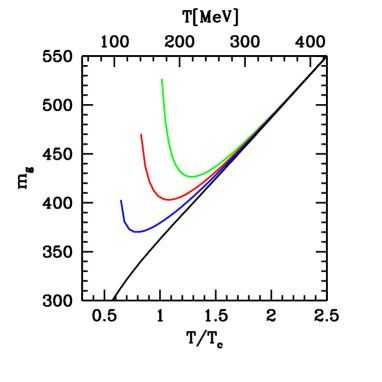
In order to understand the typical degrees of freedom in the high temperature QCD phase at non-vanishing chemical potentials it is instructive to study the effective masses of the quasiparticles. Figure 9 shows the temperature dependence of the light quark masses for different chemical potentials, whereas Figure 10 presents the results on the gluon masses. According to our observations these quantities are almost independent of the chemical potential in the region. Due to the stationarity condition small changes in the mass do not change the pressure. It means that the chemical potential dependence of the thermodynamic quantities are primarily coming from the direct dependence of the Fermi integrals.
4 Conclusion
In this paper we studied the quasiparticle approach to describe the equation of state of the hot QCD plasma. We have fitted the free parameters of the model by using our flavor, dynamical staggered QCD lattice results in the region . After calculating the pressure, interaction measure and density we found a good agreement between the quasiparticle predictions and our lattice data. The model successfully justifies the scaling behavior of observed in the lattice calculations. We gave some confidence intervals for the fit parameters in spite of the lack of continuum extrapolations. Using the best fit parameters the quasiparticle critical line and the speed of sound were given for higher values of . The zero temperature limit of the quasiparticle and lattice critical lines (critical value) cover the MeV region.
Acknowledgements:
We highly appreciate Z. Fodor’s continuous help.
Useful suggestions on the manusscript from T. Csörgő,
B. Kämpfer, S. D. Katz and P. Lévai
are also acknowledged.
This work was partially supported by Hungarian Scientific
grants, OTKA-T34980/T29803/T37615/M37071/OMFB1548/OMMU-708.
References
- [1] See the proceedings of recent Quark Matter Conferences, Nucl. Phys A698 (2002), Nucl. Phys. A661 (1999).
- [2] M. G. Alford, K. Rajagopal and F. Wilczek, Phys. Lett. B 422 (1998) 247 [arXiv:hep-ph/9711395]; Nucl. Phys. B 537 (1999) 443 [arXiv:hep-ph/9804403].
- [3] R. Rapp, T. Schafer, E. V. Shuryak and M. Velkovsky, Phys. Rev. Lett. 81 (1998) 53 [arXiv:hep-ph/9711396].
- [4] K. Rajagopal and F. Wilczek, [arXiv:hep-ph/0011333].
- [5] P. Arnold and C. X. Zhai, Phys. Rev. D 50 (1994) 7603 [arXiv:hep-ph/9408276]; Phys. Rev. D 51 (1995) 1906 [arXiv:hep-ph/9410360].
- [6] C. X. Zhai and B. Kastening, Phys. Rev. D 52 (1995) 7232 [arXiv:hep-ph/9507380].
- [7] E. Braaten and A. Nieto, Phys. Rev. D 53 (1996) 3421 [arXiv:hep-ph/9510408].
- [8] F. Karsch, A. Patkós and P. Petreczky, Phys. Lett. B 401 (1997) 69 [arXiv:hep-ph/9702376].
- [9] J. O. Andersen, E. Braaten and M. Strickland, Phys. Rev. D 63 (2001) 105008 [arXiv:hep-ph/0007159].
- [10] J. P. Blaizot, E. Iancu and A. Rebhan, Phys. Rev. Lett. 83 (1999) 2906 [arXiv:hep-ph/9906340]; Phys. Lett. B 470 (1999) 181 [arXiv:hep-ph/9910309]; Phys. Rev. D 63 (2001) 065003 [arXiv:hep-ph/0005003].
- [11] K. Kajantie, M. Laine, K. Rummukainen and Y. Schroder, Phys. Rev. Lett. 86 (2001) 10 [arXiv:hep-ph/0007109].
- [12] S. Gottlieb et al., Phys. Rev. D 55 (1997) 6852 [arXiv:hep-lat/9612020].
- [13] F. Karsch, E. Laermann and A. Peikert, Phys. Lett. B 478 (2000) 447 [arXiv:hep-lat/0002003].
- [14] A. Ali Khan et al. [CP-PACS collaboration], Phys. Rev. D 64 (2001) 074510 [arXiv:hep-lat/0103028].
- [15] P. Lévai and U. W. Heinz, Phys. Rev. C 57 (1998) 1879 [arXiv:hep-ph/9710463].
- [16] A. Peshier, B. Kämpfer, G. Soff Phys. Rev. C 61 (2000) 045203 [arXiv:hep-ph/9911474]; Phys. Rev. D 66 (2002) 094003 [arXiv:hep-ph/0206229].
- [17] P. Romatschke [arXiv:hep-ph/0210331].
- [18] Z. Fodor and S. D. Katz, Phys. Lett. B 534 (2002) 87 [arXiv:hep-lat/0104001].
- [19] Z. Fodor and S. D. Katz, JHEP 0203 (2002) 014 [arXiv:hep-lat/0106002].
- [20] C. R. Allton et al., [arXiv:hep-lat/0204010]; S. Ejiri et al., [arXiv:hep-lat/0209012]; C. Schmidt et al., [arXiv:hep-lat/0209009]; C. Schmidt [arXiv:hep-lat/0210037].
- [21] P. de Forcrand and O. Philipsen, [arXiv:hep-lat/0205016]; [arXiv:hep-lat/0209084].
- [22] M. D’Elia and M. P. Lombardo, [arXiv:hep-lat/0205022]; [arXiv:hep-lat/0209146].
- [23] Z. Fodor, S. D. Katz and K. K. Szabó, [arXiv:hep-lat/0208078]; F. Csikor, G. I. Egri, Z. Fodor, S. D. Katz, K. K. Szabó and A. I. Tóth, [arXiv:hep-lat/0209114].
- [24] Z. Fodor, [arXiv:hep-lat/0209101].
- [25] J. Letessier and J. Rafelski, [arXiv:hep-lat/0301099].
- [26] T. D. Lee and S. N. Yang, Phys. Rev. 117 (1960) 22
- [27] W. H. Press, S. A. Teukolsky, W. T. Vetterling and B. P. Flannery 1992, Numerical Recipes in C, 2nd ed. (Cambridge University Press), §15.6; Particle Data Group Phys. Rev. D 66 (2002) 010001.
- [28] A. Andronic, P. Braun-Munzinger, K. Redlich, J. Stachel, [arXiv:nucl-th/0209035]; P. Braun-Munzinger, D. Magestro, K. Redlich, J. Stachel, [arXiv:hep-ph/0105229].
- [29] T. Csörgő, A. Ster, [arXiv:nucl-th/0207016].
- [30] W. Broniowski, W. Florkowski, [arXiv:nucl-th/0204025]; [arXiv:nucl-th/0208061].
- [31] M. Alford, Annu. Rev. Nucl. Part. Sci. 51 (2001) 131-160 [arXiv:hep-ph/0102047].