A digital multi-channel spectroscopy system with 100 MHz flash ADC module for the GENIUS-TF and GENIUS projects.
Abstract
In this paper we will present the first results of applying a digital processing technology in low-level gamma spectroscopy with HPGE detectors. An experimental gamma spectrometer using Flash ADC module is built and tested. The test system is now under development and shows major advantages over the traditional analog technologies. It will be installed for the GENIUS-TF and GENIUS projects in Gran-Sasso in early 2003.
Corresponding author
Prof. Dr. H.V. Klapdor-Kleingrothaus
Max-Planck-Institut für Kernphysik
Saupfercheckweg 1
D-69117 HEIDELBERG
GERMANY
Phone Office: +49-(0)6221-516-262
Fax: +49-(0)6221-516-540
email: klapdor@gustav.mpi-hd.mpg.de
1 Introduction
The GENIUS-TF project [1] and GENIUS project [2] - the latter being under construction in the Gran Sasso Underground Laboratory - require a new modular, multi-channel data acquisition system and electronics, capable of taking data from up to 300 and more detectors simultaneously. Since last year a new range of Flash ADC modules with high sampling rates of 100 MHz and resolution of 11-12 bits are available on the market. With these devices it is now possible to develop a multi-channel system for gamma-spectroscopy if the count range is in moderate range. Using this approach it is possible to capture the detailed shape of the preamplifier signal with high speed ADC, and then perform digitally all essential data processing functions, including precise energy measurement over a range of 3 keV-3 MeV, rise time analysis, ballistic deficit correction and pulse shape analysis. Thus we can obtain both the energy and the pulse shape information from one detector using one channel of the Flash ADC module.
2 Test detector and 8-channel electronics
To test the digital processing approach for gamma spectroscopy the following setup has been used:
An ORTEC germanium detector with a built-in low noise preamplifier was connected to two 4-channel low noise amplifiers developed by MPI für Kernphysik in Heidelberg. The amplifier/filter has a variable gain ranging from 10 to 100, a variable offset with a maximum of 4 V, a variable differential filter, a pole zero cancellation circuit and two integral filters. Currently we do not use any analog shaping at this stage, these amplifiers provide only the necessary gain and DC offset. The signal outputs from these amplifiers were directly connected to the Flash ADC module developed by SIS (model 3300, 100 MHz sampling frequency, 12 bit, 8 channels, dual buffer). A VME CPU with Intel P3/850 MHz CPU, running Linux as operating system, reads out the Flash ADC. Fig.1 shows a schematic diagram of the used test system.
In the current test system the VME CPU waits for at least 10 events (2000 samples for every event) sampled in the dual buffer memory. The trigger for each event is produced by the flash ADC, which has a trapezoid FIR filter and a digital threshold circuit [4] for each of the 8 channels. After the 10 events have been triggered the memory banks of the FADC are switched and the CPU reads out the non-active memory bank. Due to this double buffer feature of the FADC we can achieve nearly zero dead time (less than 10 sec for 10 events) as long as the buffers of the FADC are not overrun. After the read out which is currently available with 4 Mbytes/sec the test system applies digital filters to the sampled data to compute the energy, the rise time, and the timing of the input pulse.
3 Digital signal processing for gamma spectroscopy
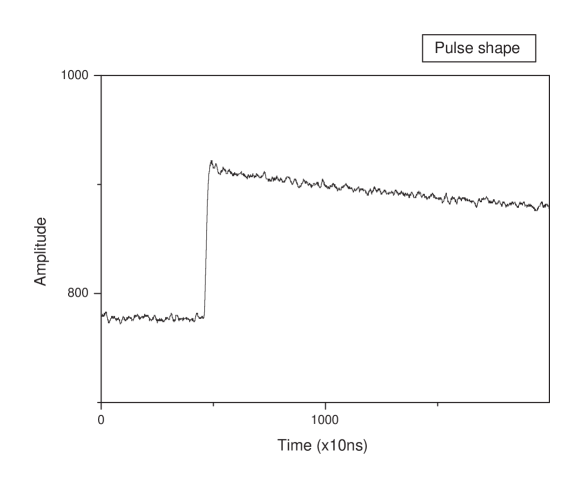
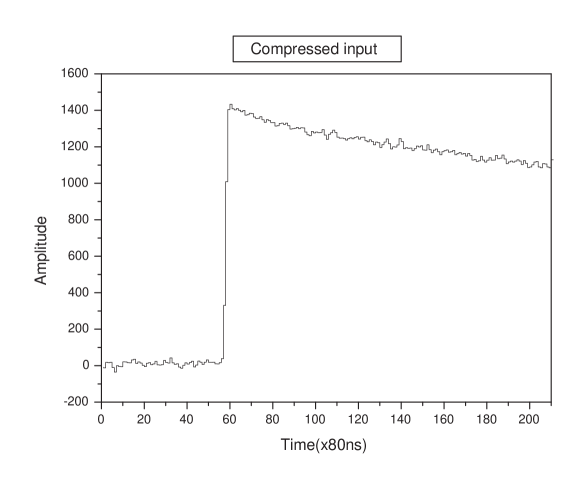
Each analog stage in a conventional spectrometer introduces irreversible signal distortion that cannot be removed by further processing stages. If the input signal is digitized at early stage, we can eliminate this problem and obtain the best result using a digital processing. In our test system each pulse from the Ge detector is digitized at 100 MHz and stored as 2000 16-bit words in the CPU memory (see Fig. 2). The first 400 words are used for base line calculation. After subtracting the base line, we compress the 2000 samples to 250 by summing every 8 samples (see Fig. 3), before applying a digital filter.
As a first stage of digital filtering we use a differential filter with P/Z compensation :
| (1) |
A simple recursive filter is used as one stage of n-pole integral filter:
| (2) |
Repeating these calculations n times we obtain the n-pole integral filter. The coefficients are found from these simple equations [3].
Differential filter:
Integral filter:
The value for can be found from the desired time constant of the filter:
The coefficient in formula (1) is intended for pole/zero compensation of the preamplifier RC time constant. The optimal value for can be found experimentally for every particular preamplifier/detector combination.
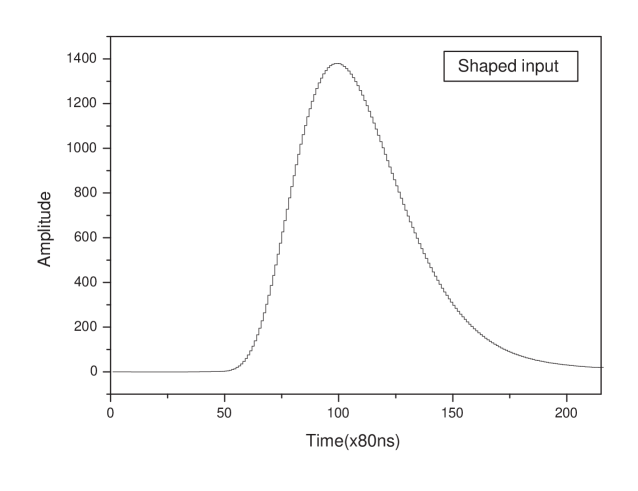
The energy value for a given event is calculated as a peak value of the filtered pulse sample (see Fig.4). The energy value is used for an energy spectrum histogram filling.
4 Experimental results.
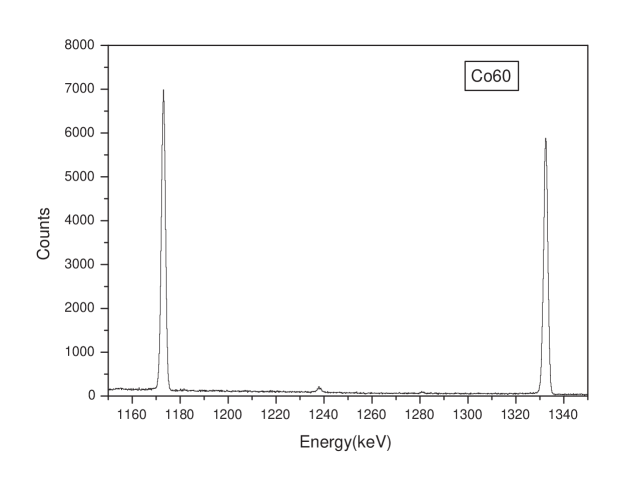
The system was extensively tested for a 3 months period. After optimization of the parameters we have found that the best energy resolution was obtained for the 8-pole digital filter with a time constant of 1.6 sec. With this filter the measured resolution of the ORTEC germanium detector was 1.9 keV (FWHM) for the 1332 keV 60Co line, and 1.3 keV for 59.5 keV 241Am line.
The resulting energy spectrum of the 60Co test source is presented in Fig. 5.
The energy resolution has nearly reproduced the FWHM measured with a peak sensing ADC (1.8 keV).
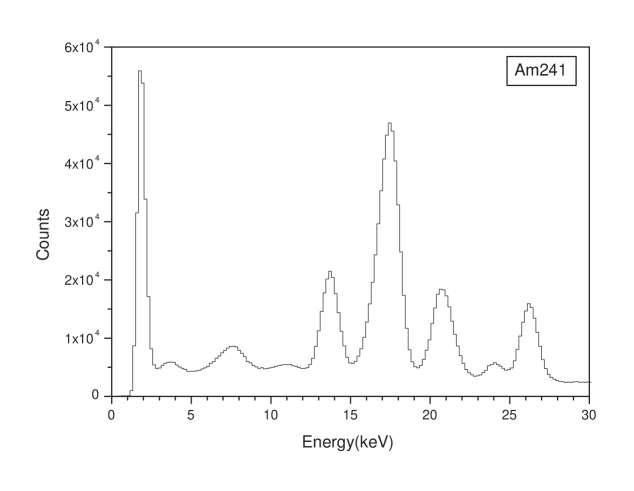
Fig. 6 shows the low-energy part of the 241Am spectrum. We have found that the low-energy threshold of the test system is about 3 keV for the given detector. It will be lower for a detector with a better energy resolution. In any case it is already a satisfactory value for the GENIUS-TF facility [1]. The measured integral non-linearity of the test system is less than 0.01%, which is corresponding to the integral non-linearity of the used ADC. The measured differential non-linearity is less than 1%. To determine the long time stability, we tested our system for a three weeks period with a 60Co source. The air temperature in the laboratory was 2110C. At this condition the maximum peak shift was less than 0.5 channels ( 0.007% ). The maximum count rate of the test system is 4000 events per second.
5 Conclusion
A digital spectroscopy system has been developed for the GENIUS-TF and GENIUS projects. Using a digital signal processing instead of analog reveals better accuracy and stability limited only by ADC quality. Our tests have proved, that this system shows an ultimate performance making it the best choice for low-level gamma spectroscopy. The system will be installed in the Gran-Sasso underground lab in the beginning of the year 2003.
6 Acknowledgement
The authors thank Mr. C. Dörr for his help in the beginning of this project. The authors would like to thank Prof. V.A. Bednyakov for his permanent interest in this work.
References
- [1] H.V. Klapdor-Kleingrothaus et al., Nucl. Instrum. Meth. A481 (2002) 149-159.
- [2] H.V. Klapdor-Kleingrothaus, J.Hellmig and M.Hirsch, GENIUS-Proposal, 20 Nov. 1997, and J. Phys. G 24 (1998) 438.
- [3] S.W. Smith, The Scientist and Engineer Guide to Digital Signal Processing, Second Edition, California Technical Publishing, San Diego, Ca, 1999
- [4] SIS3300/SIS3301 65/100 MHz VME FADCs User Manual, SIS GmbH, Hamburg, Germany, Version: Greta 1.00 as of 20.06.02