Determination of the age of the earth from Kamland measurement of geo-neutrinos
Abstract
The low energy component of the anti-neutrino spectrum observed in the recent Kamland experiment has significant contribution from the radioactive decay of and in the earth. By taking the ratio of the anti-neutrino events observed in two different energy ranges we can determine the present value of the Thorium by Uranium abundance ratio, independent of the U,Th distribution in the earth. Comparing the present abundance ratio with the r-process predicted initial value we determine the age of the earth as a function of and . We find that the age of the earth determined from KamLAND data matches the age of solar system ( determined from meteorites) for the LMA-I solution. For the LMA-II solution the age of the earth does not match the solar system age even at
The recent results from KamLAND kam are significant for establishing the LMA solution of the solar neutrino problem. In addition they present the first statistically significant measurement the anti-neutrinos from radioactive decay of and present in the crust and mantle of the earth. The possibility of detecting geo neutrinos from radioactivity in the the earth was first raised by Eder eder and was revived by Krauss et al krauss and Kobayashi and Fukao koba . Quantitative spectra of the anti-neutrino events which could be observed at Kamioka and Gran Sasso from radioactivity of and in the earth has been given by Rothschild et al roth and Raghavan et al ragh . The emphasis of these papers and the recent work of Fiorentini et al fior1 is to use the observations of events at KamLAND and Borexino experiments to determine the distribution of in the crust and mantle of the earth, and determine what fraction of the heat generated by earth from radioactivity. KamLAND kam reports observing events below (visible positron energy) which are ascribed to radioactivity in the earth. Subsequently a analysis of the geo neutrinos from KamLAND observations has been done by Fiorentini et al fior2 with the aim of determining the geological distribution of and in the earth. Fiorentini et al. assume that the solar system value and try to determine the and content of the core and mantle.
In this paper we have a different aim which is to extract the average thorium by uranium abundance ratio, from the KamLAND data, as this parameter is an ideal chronometer for measurement of cosmological time-scales. and present in the earth are produced in supernova by r-process nucleosynthesis arnett . The theoretical prediction initial abundance ratio is robust against perturbations of the astrophysical parameters at the site of the r-process to within otsuki . By determining the present abundance ratio of in the earth from KamLAND, we can measure the age of the earth-i.e the time elapsed between the supernova explosion where the and in the earth were produced, and the present. KamLAND observes geo anti-neutrinos in the (positron signal) energy range . Thorium decay neutrinos have a maximum value of whereas Uranium neutrinos contribute in the entire observed energy range of the geo signal. The geo neutrinos undergo an energy independent suppression as their average distance from the detector is much larger than the oscillation length . We take the ratio of the geo events, in the the bins and the geo events, in the energy bins to determine the . This enables us to determine the age of the earth independent of the geological distribution of and in the earth.
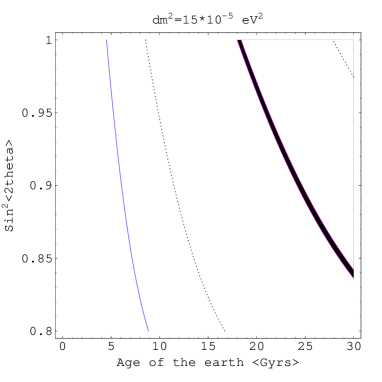
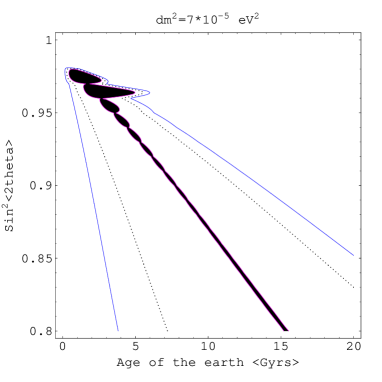
Using the KamLAND data we can determine the age of the earth as a function of and , as these parameters determine the reactor background that has to be subtracted from the KamLAND observed events to arrive at the geo-neutrino signal. In Fig.1 we show the age of the earth as a function of the mixing angle for the LMA-I () and LMA-II ( ) solutions kamfit . We estimate the total uncertainity in the age (for a given ) to be . The central shaded regions are the best fit points () and the two outer lines enclose the allowed region of parameter space with of and respectively. We see from Fig.1 that for the LMA-II solution ( at ) and (at ) . It is known from the radiochemical dating of meteorites that the age of the oldest meteorites (the chondrites) is andres . If the age of the earth is close to the age of the chondrites then the LMA-II solution is ruled out. We see from Fig1 that for the LMA-I solution, the age of the earth agrees with the age of the meteorites for the mixing angle in the range .
The KamLAND detector consists of about of liquid scintillator surrounded by photo-multiplier tubes. Electron anti-neutrinos are detected by means of the inverse beta decay by looking for the in delayed coincidence with the -ray from the neutron capture by protons (). The annihilate in the detector producing a total visible energy which is related to the initial energy,, as . Only those radioactive product ’s with energies above the inverse beta decay reaction threshold of can be detected. The main source of ’s and radiogenic heat in the earth are decays of , and . The from decay have and will not register in the KamLAND detector. In the decay chain of , only ’s from the decays of and are above the threshold for detection in KamLAND. In the decay chain, ’s from the beta decays of contribute to the KamLAND signal. Thorium decay ’s will contribute only to the (positron signal) energy bins below whereas Uranium ’s will contribute to all energy bins below . This fact enables us to separate the thorium neutrino signal from that of uranium. The energy spectrum of ’s from each of these beta decays can be expressed analytically as follows,
where is the Fermi function that accounts for the distortion of the spectrum due to Coulomb attraction of the outgoing with the nucleus, the sum is over each of the beta decays in the decay chain with value above the threshold, are constants obtained by the normalizing the spectrum for each term in the sum to unity. The remaining terms are kinematical factors for the two body decay (assuming the recoil energy of the nucleus is negligible). Other nuclear physics effects can be parameterized by adjusting the overall normalization to match the tabulated experimental values Behrens ( we fit the normalization of and spectrum by requiring that for Thorium (Uranium) where is the inverse beta decay cross section shown in (9) below.
The neutrino flux from the earth at a location of the detector can be expressed as the integral
| (2) |
where is the number density of the radioactive atoms and is the lifetime of and is the survival probability. Assuming that is approximately constant within a spherical shell, the expression for the flux from a shell of constant density of radioactive atoms can then be written as
| (3) |
where is the number of atoms per unit mass in the shell , is the mass of the ’ th shell and is the radius of the earth. The geometrical factor depends upon the thickness of the shell at the site of the detector and is given by
| (4) |
where are the inner and outer radii of the shell in units of , is the cosine of the angle between the position of the detector, , and a point inside the shell (the origin of the coordinates is chosen at the center of the earth). The survival probability of is a function of the distance between the detector and the point in the shell and is given explicitly by
| (5) |
Inserting in the expression for the geometrical factor and carrying out the integration over the shell thickness and the angular variable , we can express the energy dependence of as
| (6) |
where depends on the shell thickness and is slowly varying function of (when ). For the continental crust, with thickness , and is a monotonically decreasing function of the positron signal energy, , with and . For the oceanic crust with thickness of about , and decreases monotonically from to . For neutrinos coming from the mantle, there is an energy independent suppression, and we have with .
The total contribution to the neutrino flux from the crust and mantle can be written as
where the index denotes the continental crust,oceanic crust and mantle respectively. In the absence of significant chemical segregation of and the ratio can be taken to be the same in the crust and the mantle. is the location parameter which represents the fraction of the the continental crust vis-a-vis the oceanic crust surrounding the detector . For a detector in Japan which has the oceanic crust on one side and the Asian continental crust on the other side we may take .
The number of detection events in an energy bin centered at is,
| (8) |
where number of free target protons in the fiducial volume ( for this experiment) , t is the exposure time () and is the detector efficiency () and is the width of the energy bins (). The low energy cutoff in KamLAND is .
The cross section for the reaction is given by vogel1
| (9) |
where is the positron energy and is the corresponding momentum. Thorium neutrinos have a , whereas Uranium neutrinos contribute in the entire range of (where is the threshold of the lowest energy bin). The ratio of the neutrino events in the energy bins between , , and the events in energy bins , , depends only on the Thorium to Uranium ratio , and the spectral shape of and neutrinos folded with the cross section. The geology factor in the square brackets in (Determination of the age of the earth from Kamland measurement of geo-neutrinos) cancels out as it is independent of energy (to ). Specifically the ratio of the geo-neutrino events in the two energy ranges can be written in a simple form
| (10) |
where
| (11) |
and
| (12) |
One can determine the ratio and from that determine the global average abundance ratio of Th by U using 10. From the initial r-process abundance otsuki and the decay lifetimes of and () we can relate the time elapsed (in Giga-years) between between the supernova explosion where the earths were formed and the present,
| (13) |
We can directly relate the age of the earth to the experimentally measured quantity as
| (14) |
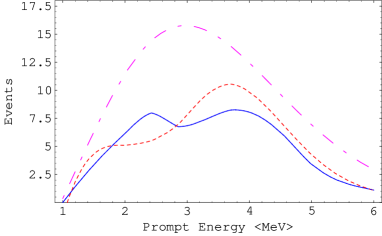
We calculate the reactor background using the procedure given in mur . We sum the neutrino flux from reactors using their power production and distances as input and assuming an average fuel composition in the ratio . The reactor neutrino flux is shown in Fig 2. We see that there although there is a significant difference between the reactor flux for the LMA-I and LMA-II solutions kamfit in the geo-neutrinos energy regime.
The Kamland experiment reports the events in and energy. Using the theoretical spectrum of the and geo-neutrinos we have distributed the of the events in the bin to and of this bin have been assigned to the events. In the energy range LMA-II reactor neutrinos are more suppressed than LMA-I, while in the energy range the LMA-I reactor neutrinos are more suppressed than LMA-II. After this reactor signal is subtracted from the KamLAND observed events, the ratio of geo events in the two energy windows , will go up as we go from from LMA-I to LMA-II.
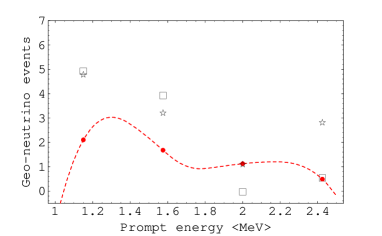
In Fig 3. we plot the simulated geo-neutrino events shown by points connected by dotted line - where we have used the input values of , , and . The geo-neutrino events have no dependence on . In the same figure we have show the experimental points (Kamland events minus the reactor background) where stars represent LMA-I and squares represent LMA-II. Both the LMA-I and LMA-II data points agree with the geo-signal within the error bars of the KamLAND data points.The ratio which can be read off from the graph is considerably large for the LMA-II points compared to the LMA-I points which leads to a large value of for LMA-II compared to LMA-I. The error in determination of from KamLAND is estimated as follows. The systematic error in each of and from Table II of kam is . The combined systematic and statistical error in is and in it is . The total systematic and statistical error in determination of is . The theoretical uncertainity in the initial r-process prediction of is . The assumption that the geometrical factor is energy independent introduces an error of . Added in quadrature the total error in is turns out to be . With this error we plot the and allowed region for as a function of mixing angle in Fig 1. We see that the LMA-II solution does not overlap with the solar system age of at . We emphasize that the LMA-II data points fit the geo events in KamLAND, its the extra constraint of requiring (which amounts to ) which the LMA-II solution does not fulfill. We must add the cautionary caveat that although there is a large magnification in the ratio in going from LMA-I to LMA-II, this ratio is meaningful when and are non-zero. The present KamLAND observations kam of geo-neutrino events are consistent with zero at , so the conclusions derived in this paper should be treated as results.
Acknowledgments I thank Anjan Joshipura for his help and for valuable discussions at every stage of this work.
References
- (1) K.Eguchi et al., KamLAND Collaboration, hep-ex/0212021.
- (2) G.Eder, Nucl. Phys. 78,657 (1966);G.Marx, Czech.J.Phys.B,19,1471(1969); C.Avilez, et al. Phys. Rev.D. 23,1116 (1981).
- (3) L.M.Krauss et al.,Nature,310,191(1984).
- (4) M.Kobayashi and Y.Fukao, Geophys. Res. Lett. 18 633 (1991).
- (5) C.G.Rothschild, M.C.Chen and F.P. Calaprice, Geophys. Res. Lett. 25 1083(1998).
- (6) R.S.Raghavan et al., Phys. Rev. Lett. 80, 635 (1998).
- (7) G.Fiorentini, F.Mantovani and B. Ricci, nucl-ex/0212008.
- (8) G.Fiorentini et al., hep-ph/0301042.
- (9) D.Arnett,Supernovae and nucleosynthesis, Princeton Univ. Press, Princeton, NJ, 1996.
- (10) K.Otsuki, G.J.Mathews, K.Toshitaka, astro-ph/0207596.
- (11) V. Barger et al. hep-ph/02122126; G.L.Fogli et al hep-ph/0212127; A.Bandopadhyay et al. hep-ph/0212146 ; J.N.Bahcall et al. hep-ph/0212147; H.Nunokawa et al. hep-ph/0212202; P.C.Hollanda et al. hep-ph/0212270 ; M. Maltoni, T. Schwetz, J.W.F. Valle, hep-ph/0212129; M.Maltoni,T. Schwetz,M.A. Tortola,J.W.F.Valle. Phys.Rev.D67:013011,2003.
- (12) E.Andres and N.Grevesse, Geochim. Cosmochim. Acta 53,191 (1989);S.Hart and A.Zindler, Chem. Geol. 57,247 (1986).
- (13) H. Behrens and J. Janecke, Numerical tables for Beta-Decay and Electron Capture, Springer Verlag, Berlin,1969.
- (14) C.Bemporad, G.Gratta and P.Vogel, Rev. Mod. Phys. 74, 297 (2002); P.Vogel and J.F.Beacom, Phys. rev. D60, 053003(1999).
- (15) H.Murayama and A.Pierce, Phys. Rev D 65,013012 (2002).